Summary To determine if flower nutrient composition can be used to predict fruit quality, a field experiment was con-ducted over three seasons (1996–1999) in a commercial or-ange orchard (Citrus sinensis (L.) Osbeck cv. ‘Valencia Late’, budded on Troyer citrange rootstock) established on a calcare-ous soil in southern Portugal. Flowers were collected from 20 trees during full bloom in April and their nutrient composition determined, and fruits were harvested the following March and their quality evaluated. Patterns of covariation in flower nutri-ent concnutri-entrations and in fruit quality variables were evaluated by principal component analysis. Regression models relating fruit quality variables to flower nutrient composition were developed by stepwise selection procedures. The predictive power of the regression models was evaluated with an inde-pendent data set. Nutrient composition of flowers at full bloom could be used to predict the fruit quality variables fresh fruit mass and maturation index in the following year. Magnesium, Ca and Zn concentrations measured in flowers were related to fruit fresh mass estimations and N, P, Mg and Fe concentrations were related to fruit maturation index. We also established ref-erence values for the nutrient composition of flowers based on measurements made in trees that produced large (> 76 mm in diameter) fruit.
Keywords: Citrus, f loral analysis, iron chlorosis, models, nu-trients, principal component analysis.
Introduction
Iron chlorosis in commercial fruit plants grown on calcareous soils is a problem that still has no simple solution (Démétri-adrès et al. 1964, Chandra 1966) because the extent of the cor-rection required is related to yield, fruit size and quality. Tagliavini et al. (2000) summarized the economical impact of iron chlorosis in kiwifruit (Actinidea deliciosa L.), peach (Prunus persica L.) and pear (Pyrus communis (L.) Batsch) orchards established on calcareous soils in Italy, Spain and
Greece, and concluded that yield losses were directly related to the severity of iron chlorosis.
El-Kassas (1984) reported that the negative effect of iron chlorosis on gross yield and fruit quality of Balady lime (Citrus aurantifolia L.) resulted in smaller fruit that were more acidic and had lower ascorbic acid content. Iron chlorosis may also lead to a delay in fruit ripening in orange (Citrus sinensis (L.) Osbeck) and peach (Sanz et al. 1997b, Pestana 2000, Pestana et al. 2001a, 2002, Álvarez-Fernández et al. 2003). Correction of iron chlorosis with foliar sprays containing Fe resulted in larger oranges, with a gain of more than 35% in the gross income of the grower (Pestana et al. 2001a).
It is estimated that 20 to 50% of fruit trees in the Mediterra-nean basin suffer from iron chlorosis (Jaegger et al. 2000). Calcareous soils are strongly buffered, with a pH between 7.5 and 8.5. This strong buffering capacity combined with low an-nual precipitation, which is typically < 500 mm year– 1in arid and semi-arid Mediterranean climates, enhances iron chloro-sis (Loeppert 1986).
Until rootstocks tolerant to iron chlorosis and with other favorable agronomic characteristics become available, the pre-vention or correction of iron chlorosis is of paramount impor-tance to fruit growers (see Pestana et al. 2003 for a review). Sanz et al. (1993) proposed that floral analysis could be used to determine the nutritional status of crops at an early stage, because the nutrient composition of flowers at full bloom is often related to the concentrations of the same nutrients in leaves taken 120 days later, and they further suggested that the nutrient composition of flowers could be used to predict iron deficiency in pear trees. Floral nutrient analysis has now been developed for several fruit trees including pear (Sanz et al. 1993, 1994, Sanz and Montañés 1995), peach (Sanz and Montañés 1995, Sanz et al. 1997a, Belkhodja et al. 1998, Igartua et al. 2000), nectarine (Prunus persica L. var. nectar-ine) (Toselli et al. 2000), apple (Mallus domestica L.) (Mo-rales et al. 1998, Sanz et al. 1998), walnut (Juglans regia L.) (Drossopoulos et al. 1996), olive (Olea europea L.) (Bouranis © 2005 Heron Publishing—Victoria, Canada
Relationships between nutrient composition of flowers and fruit
quality in orange trees grown in calcareous soil
MARIBELA PESTANA,
1,2PEDRO BEJA,
3PEDRO JOSÉ CORREIA,
1AMARILIS DE
VARENNES
4and EUGÉNIO ARAÚJO FARIA
11
Centro de Desenvolvimento de Ciências e Técnicas de Produção Vegetal, FERN, Universidade do Algarve, Campus de Gambelas, 8005-139 Faro, Portugal
2
Corresponding author ( fpestana@ualg.pt)
3
ERENA, Ordenamento e Gestão de Recursos Naturais, Av. Visconde Valmôr, 11 – 3°, 1000-289 Lisboa, Portugal
4
Instituto Superior de Agronomia, Departamento de Química Agrícola e Ambiental, Tapada da Ajuda, 1349-017 Lisboa, Portugal
Received August 3, 2004; accepted November 20, 2004; published online April 1, 2005
et al. 1999), pistachio (Pistacia lentiscus L.) (Vemmos 1999), almond (Prunus amygdalus L.) (Bouranis et al. 2001), coffee (Martinez et al. 2003) and citrus (Pestana et al. 2001b, 2004). Recently, Pestana et al. (2004) established a model based on the Mg:Zn ratio in flowers of orange trees that can predict the development of iron chlorosis in April. Based on this finding and the approach developed by Sanz et al. (1993),our working hypothesis was that the chemical analysis of flowers can be used to predict fruit quality in the following season, thus al-lowing a predictive quantitative assessment of fruit variables. To test our hypothesis, we applied principal component analy-sis to determine the relationships between the nutrient compo-sition of orange flowers and fruit quality. We also established reference values for the nutrient composition of flowers based on the values obtained in trees that produced large fruit.
Materials and methods
The study site was a commercial orchard located in southern Portugal (37°03′ N, 8°23′ W; Algarve). At the start of the ex-periment, the orange trees (Citrus sinensis (L.) Osbeck cv. ‘Valencia Late’ budded on Troyer citrange rootstock (Pon-cirus trifoliata (L.) Raf. × Citrus sinensis (L.) Osbeck) were 12 years old.
Soil samples were taken at a depth of 30 cm from between rows of trees at the beginning of the experiment (April 1996), oven-dried for 48 h at 30 °C, and then passed through a 2-mm sieve. Soil pH was determined in soil–water suspensions (1:2.5 v/v). Soil potassium (K) and phosphorus (P) were ex-tracted with solutions of ammonium acetate (Riehm 1958) and sodium bicarbonate (Olsen and Sommers 1982), respectively. The P content in extracts was quantified colorimetrically, and K was measured by flame photometry (Isaac and Kerber 1971). Organic carbon was determined by oxidation with di-chromate (Walkley and Black 1934). Total carbonates were measured by quantifying the CO2produced from the reaction of soil with HCl (Allison and Moodie 1965) and active lime by the Drouineau method (Drouineau 1942). Soil characteristics are presented in Table 1. The soil is characterized as a calcare-ous, sandy clay–loam (Calcaric Fluvisol).
The climate of the region is typically Mediterranean. Total precipitation during 1996 was about 1030 mm, whereas dur-ing 1997 and 1998, only 594 and 298 mm, was recorded, re-spectively. Compared with the 20-year-period mean value of 514 mm (INMG 1991), 1996 was atypical, with more rain in January, March and December than normal. In contrast, sea-sonal variation in temperature was similar during the 3 years of the experiment. Maximum and minimum monthly tempera-tures during the 3 years were 23 ± 5.5 °C and 12 ± 3.8 °C, respectively.
Nutrient composition of f lowers
Twenty orange trees were randomly selected and labeled in spring of 1996. The experiment was conducted over three growing seasons, from April 1996 to March 1999. Each year at full bloom (more than 75% of flowers open), 30 flowers were randomly collected per tree, irrespective of branch type, in all canopy orientations. Flowers were taken from the distal part of the branches.
Flowers, including petals, sepals, reproductive parts, bracts and peduncles, were washed with distilled water and oven-dried at 60 °C for 48 h. Plant material was ground, ashed at 450 °C, and digested in 10 ml of 1 M HCl. Nutrient concen-trations were determined according to standard procedures (AOAC 1990). Nitrogen was analyzed by the Kjeldahl method, P was determined colorimetrically by the molyb-dovanadate method, K was measured by flame photometry, and Mg, Ca, Fe, Mn and Zn were measured by atomic absorp-tion spectrometry.
Fruit quality variables
In March of each year (1997, 1998, 1999), 60 to 190 oranges at the same stage of maturity were collected from around the can-opy of the selected trees. The fruit were transported to the lab-oratory and stored at 4 °C. Fruit fresh mass and diameter were determined for each fruit. The juice of each fruit was extracted with a mechanical juicer and separately analyzed for total sol-uble solids (expressed as ° Brix), and citric acid concentration (expressed as a percentage of total juice content). All analyses were performed according to standard methods (AOAC 1990). The maturation index of citrus fruit was determined as the ra-tio between total soluble solids concentrara-tion and citric acid concentration.
Statistical analysis
The experiment had a completely randomized design, and the values obtained for each tree and each variable were consid-ered independent replications. The number of trees sampled decreased from 20 to 18 in the last year because the grower re-moved two trees. All statistical analyses, including principal component and multiple regressions, were carried out using STATISTICA software (Statsoft 1995). Means were compared by analysis of variance (ANOVA) and by using the Duncan Multiple Range Test at P < 0.05.
The main patterns of covariation in the parameters that de-scribed the nutritional composition of flowers and fruit quality Table 1. Chemical and physical variables of the soil at the beginning
of the experiment (April 1996).
Parameters Values Potassium (mg K kg– 1) 398 Phosphorus (mg P kg– 1) 166 Organic carbon (%) 1.2 Total lime (%) 17 Active lime (%) 9 pH (H2O) 7.7 Sand (%) 60 Silt (%) 11 Clay (%) 29
Texture Sandy clay–loam
variables were evaluated by principal component analysis (PCA). This is an exploratory multivariate statistical method that reduces many parameters to a small number of newly de-rived parameters. Principal components contain the same in-formation as the original parameters, but have the advantage of being mutually uncorrelated so that there is no redundant in-formation between them. This procedure reveals associations in the data that cannot be found by analyzing the parameters separately.
Each extracted component or factor accounts for part of the variation in all data sets and is associated with an eigenvalue. The eigenvalue associated with each eigenvector is a measure of the variance within parameters of the corresponding princi-pal component (Legendre and Legendre 1998). For interpreta-tion of the data, only the components with eigenvalues greater than one were kept, in agreement with the Kaiser criteria (Legendre and Legendre 1998). To obtain a better representa-tion of gradients in flower nutrients associated with fruit qual-ity variables, a varimax (normalized) rotation was applied to the PCA results. This approach simplifies interpretation of the patterns associated with any given parameter of interest, be-cause the rotation maximizes the loading of each parameter in a single factorial axis.
To test if flower characteristics can be used to assess fruit quality in orange trees, fruit variables (fruit fresh mass and maturation index) were related to nutrient concentrations in flowers measured at full bloom in the previous season, based on multiple regression models of the form: Y = b0+ b1X1+ b2X2+ … + bnXn. For each coefficient (b1, b2, …, bn), the stan-dard error was also calculated. The incorporation of parame-ters (X1... Xn) in the models was done by stepwise backward selection to produce regression models without serious multi-colinearity. In each case, the presence of quadratic effects (Xi2) and interactions (XiXj) were tested for the variables included in the best stepwise model, to evaluate whether they could sig-nificantly improve its predictive power and interpretability. Similar regression approaches have already been used to esti-mate relationships between yield and leaf nutrient composi-tion in carob (Ceratonia siliqua L.) trees (Correia et al. 2002), and between nutrient concentrations in citrus flowers and chlorophyll content later in the season (Pestana et al. 2004).
To test the regression models obtained, we used independent data from a different orchard. The variables were determined in 14 ‘Valencia Late’ orange trees using the procedures previ-ously described, and a new coefficient of determination (R2) was calculated based on the independent data. The equation
used was: R y y y y 2 2 2 = ′ − − mean mean Σ Σ ( ) ( )
where y is the value of each observation, ymean is the mean value of all observations and y′ is the value estimated by the original model. When a model is applied to an independent data set, different from that used for the establishment of the original model, the difference between the two R2values ex-presses the loss of predictive power of the model (Glantz and Slinker 1990).
Reference values were estimated by calculating the mean concentration of each nutrient in flowers collected from trees that produced fruit with diameters greater than 76 mm.
Results
During the 3 years (1996–1998) of the experiment, mean N concentration in flowers ranged from 20.5 to 29.7 g kgDM
1 − . Phosphorus concentration ranged from 2.5 to 2.8 g kgDM
1 − , and K flower mean concentrations were between 14.8 and 24.0 g kgDM−1. Calcium and Mg concentration ranges were 3.0–7.2 and 1.7–2.3 g kgDM
1
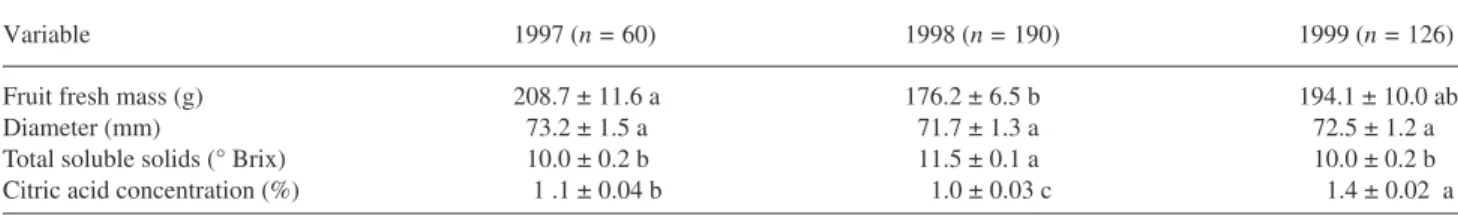
− , respectively. Micronutrient concentra-tions were in the ranges of 22.0–62.0 mg kgDM−1 for Fe, 11.3– 20.2 mg kgDM 1 − for Zn and 11.4 –12.8 mg kg DM 1 − for Mn. Fruit fresh mass was higher in 1997 than in 1998, with an in-termediate value in 1999 (Table 2). Mean fruit diameter was similar in all years. The concentration of total soluble solids was higher in 1998 than in 1997 and 1999. Citric acid concen-tration was highest in 1999.
Principal component analysis of flower nutrients (N, P, K, Ca, Mg, Fe, Zn and Mn) in 1996, 1997 and 1998, and quality variables of fruit sampled in 1997, 1998 and 1999, extracted four axes with eigenvalues > 1, representing about 80% of the overall variability in the data. After the rotation of the PC axis with the varimax (normalized) approach, two axes represented almost exclusively the interrelationships between flower nutri-ents (not shown), whereas the other two axes showed patterns associated with fruit quality variables (Figure 1).
The first axis, which reflects fruit quality, represented varia-tion in fruit size expressed as diameter and fresh mass (PC3). Fruit size was positively associated with increases in P centration in flowers (and less strongly with increases in centrations of K, Mg and Zn) and decreases in Ca and Mn con-centrations, and to a lesser extent in total soluble solids
Table 2. Mean value and standard deviation (SD) for some fruit quality variables measured in March (1997, 1998 and 1999). In each row, means followed by different letters are significantly different (P < 0.05; Duncan test).
Variable 1997 (n = 60) 1998 (n = 190) 1999 (n = 126)
Fruit fresh mass (g) 208.7 ± 11.6 a 176.2 ± 6.5 b 194.1 ± 10.0 ab
Diameter (mm) 73.2 ± 1.5 a 71.7 ± 1.3 a 72.5 ± 1.2 a
Total soluble solids (° Brix) 10.0 ± 0.2 b 11.5 ± 0.1 a 10.0 ± 0.2 b
Citric acid concentration (%) 1 .1 ± 0.04 b 1.0 ± 0.03 c 1.4 ± 0.02 a
concentration (Figure 1).
Fruit diameter (D) and fresh mass ( y axis) were strongly correlated as shown in Figure 1, (R2= 0.94; F
(1,53)= 806.2; P < 0.0001) and the relationship can be described by the equation (regression coefficients are given ± SE):
y = (7.9 ± 0.3)D – (374.7 ± 20.1) (1)
The variables of fruit maturation, such as maturation index and citric acid concentration, were represented in a separate axis (PC4) and were totally unrelated to the fruit size variables. Increases in maturation index were associated with decreases in citric acid concentration. The variations in fruit maturation variables along the PC4 axis were associated with a nutritional gradient in flowers contrasting increases in P concentration with increases in Fe concentration, and less strongly with in-creases in N, Zn and Mg concentrations (Figure 1).
Several regression models were tested to estimate fruit qual-ity variables based on the nutrient composition of flowers at full bloom in the previous year. In all cases, the best stepwise models included linear effects only, and no significant im-provement was obtained by the addition of quadratic or inter-action terms. The best model obtained for fruit fresh mass was dependent on the concentrations of Mg, Ca and Zn (regression coefficients are given ± SE):
y = (31.6 ± 13.6)Mg – (17.6 ± 2.7)Ca
+ (4.7 ± 1.2)Zn + (139.6 ± 31.6) (2)
where y is fruit fresh mass (g), and Mg (g Mg kgDM 1 − ), Ca (g Ca kgDM 1 − ) and Zn (mg Zn kg DM 1
− ) are the concentrations of these nutrients in flowers (R2= 0.46; F
(3,51)= 14.8; P < 0.0001).
When the concentration of P was incorporated in a regression model instead of Mg concentration, the equation had a margin-ally lower coefficient of determination (R2= 0.44; F(3,50)= 14.7; P < 0.0001).
We also tested the possibility of using the nutrient composi-tion of flowers to estimate the maturacomposi-tion index, because this index is normally used to determine the harvest date of citrus fruit. The best model included the concentrations of N, P, Mg and Fe in flowers (R2= 0.55; F
(4,50)= 15.1; P < 0.0001) accord-ing to the equation (regression coefficients are given ± SE):
y = (0.07 ± 0.01)Fe + (0.16 ± 0.05)N + (1.78 ± 0.58)Mg
– (1.03 ± 0.43)P + (1.8 ± 0.1) (3)
where y is maturation index, and N (g N kgDM−1), P (g P kg DM 1 − ), Mg (g Mg kgDM 1 − ) and Fe (mg Fe kg DM 1
− ) are the concentrations of these nutrients in flowers.
An independent set of 14 ‘Valencia Late’ orange trees from a different orchard was used to evaluate the predictive power of the best-fit equations. Fresh fruit mass ranged between 139 and 203 g and the maturation index ranged from 5.4 to 8.4. The observed mean value for fruit fresh mass was 158 ± 33 g, whereas the corresponding estimated value was 162 ± 24 g. There was a loss of 6% in the predictive power of the model (Table 3) as estimated by comparing R2of the model (0.46) with the calculated R2when the independent data were used in the model (0.40).
For the maturation index, the observed mean value for the independent data set was 6.3 ± 1.5, whereas the mean esti-mated by the model was 7.4 ± 1.5. The model explained 55% of the variability of the original data set, but when the inde-pendent data set was used, the R2dropped to 0.28, indicating a 27% reduction in its predictive power (Table 4).
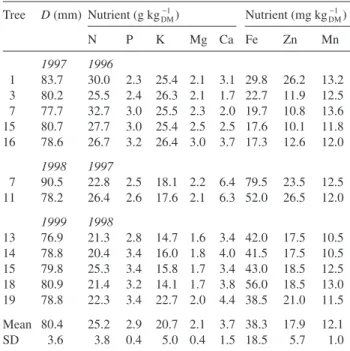
To establish reference values for the nutrient composition of flowers, we calculated mean values for the nutrient concentra-tions of flowers from trees that produced fruit with a diameter greater than 76 mm (class of commercial fruit with the highest price) (Table 5). The reference values for the macronutrients (g kgDM−1 ± SD) were: 25.2 ± 3.8 N; 2.9 ± 0.4 P; 20.7 ± 5.0 K; 2.1 ± 0.4 Mg; and 3.7 ± 1.5 Ca. The reference values for the micronutrients (mg kgDM
1
− ± SD) were: 38.3 ± 18.5 Fe; 17.9 ± 5.7 Zn; and 12.1 ± 1.0 Mn.
Discussion
It was possible to estimate fruit quality parameters that are af-fected by iron chlorosis, namely fruit diameter, fresh mass and maturation index (Sanz et al. 1997b), based on analysis of the nutrient composition of flowers. The fresh mass of fruits was positively correlated with their diameter (cf. Fernández 1995). The variation in the two variables was associated with a nutri-tional gradient that contrasted increases in P, K, Mg and Zn concentrations with increases in Ca and Mn concentrations in the flowers.
In accordance with the established regression model, the concentrations of Mg, Ca and Zn in the flowers could be used Figure 1. Rotated axis (varimax normalized) of a principal component
analysis of nutrients in flowers during 3 consecutive years (1996, 1997 and 1998) and quality variables of fruit sampled the following year (1997, 1998 and 1999). Abbreviations: FFM = fruit fresh mass; D = diameter; TSS = total soluble solids; MI = maturation index; CA = citric acid concentration; Nf, Kf, Pf, Mgf, Caf, Fef, Znf, Mnf = concentration of the respective nutrients in flowers. Vectors represent the parameter (nutrients and fruit quality variables) loadings in each principal component, which are proportional to the relative contribu-tion of each parameter to that component. The axes shown here are those reflecting variation in fruit quality variables (PC3 and PC4).
to predict fruit fresh mass in the following year. Although the concentrations of Zn and Mg in the flowers were positively re-lated to fruit fresh mass, Ca concentration showed an inverse trend, indicating that high concentrations of Mg and Zn, and low concentrations of Ca in flowers in April were associated with large fruit formed on those trees.
Carranca et al. (1993) obtained positive relationships be-tween the size of ‘Valencia Late’ orange and the concentration of Mg in the leaves of fruiting branches, which may express a behavior similar to that of flowers. The fact that the present
model includes the concentrations of Mg and Zn in flowers strengthens the importance of these nutrients in citrus grown in calcareous soils. Previously, Pestana et al. (2004) developed a model based on Mg and Zn concentrations in citrus flowers to estimate the concentration of chlorophyll in leaves, 90 days after full bloom.
Crop load has a marked effect on the vegetative growth of Citrus (Spiegel-Roy and Goldschmidt 1996). During the “on” year of alternate-bearing cultivars, there is a depletion of nutri-ent reserves at the expense of leaf endogenous pools (Gold-schmidt and Koch 1996). In our study, because of the absence of yield data, it was impossible to quantify the effect of crop load on nutrient retranslocation. There was no clear effect of year on fruit quality (Table 2). Therefore, we assumed that the effect of crop load on flower nutrient retranslocation was small.
The maturation index is used to evaluate the maturation of fruits, which is characterized by variations in the composition and concentration of several juice components (Spiegel-Roy and Goldschmidt 1996). Variation in maturation index was re-lated to a nutritional gradient that contrasted the increase in P concentration with increases in the concentrations of Fe, N, Zn and Mg in the flowers. It was possible to estimate the matura-tion index of oranges based on the concentramatura-tions of Fe, N, Mg and P in the flowers. However, the predictive power of this model (Equation 3) decreased by 27% when tested with inde-pendent data, suggesting that the maturation index depends on factors other than the nutritional status of the trees, such as climatic conditions during fruit growth.
Increases in the concentrations of N, Mg and Fe in flowers led to a greater maturation index. The behavior of Fe is in ac-Table 4. Concentrations of Fe, N, Mg and P in flowers of citrus and
observed and calculated (based on Equation 3) maturation index (SD = standard deviation).
Tree Nutrient (g kgDM 1 −
) Maturation index
Fe N Mg P Observed Calculated % Difference
1 50 1.5 1.2 1.7 8.5 6.0 –29.9 2 53 1.6 1.9 2.8 8.7 6.1 –29.3 3 42 1.5 1.6 2.4 9.0 5.4 –40.0 4 52 1.5 1.7 2.8 8.9 5.8 –34.3 5 93 1.7 1.7 3.0 6.8 8.4 +23.0 6 59 1.7 1.9 3.2 7.4 6.2 –16.7 7 60 1.6 1.8 3.2 6.8 6.3 –8.5 8 57 1.4 1.9 3.1 7.1 6.1 –13.7 9 51 1.5 1.7 3.0 6.9 5.6 –18.0 10 57 1.8 1.6 2.2 7.0 6.6 –5.7 11 78 1.5 1.7 2.8 7.8 7.6 –2.4 12 51 1.6 1.7 2.6 6.9 5.9 –14.6 13 50 1.5 1.8 2.3 6.3 6.4 +0.7 14 42 1.3 1.8 2.5 5.9 5.6 –6.3 Mean 57 1.5 1.7 2.7 7.4 6.3 –14.0 SD 14 0.1 0.1 0.4 1.0 0.8 16.3
Table 3. Concentrations of Ca, Mg and Zn in flowers of citrus and the observed and calculated (based on Equation 2) values for fruit fresh mass (SD = standard deviation).
Tree Nutrient (g kgDM 1
− ) Fruit fresh mass (g)
Ca Mg Zn Observed Calculated % Difference
1 4.3 1.2 10.5 146.1 151.7 +3.9 2 5.4 1.9 15.5 180.1 176.6 –2.0 3 3.8 1.6 13.5 139.0 187.3 +34.7 4 4.9 1.7 12.5 157.5 164.8 +4.7 5 6.8 1.7 14.0 162.7 139.0 –14.5 6 6.2 1.9 12.5 154.4 148.3 –4.0 7 5.4 1.8 14.0 203.2 168.3 –17.2 8 5.8 1.9 13.5 170.8 160.6 –6.0 9 4.5 1.7 12.5 144.8 173.9 +20.1 10 5.1 1.6 12.5 159.0 159.4 +0.2 11 6.2 1.7 14.5 158.7 153.5 –3.3 12 4.6 1.7 13.0 151.2 173.0 +14.4 13 6.7 1.8 14.5 122.1 146.6 +20.0 14 5.1 1.8 12.0 118.9 162.1 +36.3 Mean 5.3 1.7 13.2 157.7 161.8 +3.9 SD 0.3 0.03 0.3 33 24.1 26.9
Table 5. Values of fruit diameter (D) and nutrient composition of flowers used to calculate the reference values of nutrients in flowers (SD = standard deviation).
Tree D (mm) Nutrient (g kgDM−1) Nutrient (mg kgDM 1 − ) N P K Mg Ca Fe Zn Mn 1997 1996 1 83.7 30.0 2.3 25.4 2.1 3.1 29.8 26.2 13.2 3 80.2 25.5 2.4 26.3 2.1 1.7 22.7 11.9 12.5 7 77.7 32.7 3.0 25.5 2.3 2.0 19.7 10.8 13.6 15 80.7 27.7 3.0 25.4 2.5 2.5 17.6 10.1 11.8 16 78.6 26.7 3.2 26.4 3.0 3.7 17.3 12.6 12.0 1998 1997 7 90.5 22.8 2.5 18.1 2.2 6.4 79.5 23.5 12.5 11 78.2 26.4 2.6 17.6 2.1 6.3 52.0 26.5 12.0 1999 1998 13 76.9 21.3 2.8 14.7 1.6 3.4 42.0 17.5 10.5 14 78.8 20.4 3.4 16.0 1.8 4.0 41.5 17.5 10.5 15 79.8 25.3 3.4 15.8 1.7 3.4 43.0 18.5 12.5 18 80.9 21.4 3.2 14.1 1.7 3.8 56.0 18.5 13.0 19 78.8 22.3 3.4 22.7 2.0 4.4 38.5 21.0 11.5 Mean 80.4 25.2 2.9 20.7 2.1 3.7 38.3 17.9 12.1 SD 3.6 3.8 0.4 5.0 0.4 1.5 18.5 5.7 1.0
cordance with the finding that fruit from trees suffering from iron chlorosis mature later than fruit borne on non-chlorotic trees (Pestana et al. 2001a, 2002). Iron affects the percentage of citric acid in the juice because of its role in aconitase activ-ity (Sadka et al. 2000). The concentration of P in flowers had an inverse effect compared with the other nutrients. In citrus, P concentration is higher in flowers than in leaves (Pestana et al. 2004) and, based on PCA, it is possible to assume that P dy-namics in fruit may be associated with citric acid, which is known to decrease during fruit maturation (Spiegel-Roy and Goldschmidt 1996). Magnesium appears to play an important role in fruit quality, because it is positively related to fresh mass and maturation index (Equations 2 and 3). Magnesium tends to accumulate at a uniform rate in fruit (Shear 1980) and can compete with Ca for uptake and translocation, which may explain both the positive relationship between Mg and fruit fresh mass and the inverse relationship between fruit fresh mass and Ca.
The use of flowers to diagnose iron chlorosis brings forward the evaluation of the nutritional status from October (the rec-ommended date for leaf sampling in Citrus) to April (Pestana et al. 2004). However, the establishment of reference values for each species and variety is needed for this purpose. Refer-ence values are normally determined, taking into account the yield of each tree (Sanz and Montañés 1995). Because it was not possible to obtain fruit production from each selected tree in our study, the nutrient concentrations that are proposed as reference values for flowers of orange trees were calculated based on flowers that developed into large fruit (> 76 mm in diameter) of commercial value. We believe that this approach can be used to evaluate the results of floral analysis because it is based on nutritional balances that lead to high quality.
In conclusion, nutrient composition of flowers during full bloom in a particular year may be used to estimate fruit quality variables (i.e., fruit fresh mass and maturation index) in the following year. These results were validated through the inter-polation of external and independent data. Based on the pro-posed models, it is possible to correct the nutritional status of trees before yield is affected. Reference values for floral analy-sis were established based on trees that produce large fruit (> 76 mm in diameter).
Acknowledgments
This work was supported by the POCTIA project 528/2003 and by the CDCTPV (I&D Unity No. 1584). We thank Mr. Nuno Correia and Mr. Dias Rafael for the use of their orchards.
References
Allison, L.E. and C.D. Moodie. 1965. Carbonates. In Methods of Soil Analysis. Part 2. Agronomy Monograph. Ed. C.A. Black. ASA, CSSA and SSSA, Madison, WI, pp 1379–1400.
Álvarez-Fernández, A., P. Paniagua, J. Abadía and A. Abadía. 2003. Effects of Fe deficiency chlorosis on yield and fruit quality in peach (Prunus persica L. Batsch). J Agric. Food Chem. 51:5738–5744. AOAC. 1990. Official methods of analysis. Assoc. Official Agric.
Chem., Washington, DC, 684 p.
Belkhodja, R., F. Morales, M. Sanz, A. Abadía and J. Abadía. 1998. Iron deficiency in peach trees: effects on leaf chlorophyll and nutri-ent concnutri-entrations in flowers and leaves. Plant Soil 203:257–268. Bouranis, D.L., C.K. Kitsaki, S.N. Chorianopoulou, G. Aivalakisand and J.B. Drossopoulos. 1999. Nutritional diagnosis of olive tree flowers. J. Plant Nutr. 22:245–257.
Bouranis, D.L., S.N. Chorianopoulou, G. Zakynthinos, G. Sarlis and J.B. Drossopoulos. 2001. Flower analysis for prognosis of nutri-tional dynamics of almond tree. J. Plant Nutr. 24:705–716. Carranca, C.F., J. Baeta and M.A.C. Fragoso. 1993. Effect of NK
fer-tilization on leaf nutrient content and fruit quality of ‘Valencia Late’ orange trees. In Optimization of Plant Nutrition. Eds. M.A.C. Fragoso and M.L. van Beusichem. Kluwer Academic Publishers, Dordrecht, The Netherlands, pp 445–448.
Chandra, L. 1966. Responses of rough lemon and trifoliata orange grown in calcareous and noncalcareous soils. Adv. Front. Plant Sci. 13:187–193.
Correia, P.J., I. Anastácio, M.F. Candeias and M.A. Martins-Loução. 2002. Nutritional diagnosis in carob-tree (Ceratonia siliqua L.): relationships between yield and leaf mineral concentration. Crop Sci. 42:1577–1583.
Démétriadrès, S.D., N.A. Gavalas and S.E. Papadopoulos. 1964. Trials for the control of the lime-induced chlorosis in fruit trees in Greece. I. Preliminary observations on peach and lemon trees. Annu. Inst. Phytopathol. 7:28–36.
Drossopoulos, J.B., G.G. Kouchaji and D.L. Bouranis. 1996. Sea-sonal dynamics of mineral nutrients by walnut tree reproductive organs. J. Plant Nutr. 19:421–434.
Drouineau, J. 1942. Dosage rapid du calcaire actif des sols. Ann. Agron. 1942:441–450.
El-Kassas, S.E. 1984. Effect of iron nutrition on the growth, yield, fruit quality, and leaf composition of seed balady lime trees grown on sandy calcareous soils. J. Plant Nutr. 7:301–311.
Fernández, J.L. 1995. La naranja, composición y cualidades de sus zumos y esencias. Generalitat Valenciana, Valencia, Spain, 415 p. Glantz, S. and B.K. Slinker. 1990. Primer of applied regression and
analysis of variance. McGraw-Hill, New York, 759 p.
Goldschmidt, E.E. and K.E. Koch. 1996. Citrus. In Photoassimilate Distribution in Plants and Crops. Source–Sink Relationships. Eds. E. Zamski and A.A. Schaffer. Marcel Dekker, New York, pp 797–824.
INMG. 1991. O Clima de Portugal. Normais climatológicas da região do “Alentejo e Algarve” correspondentes a 1951–1980. Instituto Nacional de Meteorologia e Geofísica, Lisbon, Portugal, 98 p. Igartua, E., R. Grasa, M. Sanz, A. Abadía and J. Abadía. 2000.
Prog-nosis of iron chlorosis from the mineral composition of flowers in peach. J. Hortic. Sci. Biotech. 75:111–118.
Isaac, R.A. and J.D. Kerber. 1971. Atomic absorption and flame pho-tometry: techniques and uses in soil, plant, and water analysis. In Instrumental Methods for Analysis of Soils and Plant Tissue. Ed. L.M. Walsh. Soil Sci. Soc. Am., Madison, WI, pp 17–37. Jaeger, B., H. Goldbach and K. Sommer. 2000. Release from lime
in-duced iron chlorosis by CULTAN in fruit trees and its characterisa-tion by analysis. Acta Hortic. 531:107–113.
Legendre, P. and L. Legendre. 1998. Numerical ecology. Elsevier, Amsterdam, 853 p.
Loeppert, R.H. 1986. Reactions of iron and carbonates in calcareous soils. J. Plant Nutr. 9:195–214.
Martinez, H.E.P., R.B. Souza, J. Abadía, V.H. Venegas and M. Sanz. 2003. Coffee-tree floral analysis as a means of nutritional diagno-sis. J. Plant Nutr. 26:1467–1482.
Morales, F., R. Grasa, A. Abadía and J. Abadía. 1998. Iron chlorosis paradox in fruit trees. J. Plant Nutr. 21:815–825.
Olsen, R.A. and L.E. Sommers. 1982. Phosphorus. In Methods of Soil Analysis. Part 2. Eds. A.L. Page, R.H. Miller and D.R. Keeney. Soil Sci. Soc. Am., Madison, WI, pp 403–430.
Pestana, M., P.J. Correia, A. de Varennes, J. Abadía and E.A. Faria. 2001a. Effectiveness of different foliar applications to control iron chlorosis in orange trees grown on a calcareous soil. J. Plant Nutr. 24:613–622.
Pestana, M., P.J. Correia, A. de Varennes, J. Abadía and E.A. Faria. 2001b. The use of floral analysis to diagnose the nutritional status of oranges trees. J. Plant Nutr. 24:1913–1923.
Pestana, M., P.J. Correia, M.G. Miguel, A. de Varennes, J. Abadía and E.A. Faria. 2002. Foliar treatments as a strategy to control iron chlorosis in orange trees. Acta Hortic. 594:223–228.
Pestana, M., A. de Varennes and E.A. Faria. 2003. Diagnosis and cor-rection of iron chlorosis in fruit trees: a review. Food Agric. Envi-ron. 1:46–51.
Pestana, M., A. de Varennes, M.J. Goss, J. Abadía and E.A. Faria. 2004. Floral analysis as a tool to diagnose iron chlorosis in orange trees. Plant Soil 259:287–295.
Riehm, H. 1958. Die Ammoniumlaktatessigsaure-Methode zur Bestimmung der Leichtloslichen Phosphosaure in karbonathal-tigen Boden. Agrochimica 3:49–65.
Sadka, A., E. Dahan, L. Cohen and K.B. Marsh. 2000. Aconitase activity and expression during the development of lemon fruit. Physiol. Plant. 108:255–262.
Sanz, M. and L. Montañés. 1995. Flower analysis as a new approach to diagnosing the nutritional status of the peach tree. J. Plant Nutr. 18:1667–1675.
Sanz, M., M. Carrera and L. Montañés. 1993. El estado nutricional del peral. Possibilidad del diagnóstico floral. Hortofruticultura 10: 60–62.
Sanz, M., L. Montañés and M. Carrera. 1994. The possibility of using flower analysis to diagnose the nutritional status of pear trees. Acta Hortic. 367:290–295.
Sanz, M., R. Belkhodja, M. Toselli, L. Montañés, A. Abadía, M. Tag-liavini, B. Marangoni and J. Abadía. 1997a. Floral analysis as a possible tool for prognosis of iron deficiency in peach. Acta Hortic. 448:241–245.
Sanz, M., J. Pascual and J. Machín. 1997b. Prognosis and correction of iron chlorosis in peach trees: influence on fruit quality. J. Plant Nutr. 20:1567–1572.
Sanz, M., J. Pérez, J. Pascual and J. Machín. 1998. Prognosis of iron chlorosis in apple trees by floral analysis. J. Plant Nutr. 21: 1697–1703.
Shear, C.B. 1980. Interactions of nutrition and environment on min-eral composition of fruits. In Minmin-eral Nutrition of Fruit Trees. Eds. D. Atkinson, J.E. Jackson and R.O. Sharples. Butterworths, Lon-don, pp 41–50.
Spiegel-Roy, P. and E.E. Goldschmidt. 1996. Biology of citrus. Cam-bridge University Press, CamCam-bridge, U.K., 230 p.
Statsoft. 1995. STATISTICA general conventions and statistics. Vol. I. Statsoft, Tulsa, OK, 887 p.
Tagliavini, M., J. Abadía, A.D. Rombolà, A. Abadía, C. Tsipouridis and B. Marangoni. 2000. Agronomic means for the control of iron chlorosis in deciduous fruit trees. J. Plant Nutr. 23:2007–2022. Toselli, M., B. Marangoni and M. Tagliavini. 2000. Iron content in
vegetative and reproductive organs of nectarine trees in calcare-ous soils during the development of chlorosis. Eur. J. Agron. 13: 279–286.
Vemmos, S.N. 1999. Mineral composition of leaves and flower buds in fruiting and non-fruiting pistachio trees. J. Plant Nutr. 22: 1291–1301.
Walkley, A. and I.A. Black. 1934. An examination of the Degtjareff method for determining soil organic matter and a proposed modifi-cation of the chromic acid titration method. Soil Sci. 37:29–38.