www.jped.com.br
ORIGINAL
ARTICLE
IL-6,
TNF-
␣
,
IL-10,
and
nutritional
status
in
pediatric
patients
with
biliary
atresia
夽
,
夽夽
Maria
Ines
de
Albuquerque
Wilasco
a,b,∗,
Carolina
Uribe-Cruz
a,c,
Daniele
Santetti
d,
Gabriel
Rodrigo
Fries
e,
Cristina
Toscani
Leal
Dornelles
f,
Themis
Reverbel
da
Silveira
a,b,caHospitaldeClínicasdePortoAlegre,CentrodePesquisa,LaboratórioExperimentaldeHepatologiaeGastroenterologia,Porto
Alegre,RS,Brazil
bUniversidadeFederaldoRioGrandedoSul(UFRGS),FaculdadedeMedicina,ProgramadePós-graduac¸ãoemSaúdedaCrianc¸ae
doAdolescente,PortoAlegre,RS,Brazil
cUniversidadeFederaldoRioGrandedoSul(UFRGS),FaculdadedeMedicina,ProgramadePós-graduac¸ãoemGastroenterologia,
PortoAlegre,RS,Brazil
dUniversidadedoValedoRiodosSinos(Unisinos),FaculdadedeNutric¸ão,SãoLeopoldo,RS,Brazil
eHospitaldeClínicasdePortoAlegre,CentrodePesquisa,LaboratóriodePsiquiatriaMolecular,PortoAlegre,RS,Brazil
fHospitaldeClínicasdePortoAlegre,DepartamentodePediatria,PortoAlegre,RS,Brazil
Received19August2016;accepted25November2016 Availableonline19March2017
KEYWORDS
IL-6; TNF-␣; IL-10;
Nutritionalstatus; Cirrhosis;
Biliaryatresia
Abstract
Objectives: TheobjectiveofthepresentstudyistoevaluatewhetherIL-6,TNF-␣,IL-10are
associated with nutritionalstatus inpatients withcirrhosis secondary tobiliaryatresia and comparetohealthycontrols.
Methods: Theparametersusedfornutritionalassessmentwerethestandarddeviationscoresof
height-for-ageandoftricepsskinfoldthickness-for-age.Theseverityofcirrhosiswasevaluated usingtheChild---PughscoreandPELD/MELD.SerumcytokinesweremeasuredusingCytometric BeadArrayflowcytometry.
Results: IL-6,TNF-␣,andIL-10weresignificantlyhigherinthecirrhosisgroupwhencompared
with thecontrolgroup(2.4vs. 0.24(p<0.001),0.21vs. 0.14(p=0.007),and0.65vs. 0.36 (p=0.004),respectively.IL-6andIL-10werepositivelycorrelatedwithdiseaseseverity(0.450 [p=0.001]and0.410;[p=0.002],respectively).TNF-␣didnotshowasignificantcorrelation
夽
Pleasecitethisarticleas:WilascoMI,Uribe-CruzC,SantettiD,FriesGR,DornellesCT,SilveiraTR.IL-6,TNF-␣,IL-10,andnutritional
statusinpediatricpatientswithbiliaryatresia.JPediatr(RioJ).2017;93:517---24.
夽夽
StudyconductedatUniversidadeFederaldoRioGrandedoSul,FaculdadedeMedicina,Programa dePós-graduac¸ãoemSaúdeda Crianc¸aedoAdolescente,PortoAlegre,RS,Brazil.
∗Correspondingauthor.
E-mail:[email protected](M.I.Wilasco).
http://dx.doi.org/10.1016/j.jped.2016.11.009
0021-7557/©2017SociedadeBrasileiradePediatria.PublishedbyElsevierEditoraLtda.ThisisanopenaccessarticleundertheCCBY-NC-ND
withdiseaseseverity(0.100;p=0.478).Regardingnutritionalevaluation,IL-6wasnegatively correlatedwiththestandarddeviationscoreofheight-for-age(−0.493;p<0.001)andoftriceps skinfoldthickness-for-age(−0.503;p<0.001),respectively.IL-10exhibitedanegative correla-tionwiththestandarddeviationscoreofheight-for-age(−0.476;p<0.001)andthestandard deviationscoreoftricepsskinfoldthickness-for-age(−0.388;p=0.004).TNF-␣didnotshow anysignificanceinbothanthropometricparameters(−0.083(p=0.555)and−0.161(p=0.253).
Conclusion: Theauthorssuggestthat,inpatientswithcirrhosis secondarytobiliaryatresia,
IL-6couldbeusedasapossiblesupportingbiomarkerofdeficientnutritionalstatusand ele-vatedIL-10levelscouldbeusedasapossibleearly-stagesupportingbiomarkerofdeteriorating nutritionalstatus.
©2017SociedadeBrasileiradePediatria.PublishedbyElsevierEditoraLtda.Thisisanopen accessarticleundertheCCBY-NC-NDlicense(http://creativecommons.org/licenses/by-nc-nd/ 4.0/).
PALAVRAS-CHAVE
IL-6; TNF-␣; IL-10;
Estadonutricional; Cirrose;
AtresiaBiliar
IL-6,TNF-␣,IL-10eestadonutricionalempacientespediátricoscomatresiabiliar
Resumo
Objetivos: Oobjetivodesteestudoéavaliarseháassociac¸ãoentreaIL-6,oTNF-␣eaIL-10
comoestadonutricionaldepacientescomcirroseporAtresiaBiliarecompararcomcontroles saudáveis.
Métodos: Osparâmetrosutilizadosnaavaliac¸ãonutricionalforamoescore-zdaestaturapara
aidadeedadobracutâneatricipitalparaidade.Agravidadedacirrosefoiavaliadapeloescore Chil-PughepelosmodelosPELD/MELD.Ascitocinasséricasforamquantificadasporcitometria defluxo.
Resultados: A IL-6, oTNF-␣eaIL-10 foramsignificativamentemais elevadosnogrupo
cir-rosequandocomparadoao grupo controle[2,4×0,24(p<0,001)], [0,21×0,14(p=0,007]e [0,65×0,36 (p=0,004)], respectivamente.A IL-6 e aIL-10demonstraram correlac¸ão direta comagravidadedadoenc¸a(0,450;p=0,001)e(0,410;p=0,002),respectivamente.O TNF-␣não apresentou significânciacomagravidadeda doenc¸a (0,100;p=0,478).Em relac¸ãoà avaliac¸ãonutricional,aIL-6mostroucorrelac¸ãoinversacomoescore-zdaestaturaparaidade (−0,493;p<0,001)ecomoescore-zdadobracutâneatricipital(−0,503;p<0,001), respec-tivamente.AIL-10mostroucorrelac¸ãoinversacomoescore-zdaestaturaparaidade(−0,476; p<0,001)ecomoescore-zdadobracutâneatricipital(−0,388;p=0,004),respectivamente. OTNF-␣nãomostrousignificânciaemambosparâmetrosantropométricos[(−0,083;p=0,555); (−0,161;p=0,253)].
Conclusão: Osautoressugeremque,empacientescomcirroseporAtresiaBiliar,aIL-6possa
serusadacomoumpossívelbiomarcadorcoadjuvantedoestadonutricionaldeficienteeque níveiselevadosdeIL-10possamserutilizadoscomoumbiomarcadorcoadjuvanteprecocena deteriorizac¸ãodoestadonutricional.
©2017SociedadeBrasileiradePediatria.PublicadoporElsevierEditoraLtda.Este ´eumartigo OpenAccesssobumalicenc¸aCCBY-NC-ND(http://creativecommons.org/licenses/by-nc-nd/4. 0/).
Introduction
Biliary atresia (BA) is an idiopathic cholangiopathy of childhood characterized by complete obstruction of the bile ducts. Progressive inflammation and fibrosis lead to secondary biliary cirrhosis in the majority of patients.1,2
Cirrhosis,whichistheendstageofmanyliverdiseases,is histopathologicallyidentifiedasadiffuseprocessofhepatic fibrosis and nodule formation.3 As cirrhosis advances, it
leads to an irregular supply of nutrients, oxygen, and metabolites.4,5 These changes affect energy synthesis
and metabolism, with an impact on the nutritional sta-tus of patients with liver disease.6 The pathogenesis of
malnutrition in liver disease is multifactorial, and the possible etiology is a combination of conditions such as
reducedcaloricintakeresultingfromanorexiaanddietary restrictions, intestinal malabsorption, abnormalities in the metabolism of macronutrients, and increased pro-inflammatorycytokines.6Infact,malnutritionisrecognized
as afactor associatedwith increasedmorbidity and mor-tality in the pre- and post-liver transplantation periods.7
Children and adolescents with chronic liver disease have increased energy needs, corresponding to 120% to 150% of their estimated energy requirement (EER).8 Cytokines
and growth factors are known to play an important role in cirrhosis. Interleukin-6 (IL-6) has been associated with worsening nutritional status in chronically ill patients.9
In patients with cirrhosis, a significant association of tumornecrosisfactor alpha(TNF-␣)anditsreceptorswith
activationoftheTNF-␣ systemcontributestothe
anorexia-cachexiasyndromeobservedinthesepatients.10Conversely,
interleukin-10(IL-10) isa cytokinewithanti-inflammatory properties;itsexpressioninBAiscontroversial.11
Nutritional assessment of patients with cirrhosis is hindered by the presence of organomegaly and edema and by the complexity of the interpretation of labora-tory parameters commonly used to evaluate nutrition, which are rendered abnormal by liver disease.8,12 The
nutritionalassessmentofchildrenwithcirrhosisis compli-cated by the presence of fluid retention, hepatomegaly, and splenomegaly, all of which can distort anthropomet-ric measurements.6 Considering the associations between
cytokines and nutritional status, they may be indirect biomarkerstosupportnutritionalassessment.
The objective of the present study was to evaluate whether IL-6, TNF-␣, andIL-10 areassociatedwith
nutri-tionalstatusinpatientswithcirrhosissecondarytoBA.
Methods
FromDecember2006 toDecember2011,53 childrenwith cirrhosis secondary toBA and 33 healthy, well-nourished, sex- and age-matched controls were recruited at Hospi-tal de Clínicas de Porto Alegre. Participants’ age ranged from 4 months to 17 years. All participants underwent a nutritional status assessment and completed a question-nairedesignedtocollectclinical,dietary,anddemographic data. This study was approved by the Research Ethics Committee of the Hospital de Clínicas de Porto Alegre. The study followed the principles set forth by Resolu-tion466/12 onhuman research,and wasapproved under CAEE No. 0317.0.001.000-10. Informed and written con-sent was obtained from the parents/guardians of all participants.
Cirrhosisgroup
The Kasai surgerywasperformed in all patients.From 53 patients,fourweretemporarilydrained(twoaged4months and two aged 5 months); nonetheless, all of them had thediagnosisofcirrhosisconfirmedbybiopsyperformedin surgery.Regardingthecirrhosisdiagnosis,39(73.6%) under-wentbiopsy.The remainingpatientscouldnotundergoan invasiveprocedure;therefore,theywerediagnosedby clin-icalevaluation,biochemicaltests,andultrasoundchanges consistentwithcirrhosis.
The exclusioncriteriawere presence of any other dis-ease(chronicoracute),acuteinfection,feveratthetime ofbloodcollection,antibiotictherapyupto15daysofblood collection, and steroid therapy. All participants received vitamins A, D, E, and K, minerals, antacids, and proton pump inhibitors if necessary as part of the standard of care.
The severity of cirrhosis was evaluated using the Child---Pugh score and the Pediatric End-stage Liver Dis-ease(PELD)andModelfor End-stageLiverDisease(MELD) scores. Patients were categorized as Child---Pugh class A (mild disease), B (moderate disease), or C (severe dis-ease).Intheinterestofuniformity,categoriesBandCwere pooled together. Subjectsaged 12 years or younger were
alsoassessedusingthePELDscores,whileolderparticipants wereevaluatedthroughMELDscores.Inbothcases,higher valuesareindicativeofmoreseveredisease.
Controlgroup
All participants allocated to the control group were healthy,well-nourishedchildrenandadolescentsscheduled toundergoblood collectionfor regular healthcarechecks orminorsurgicalprocedures.The exclusioncriteriawere: pretermbirth,presenceofanyotherconditions(chronicor acute),arestrictivediet,andmedicationuse(exceptiron andvitaminsatprophylacticdoses).
Assessmentofnutritionalstatus
In both groups, nutritional status was assessed through anthropometric measurements, obtained as described in the World Health Organization (WHO) Training Course on ChildGrowthAssessment. Nutritionalstatuswasclassified usingstandard deviation scores (SDS),in accordance with theWHOStandardsandReference.Theparametersusedfor nutritionalstatusclassificationwereheight-for-age (H/A), triceps skinfold thickness-for-age (TSF/A), and mid-upper arm circumference-for-age (MUAC/A). The body mass index-for-age(BMI/A)parameterwasusedtoclassify con-trolsaswell-nourished(datanotshown).SDS-BMI/Avalues outsidethe−2.0and+2.0rangeforchildrenyoungerthan 5yearsandoutsideofthe−2.0and+1.0rangeforchildren olderthan5yearswereusedtodefinewell-nourishmentin thecontrolgroup.Inthecirrhosisgroup,undernourishment was defined as SDS-H/A and/or SDS-TSF/A equal to or below −2.0. The same parameters used for individual nutritional status assessment in the cirrhosis group were used to compare the results of the assessment between groups. The WHO Anthro software, version 3.0,13 was
usedtocalculate anthropometricdata for children under 5 years, whereas the data of children over 5 years and adolescents were calculated using the WHO AnthroPlus14
and Frisancho Anthropometric Standards15 software
suites.
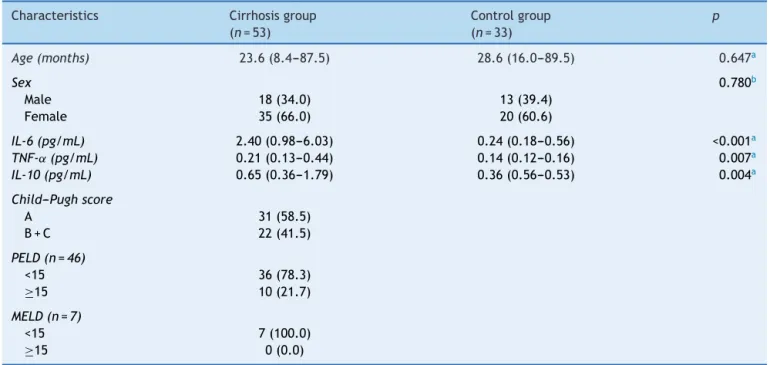
Table1 Generalcharacteristicsofthecirrhosisandcontrolgroups.
Characteristics Cirrhosisgroup (n=53)
Controlgroup (n=33)
p
Age(months) 23.6(8.4---87.5) 28.6(16.0---89.5) 0.647a
Sex 0.780b
Male 18(34.0) 13(39.4)
Female 35(66.0) 20(60.6)
IL-6(pg/mL) 2.40(0.98---6.03) 0.24(0.18---0.56) <0.001a
TNF-˛(pg/mL) 0.21(0.13---0.44) 0.14(0.12---0.16) 0.007a
IL-10(pg/mL) 0.65(0.36---1.79) 0.36(0.56---0.53) 0.004a
Child---Pughscore
A 31(58.5)
B+C 22(41.5)
PELD(n=46)
<15 36(78.3)
≥15 10(21.7)
MELD(n=7)
<15 7(100.0)
≥15 0(0.0)
PELD,PediatricEnd-stageLiverDiseasescore;MELD,ModelforEnd-stageLiverDiseasescore. Dataexpressedasn(%)ormedian(interquartilerange).
aMann---Whitney’sU-test. b Chi-squaredtest.
Cytokinequantitation
Bloodsampleswerecollectedwithatleastathree-hourfast. Serumwascentrifugedfor10minat1000g(4◦C)andstored at−80◦Cforlateranalysis.
QuantitationofIL-6,IL-10,andTNF-␣inserumwas ana-lyzedinduplicatebyCytometricBeadArrayflowcytometry, in accordance with the manufacturer’s protocol (BD Bio-sciences,USA).
The biomarkers evaluation was performed along with nutritionalassessmentandnotwiththeKasaisurgery. Nutri-tionalassessmentandbloodcollectionwereperformedwith anintervalofnolongerthanoneweek.
Statisticalanalysis
Variables were expressed as mean±SD or median. The Kolmogorov−Smirnov test wasused toassess the normal-ityofdatadistribution.Normallydistributedvariableswere comparedbyanalysisofvariance(ANOVA)andStudent’s t-test.Asymmetricallydistributedvariableswereanalyzedby the Kruskal−Wallis and Mann---Whitney U tests. Spearman coefficientswere usedto test for correlation. Analysisof covariance(ANCOVA) wasusedtocontrol for confounding factorsbetween cytokines and nutritionalparameters. To this end, nutritional parameters were stratified into ter-tiles and cytokine levels were log-transformed to enable useof a parametric test. The square rootof eta squared was used to estimate the size effect and interpreted on Pearson’sscale.Thesignificancelevelwassetat5%forall analyses.
Results
Generalcharacteristics
There were no significant differences between groups regarding age or sex. Most patients were classified as Child−PughAandhadPELD/MELDscoresbelow15(Table1). Regarding the clinical presentation of the disease, all patients (100%) had splenomegaly, seven (13.2%) had ascites,19(35.8%)hadvariceralbleed,31(58.5%)hadovert jaundice,and38(71.7%)hadthrombocytopenia.
Nutritionalstatusanddietaryassessment
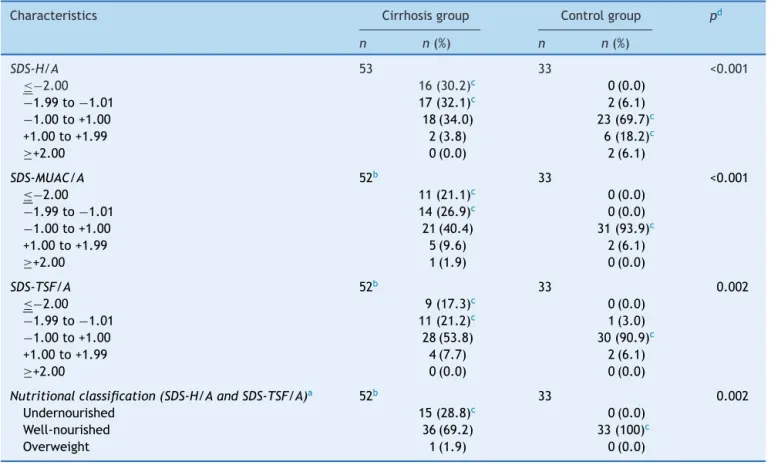
Thenutritionalparametersofinterestandtheresultsofthe nutritionalassessmentareshowninTable2.Forthe assess-mentofdietaryintakebyEER(%),participantsweredivided intofourageranges:0−2,2−5,5−10,and>10years.The median(interquartilerange)EER(%)foreachagegroupwas 122(97−162),106(85−128),88(77−105),and81(63−95), respectively.Thenutritionalassessmentindicatedthatmost patientsinthecirrhosisgroupwerewell-nourished(69.2%).
Correlationofseverityofcirrhosiswithcytokine levelsandnutritionalparameters
Table2 Nutritionalparametersandassessment.
Characteristics Cirrhosisgroup Controlgroup pd
n n(%) n n(%)
SDS-H/A 53 33 <0.001
≤−2.00 16(30.2)c 0(0.0)
−1.99to−1.01 17(32.1)c 2(6.1)
−1.00to+1.00 18(34.0) 23(69.7)c
+1.00to+1.99 2(3.8) 6(18.2)c
≥+2.00 0(0.0) 2(6.1)
SDS-MUAC/A 52b 33 <0.001
≤−2.00 11(21.1)c 0(0.0)
−1.99to−1.01 14(26.9)c 0(0.0)
−1.00to+1.00 21(40.4) 31(93.9)c
+1.00to+1.99 5(9.6) 2(6.1)
≥+2.00 1(1.9) 0(0.0)
SDS-TSF/A 52b 33 0.002
≤−2.00 9(17.3)c 0(0.0)
−1.99to−1.01 11(21.2)c 1(3.0)
−1.00to+1.00 28(53.8) 30(90.9)c
+1.00to+1.99 4(7.7) 2(6.1)
≥+2.00 0(0.0) 0(0.0)
Nutritionalclassification(SDS-H/AandSDS-TSF/A)a 52b 33 0.002
Undernourished 15(28.8)c 0(0.0)
Well-nourished 36(69.2) 33(100)c
Overweight 1(1.9) 0(0.0)
SDS-H/A,standarddeviationscoreofheight-for-age;SDS-MUAC/A,standarddeviationscoreofmid-upperarmcircumference-for-age; SDS-TSF/A,standarddeviationscoreoftricepsskinfoldthickness-for-age.
a Thelowestofthetwovalueswasusedfornutritionalclassification.
b Onepatienthadastandarddeviationscorebelow−0.01SDandwasexcludedfromthesample. c Associationsignificantat5%,accordingtoadjustedresidualstest.
d Chi-squaredtest(categoricalvariables)andStudent’st-test(continuousvariables).
accordingtotheSpearmancoefficientasweak(<0.3), mod-erate(0.3−0.59),strong(0.6−0.89),orverystrong(>0.9).
The Child−PughscoresandSpearmancoefficientswere also used to determine nutritional parameters and dis-ease severity were correlated. All nutritional parameters ofinterestweremoderatelycorrelatedwithdisease sever-ity. IL-6 and IL-10 demonstrated a positive correlation withdiseaseseverity(0.45 [p=0.001]and 0.41[p=0.002], respectively).TNF-␣wasnotsignificantlycorrelated(0.10; p=0.478).Regardinganthropometricparameters,SDS-H/A, SDS-MUAC/A,andSDS-TSF/Ashowedaninversecorrelation withdiseaseseverity,(−0.47[p<0.001],−0.45[p=0.001], and−0.43[p=0.002],respectively).
Correlationbetweencytokinesandnutritional parameters
Spearmancoefficientsindicatedamoderate,inverse, statis-ticallysignificantcorrelation ofthenutritionalparameters ofinterestwithIL-6andIL-10(Table3).
Tocontrolforpotentialconfounders,analysisof covari-ance (ANCOVA) was performed to detect whether these factorsremainedindependentlyassociatedwithcytokines. Ofthethreenutritionalparametersassessed,onlySDS-H/A remained associated with cytokines after adjustment for
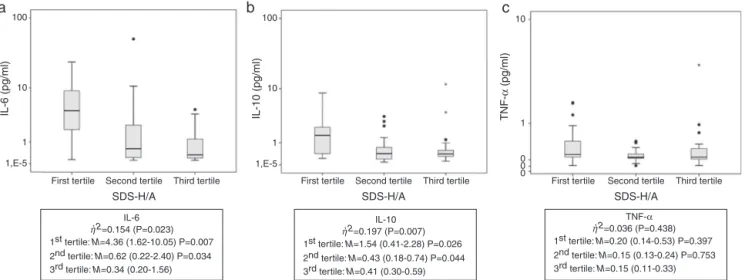
Child---Pughscore, age,andEER (%).Tobetter understand this association, SDS-H/A was stratified into tertiles. The resultsareshowninFig.1.Childrenclassifiedintothefirst andsecondtertilespresentedhigherlevelsofIL-6andIL-10 thanthoseclassifiedintothethirdtertile.
According to eta-squared values, SDS-H/A explained 15.4%and19.7%ofthevariabilityinIL-6andIL-10levels, respectively,whileTNF-␣ explainedonly3.6%(nostatistical
significance).
Discussion
In the present study, the authors correlated nutritional status withcytokines and disease severity. The literature indicatesthatdeterioratednutritionalstatusincreases dis-ease severity, which in turns worsens nutritional status.8
Regarding nutritional status, all anthropometric parame-terswere evaluatedand statisticallyanalyzed asZ-score, recommended by WHO.13,14 Concerning cirrhosis severity,
Table3 Correlationbetweencytokinesandnutritionalparameters(Spearman’scoefficient).
Characteristics IL-6 rs(p-value)
IL-10 rs(p-value)
TNF-␣
rs(p-value) SDS-H/A −0.493(<0.001) −0.476(<0.001) −0.083(0.555) SDS-MUAC/A −0.320(0.022) −0.363(0.008) −0.129(0.362) SDS-TSF/A −0.503(<0.001) −0.388(0.004) −0.161(0.253)
SDS-H/A,standarddeviationscoreofheight-for-age;SDS-MUAC/A,standarddeviationscoreofmid-upperarmcircumference-for-age; SDS-TSF/A,standarddeviationscoreoftricepsskinfoldthickness-for-age;rs,Spearmancoefficient.
100
10
1
1,E-5
First tertile
1st tertile: M=4.36 (1.62-10.05) P=0.007 η2=0.154 (P=0.023)
IL-6 ,
2nd tertile: M=0.62 (0.22-2.40) P=0.034 3rd tertile: M=0.34 (0.20-1.56)
1st tertile: M=1.54 (0.41-2.28) P=0.026 η2=0.197 (P=0.007)
IL-10 ,
2nd tertile: M=0.43 (0.18-0.74) P=0.044 3rd tertile: M=0.41 (0.30-0.59)
1st tertile: M=0.20 (0.14-0.53) P=0.397 η2=0.036 (P=0.438)
TNF-α
,
2nd tertile: M=0.15 (0.13-0.24) P=0.753 3rd tertile: M=0.15 (0.11-0.33) Second tertile Third tertile
SDS-H/A
100
a
b
c
10
1
0 0 0 10
1
1,E-5
First tertile Second tertile Third tertile SDS-H/A
First tertile Second tertile Third tertile SDS-H/A
TNF-α
(pg/ml)
IL-10 (pg/ml)
IL-6 (pg/ml)
Figure1 Cytokinevaluesstratifiedintotertilesofheightforage.(A)IL-6serumvalues;(B)IL-10serumvalues;(C)TNF-␣serum values.ChildrenclassifiedintothefirstandthesecondtertilespresentedhigherlevelsofIL-6andIL-10thanthoseclassifiedinto thethirdtertile,demonstratingtheimpairmentinnutritionalstatus(as representedbyheight-for-age).Thelineinsidethebox representsthemedian.Theupperandlowerlimitsoftheboxrepresentthe25thand75thpercentiles,respectively.Upperand lowererrorbarsrepresenttheminimumandmaximumvaluesofthesample.Theasterisksandcirclesrepresentoutliers.,2,eta squared;M,median(25thand75thpercentiles);SDS-H/A,standarddeviationscoreofheight-for-age.
wouldhavetobeusedtogether,reducingtheuniformity.To evaluatefoodconsumption,theEERwasused.Thisscoreis calculatedthroughequationsthatconsiderenergy expendi-ture,age,sex,weight,heightandlevelofphysicalactivity; theformulas aredifferentforeach stageof life.The EER wascalculatedindividually; after analyzing the three-day dietary recall, it was possible to assess whether patients wereingestingtheenergyvaluerecommendedforcirrhosis. TheAmericanSocietyforParenteralandEnteralNutrition (ASPEN)recentlypublishedadocumentredefiningpediatric malnutrition, suggesting the inclusion of proinflammatory cytokinesas adjuvantsin nutritional assessment.16 IL-6 is
acytokinethatreflectstheinflammatorystatusofpatients withchronicliverdisease,andmaybeapotentialmarkerof diseaseprogression.17 Inthepresentsample, higherlevels
ofIL-6werefoundinpatientsthaninthecontrolgroup(2.40 vs.0.24pg/mL,p<0.001),andamoderatecorrelationwas observedbetweenIL-6anddiseaseseverity(rs=0.45).Ina
recentpublication,theauthorshavealreadyshownan asso-ciationbetweenIL-6andnutritionalstatusinchildrenand adolescentswithchronicliverdisease.Pediatricpatientsat nutritionalrisk were comparedwith thosewell-nourished andtheIL-6valueswerehigherinthefirstgroup(7.12pg/mL vs. 1.63pg/mL; p=0.02).18 Although the samples in both
studies differ (the present study’s sample comprises only
patients with cirrhosis due to BA), the results are simi-lar,demonstratingarelationshipbetweennutritionalstatus andIL-6. El-Faramawyetal.1 assessedIL-6in asample of
youngerchildren(aged17.8±4.8months)andfoundvalues verysimilartothoseofthepresentstudy.Kobayashietal.19
assessed IL-6 in older children (age 12.5±3.4 years) and classifiedliver functionbyseverityand age.They demon-stratedthatthecytokinelevelswerehigherinpatientswith moresevere diseaseacross allageranges. Therefore,the presentresultsconfirmtheroleofIL-6asapossible suppor-tingbiomarkerofcirrhosisseverityinchildrenwithcirrhosis secondarytoBA.
TNF-␣ is considered a proinflammatory cytokine.20 In
adults patients withcancer, it has been shown toreduce appetiteandfoodintake.21Despitethefactthatthe
cirrho-sisgrouppresentedhighervaluesofTNF-␣ thanthecontrol
group(p=0.004),thepresentfindingsdidnotreveala cor-relationofthiscytokineanddiseaseseverity(p=0.478),nor withanyanthropometricparameter.Thesameresultswere demonstratedby Santettietal.18 Inan adult sample,
Shi-rakietal.10 foundhighervaluesincirrhoticpatientswhen
A(andPELD/MELDbelow15),withalowprevalenceof mal-nutrition(28.3%).
AccordingtoNelsonetal.,IL-10isananti-inflammatory cytokine with a protective effect against hepatic fibro-genesis, playing a major role in regulating the immune response.22Variationinlevelsmaybeassociatedwith
poly-morphismsinthegenethatencodesIL-10.23Narayanaswamy
etal.24measuredthiscytokineinpatientswithBAwhohad
undergoneportoenterostomyandfoundnosignificant differ-enceinlevelswhencomparedwiththoseofhealthycontrols (p=0.8);however,theselevelswerehigherthanthosefound in cholestatic controls (p=0.05). In the present sample, thelevelsofthiscytokinewerehigherincirrhoticpatients thaninthe controlgroup(0.65vs.0.36pg/mL, p=0.004), and showed a moderate correlation with disease severity (rs=0.41). Conversely, Jianetal.11 andWu etal.25
evalu-atedIL-10inpatientswhohadundergoneportoenterostomy and found nosignificant difference between patients and controls.
In this study,anthropometric assessment findings were correlatedwithdiseaseseverity(Table3).Thepresent find-ingsaresimilartothosereportedbyHurtado-Lópezetal., Saron et al., and Elkabbany et al., who comparedTSF/A withdiseaseseverityinchildrenwithchronicliverdisease andfoundthatthedegreeofdeteriorationinliverfunction wasclosely related tonutritional status.26---28 The present
datareflectthefactthatdiseaseseverityleads to deteri-orationofnutritionalstatus;this,inturn,worsenspatient clinicalcondition.Therefore,itisessentialthatnutritional interventionsshouldbeimplementedassoonasnutritional riskisidentifiedinpatientswithBA.
TheauthorsagreewithMehtaetal.,whosuggestedthat IL-6mayserveasamarkerofworseningnutritionalstatus in patientswith chronicdisease.9 Shiraki etal.suggested
that activation of TNF-␣ leads to abnormal metabolism,
whichcontributestothemalnutritionprocessinadultswith cirrhosis.10 The presentfindings demonstratedamoderate
correlationofheightwithIL-6andIL-10(Fig.1).After divid-ingSDS-H/AmeasurementsintotertilesandcomparingIL-6 andIL-10valuesineachtertile,significantdifferenceswere foundinthefirstandsecondtertileswhencomparedwith thethirdtertile,whichdemonstratesthat,thegreaterthe impairmentin nutritional status(as representedby H/A), thehigherthelevelsofIL-6andIL-10(Fig.1).Thus,children classified into the first and the second tertiles presented higherlevelsofIL-6andIL-10thanthoseclassifiedintothe third tertile, demonstrating theimpairment in nutritional status. Althoughthe present findings have shown correla-tionbetween cytokinesandseverity ofthe disease,some factorsmustbeconsideredaschangesinlivermetabolism. Monketal.,inarecentpublication,studiedbodyweight progressioninweanedmicethatwerefeddifferentdiets29;
theirfindingssuggestthathighIL-10levelsaredependenton thealteredmetabolismthatoccurswithnutritionaldeficits. Inpractice,thepresent resultsdemonstratedthatgreater stuntingofgrowthisassociatedwithhigherlevelsofIL-6and IL-10.Sinceheightisanindicatorofmalnutritioninthe pedi-atricpopulation,itispossibletoconcludethathigherIL-6 andIL-10concentrationsareassociatedwithworse malnu-trition.TheseresultsconfirmtheroleofIL-6asanindicator ofworseningnutritionalstatus,andsuggestthatIL-10level couldserveasanalertsystemofanattemptofthebodyto
overcometheinflammatoryprocessthatoccurswith dete-rioration of nutritionalstatus. Although there areseveral genepolymorphismsoftheseinterleukins,30furtherstudies
shouldevaluatetheseallelesinthispopulation.
The major strength of this study was the prospective analysisofa group ofpatients withahomogeneous etiol-ogyofliverdisease;itslimitationswerearelatively small samplesizelimitedtopatientswhowereattendedtoatthis hospital,andasmallnumberofpatientswithseveredisease. Therecommendationforfurtherresearchistoreplicatethis studyusing alargersample, includingmore patients with severedisease.
Inconclusion,IL-6couldbeusedasapossiblesupporting biomarkerof deficientnutritionalstatus, andelevated IL-10levelsmaybeusedasapossibleearly-stagesupporting biomarkerofdeterioratingnutritionalstatusinpatientswith cirrhosissecondarytoBA.
Funding
Coordenac¸ãodeAperfeic¸oamentodePessoaldeNível Supe-rior (CAPES), Fundo de Incentivo a Pesquisa (FIPE), and ProgramadePós-graduac¸ãoemSaúdedaCrianc¸aedo Ado-lescente(PPG-SCA).
Conflicts
of
interest
Theauthorsdeclarenoconflictsofinterest.
Acknowledgements
The authors would like to acknowledge the support and helpprovidedbytheExperimentalLaboratoryof Gastroen-terologyand Hepatology and theLaboratory of Molecular Psychiatry,HospitaldeClínicasdePortoAlegre.
References
1.El-Faramawy AA, El-Shazly LB,Abbass AA, Ismail HA. Serum IL-6 andIL-8 ininfants withbiliaryatresiaincomparison to intrahepaticcholestasis.TropGastroenterol.2011;32:50---5. 2.FeldmanAG,MackCL.Biliaryatresia:clinicallessonslearned.
JPediatrGastroenterolNutr.2015;61:167---75.
3.PintoRB,SchneiderAC,daSilveiraTR.Cirrhosisinchildrenand adolescents:anoverview.WorldJHepatol.2015;7:392---405. 4.MattarRH,AzevedoRA,SperidiãoPG,FagundesNetoU,Morais
MB. Estado nutricional e absorc¸ão intestinal de ferro em crianc¸ascom doenc¸a hepáticacrônica com esem colestase. JPediatr(RioJ).2005;81:317---24.
5.Bastos MD,da Silveira TR. Níveisplasmáticos de vitamina D em crianc¸aseadolescentescomcolestase.JPediatr(Rio J). 2003;79:245---52.
6.Leonis MA, Balistreri WF. Evaluation and management of end-stage liver disease in children. Gastroenterology. 2008;134:1741---51.
7.Sultan MI, LeonCD, Biank VF.Role of nutrition in pediatric chronicliverdisease.NutrClinPract.2011;26:401---8. 8.YoungS,KwartaE,AzzamR,SentongoT.Nutritionassessment
andsupportinchildrenwithend-stageliverdisease.NutrClin Pract.2013;28:317---29.
10.ShirakiM,TerakuraY,IwasaJ,ShimizuM,MiwaY,MurakamiN, etal.Elevatedserumtumornecrosisfactor-alphaandsoluble tumornecrosisfactorreceptorscorrelatewithaberrantenergy metabolisminlivercirrhosis.Nutrition.2010;26:269---75. 11.JianZH,WangLC,LinCC,WangJD.Thecorrelationbetween
plasmacytokine levels injaundice-free childrenwithbiliary atresia.WorldJPediatr.2015;11:352---7.
12.daSilvaFV,FerriPM,NascentesQueirozTC,deSouzaHaueisen BarbosaP,CassianodeOliveiraMC,deMeloPereiraLJ,etal. Nutritionalevaluationofchildrenwithchroniccholestatic dis-ease.JPediatr(RioJ).2016;92:197---205.
13.WorldHealthOrganization(WHO). MulticentreGrowth Refer-enceStudyGroup.WHOChildGrowthStandards: length/height-for-age, weight-for-age, weight-for-length,weight-for-height and body mass index-for-age: methods and development. Geneva:WHO;2006.
14.World Health Organization (WHO), Multicentre Growth Ref-erence Study Group. WHO Child Growth Standards: head circumference-for-age, arm circumference-for-age, triceps skinfold-for-ageandsubscapularskinfold-for-age:methodsand development.Geneva:WHO;2007.
15.FrisanchoAR.Anthropometricstandards:aninteractive nutri-tionalreferenceofbodycompositionforchildrenandadults. AnnArbor:TheUniversityofMichiganPress;2008.
16.Mehta NM, Corkins MR,Lyman B, Malone A, Goday PS, Car-neyLN,etal.Definingpediatricmalnutrition:aparadigmshift toward etiology-related definitions. J Parenter Enteral Nutr. 2013;37:460---81.
17.FieldingCA,JonesGW,McLoughlinRM,McLeodL,HammondVJ, UcedaJ,et al.Interleukin-6signalingdrivesfibrosisin unre-solvedinflammation.Immunity.2014;40:40---50.
18.SantettiD,deAlbuquerqueWilascoMI,DornellesCT,WerlangIC, FontellaFU,KielingCO,etal.Serumproinflammatorycytokines andnutritionalstatusinpediatricchronicliverdisease.World JGastroenterol.2015;21:8927---34.
19.KobayashiH,YamatakaA,LaneGJ,MiyanoT.Levelsof circulat-ingantiinflammatorycytokineinterleukin-1receptorantagonist and proinflammatorycytokines at differentstages ofbiliary atresia.JPediatrSurg.2002;37:1038---41.
20.ClarkIA.HowTNFwasrecognizedasakeymechanismof dis-ease.CytokineGrowthFactorRev.2007;18:335---43.
21.Argilés JM, Busquets S, Felipe A, López-Soriano FJ. Molec-ular mechanisms involved in muscle wasting in cancer and ageing:cachexia versussarcopenia.Int JBiochem CellBiol. 2005;37:1084---104.
22.NelsonDR,LauwersGY,LauJY,DavisGL.Interleukin10 treat-ment reduces fibrosis in patients with chronic hepatitis C: a pilot trial of interferon nonresponders. Gastroenterology. 2000;118:655---60.
23.Swi˛atek BJ. Is interleukin-10 gene polymorphism a predic-tive marker in HCV infection? Cytokine Growth Factor Rev. 2012;23:47---59.
24.NarayanaswamyB,Gonde C,TredgerJM,Hussain M,Vergani D,DavenportM.Serialcirculatingmarkersofinflammationin biliaryatresia---evolutionofthepost-operativeinflammatory process.Hepatology.2007;46:180---7.
25.WuJF,KaoPC,ChenHL,LaiHS,HsuHY,ChangMH,etal.Ahigh seruminterleukin-12p40levelpriortoKasaisurgerypredicta favourableoutcomeinchildrenwithbiliaryatresia.LiverInt. 2012;32:1557---63.
26.Hurtado-LópezEF,Larrosa-HaroA,Vásquez-GaribayEM, Macías-Rosales R, Troyo-Sanromán R, Bojórquez-Ramos MC. Liver function test results predict nutritional status evaluated by armanthropometricindicators. JPediatrGastroenterolNutr. 2007;45:451---7.
27.SaronML,GodoyHT, HesselG. Nutritionalstatusofpatients withbiliaryatresiaandautoimmunehepatitisrelatedtoserum levels of vitamins A, D and E. Arq Gastroenterol. 2009;46: 62---8.
28.ElkabbanyZA,HamzaRT,MahmoudNH.Assessmentofserum acylatedghrelininchildrenandadolescentswithchronicliver diseases: relation to nutritional status. Scientific World J. 2014;2014:560516.
29.MonkJM,SteevelsTA,HillyerLM,WoodwardB. Constitutive, butnotchallenge-induced,interleukin-10productionisrobust inacutepre-pubescentproteinandenergydeficits:newsupport forthetolerancehypothesisofmalnutrition-associatedimmune depressionbasedoncytokineproductioninvivo.IntJEnviron ResPublicHealth.2011;8:117---35.