12
TREE COVER DIAGNOSIS OF SÃO PAULO CITY
Rafaela Novaes de Abreu1, Bruna Lara de Arantes1, Gustavo Torquatro Oliva1, Jefferson Lordello
Polizel1; Demóstenes Ferreira da Silva Filho1
1Escola Superior de Agricultura “Luiz de Queiroz” – Universidade de São Paulo, Piracicaba, SP, Brasil. E-mail:
rafabreu@usp.br, blarantes@usp.br, gustavo.oliva@usp.br, jlpolize@usp.br, dfilho@usp.br ABSTRACT
Cities land use and landscape management are a big challenge for public sectors managers, who should search for low costs, efficient tools and scientific evidences that can improve these actions. This study aimed at comparing supervised classification of aerial images from 2002 and 2009, through MultiSpec W32, of tree cover diagnosis of São Paulo city. Land use indices and occupation were determined in selected sub regions of micro watersheds. It was possible to observe the metropolis growth dynamics and the urban forest adaptive changes. It was concluded that, in most regions, the exposed soil of 2002 was replaced by constructions in 2009, increasing the number of shadows on the region. The micro watershed with more trees, in both years, was the one of the Belini stream.
Keywords: GIS, MultiSpec, urban forest management, urban trees
DIAGNÓSTICO DA COBERTURA ARBÓREA DA CIDADE DE SÃO PAULO RESUMO
Foi realizado um diagnóstico da cobertura arbórea da cidade de São Paulo, através de classificação supervisionada das imagens aéreas de 2002 e 2009 pelo MultiSpec W32, com fins comparativos. As sub-regiões escolhidas foram microbacias hidrográficas, nas quais foram determinados índices de uso e ocupação do solo, que permitem acompanhar a dinâmica do crescimento da Metrópole Paulistana e como a floresta urbana tem se adaptado a essas mudanças. Na maioria das regiões observou-se que o solo exposto de 2002 foi ocupado por construções em 2009, aumentando o número de sombreamento na região. A microbacia mais arborizada em ambos os anos foi a do Córrego Belini.
13
INTRODUCTION
The increase in space consumption and the disordered growth of cities contribute to the green areas reduction and the degradation of life quality (LOMBARDO, 1990).
Urban forest is an important agent in the climate improvement because it increases humidity and reduces the temperature, avoiding heat islands and reducing pollution as it intercepts the particulate material and the stomata absorb the air pollutants, in addition to the aesthetics function (BONAMETTI, 2003).
Remote sensing and geoprocessing techniques are important to obtain information regarding the urban forest visualization and quantification, being an economical and efficient method that allows a general view of the studied regions (XIAO et al., 1999). In addition, it is possible to get information on the urban forest, such as free space and leaf area indices, used to model the benefits generated by it (NOWAK et al., 1996).
São Paulo city total area is 1,523 km², from which 760 km² correspond to green areas. However, this area is not divided into areas of gardens, tree plantations, parks, squares and conservation areas, but rather as total plant area (MOREIRA et al., 2007).
In this study, the city of São Paulo was divided according to the watersheds present in each region, which objective was to quantify and compare the urban forest in the years of 2002 and 2009.
MATERIALS AND METHODS
São Paulo is the biggest city in Brazil, with a population of 11.253.503 people. It is located in 23º32’0” S and 46º37’0” W, with an extension of 1,521 km² and average altitude of 860 meters (IBGE, 2013; CEPAGRI, 2013). The city has dry winter and hot summer, a Cwa climate type according to the Köppen-Geiger classification (KOTTEK et al., 2006).
It was studied the regions covered by the following watersheds: Aclimação; Anhangabaú; Belini; Branca; Cassandoca; Corujas; Curtume; Luz; Fortunato Ferraz; Glicério; Iguatemi; Morenguinho; Parque da Móoca; Sapateiro; Saracura; Tiburrinho; Uberaba; Verde I; Verde II; Dreno do Brooklin; Pacaembú; Traição; and Vinte e Três de Maio.
In order to carry out the study, images from Ikonos satellite of the year 2002 and images from Quickbird satellite of the year 2009 were used, both in the geotiff format, with squares of 5 km x 5 km and four bands: NIR (near infrared, that highlights the vegetation); Green; Blue and Red.
14
Following Silva Filho (2006) methodology, the satellite images were classified through the MultiSpec 3.2 free software. In the classification, five Training samples and five Test samples were prepared, totaling ten samples for each class. The watersheds regions image elements were classified according to the following classes: background; tree cover; lawn; exposed land; asphalt; shade; river/lake; pool; light roof; dark roof; gray roof; and ceramic roof.
Also, in the MultiSpec 3.2 software, the image classification statistical analysis was performed using the Kappa index, which indicates when some class presents pixels misclassified. This index ranges from 0.01 to 0.99, and the closer to 1.0 the more accurate the analysis.
It was accepted only thematic maps resulting in Kappa values equal or above 81%, which accuracy is considered almost perfect from Landis & Koch (1977) evaluation.
In order to analyze the accuracy of the supervised classification the Kappa index is widely used, since it includes all the elements of the error matrix (CONGALTON, 2001). The formula for obtaining the index was described in Landis & Koch (1997).
To evaluate the classification accuracy, omission and commission errors were analyzed, which equations were demonstrated in Ferreira et al. (2007). It was analyzed the result obtained from the subtraction between the omission and commission errors of the 100% that were tabulated.
And finally, to investigate whether major changes happened in urban space from 2002 (Ikonos satellite image) to 2009 (Quickbird satellite image), the percentages of thematic classes and scatter plots in Excel software were compared to analyze possible correlations between the years, through determination coefficient (R²), that demonstrates how much of the total variation is common to the set of analyzed elements (CONTI, 2009). It varies from 0 to 1, the closer to 1 the greater the correlation between the variables (BAESSO & SOUZA, 2010).
RESULTS AND DISCUSSION
Omission and commission errors analysis are detailed in Table 1. The results indicate that occur a minimum percentage of error, which validates tree cover and lawn classification.
15
Table 1. Omission and Commission percentage of tree cover and lawn supervised classification from
Ikonos and Quickbird satellite images (São Paulo, SP, 2013).
Watersheds
Classes
Tree cover (%) Lawn (%)
IKONOS (2002) QUICKBIRD (2009) IKONOS (2002) QUICKBIRD (2009) Omission / Commission Omission / Commission Omission / Commission Omission / Commission Aclimação 99.3 99.8 98.3 98.5 100 92.3 99.1 97.6 Anhangabaú 97.1 74.5 100 99.5 63.3 92.6 97.6 100 Belini 98.4 99.0 97.6 99.4 97.9 96.7 98.4 93.8 Branca 93.2 78.5 94.0 99.5 85.4 95.4 99.4 91.0 Cassandoca 98.1 97.6 98.1 96.8 93.4 90.9 91.6 95.2 Corujas 99.0 98.5 97.6 97.7 99.1 95.1 98.2 97.3 Curtume 85.5 97.4 100 100 98.2 89.6 100 100 Luz 98.1 99.2 98.9 100 97.7 93.9 99.7 85.9 Fortunato Ferraz 98.8 99.7 97.1 99.7 99.3 97.6 99.4 92.5 Glicério 98.9 95.9 80.7 99.7 98.9 98.6 99.6 48.8 Iguatemi 96.8 99.7 100 100 100 87.0 100 100 Morenguinho 99.4 97.7 100 98.2 97.9 98.9 97.4 100 Parque Mooca 90.5 79.1 100 100 56.7 75.5 100 100 Sapateiro 100 100 98.6 97.4 100 100 96.8 98.3 Saracura 100 100 99.2 99.2 100 100 98.9 98.3 Tiburrinho 100 100 98.3 98.1 100 100 97.1 94.8 Uberaba 93.5 100 96.5 100 99.1 88.1 100 98.5 Verde I 99.0 100 98.6 98.4 100 97.2 95.5 95.8 Verde II 97.9 98.3 99.0 99.7 87.9 96.6 99.4 92.1 Dreno Brooklin 100 92.4 96.5 96.8 99.2 100 99.5 99.0 Pacaembú 97.7 100 99.6 97.9 100 98.5 98.1 99.6 Traição 93.0 99.0 98.9 90.5 96.1 71.8 96.6 99.6 Vinte e três de maio 98.5 90.2 96.1 88.2 64.9 92.4 93.5 97.9
16
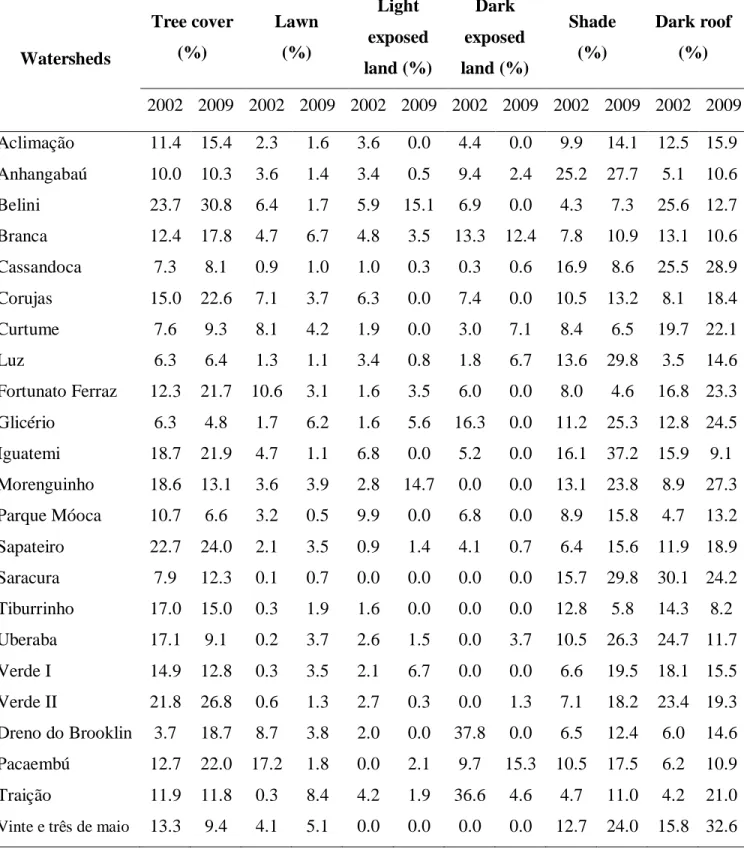
Table 2. Tree cover, lawn, light exposed land, dark exposed land, shade and dark roof percentages of the
watersheds from Ikonos (2002) and Quickbird (2009) satellite images (São Paulo, SP, 2013).
Watersheds Tree cover (%) Lawn (%) Light exposed land (%) Dark exposed land (%) Shade (%) Dark roof (%) 2002 2009 2002 2009 2002 2009 2002 2009 2002 2009 2002 2009 Aclimação 11.4 15.4 2.3 1.6 3.6 0.0 4.4 0.0 9.9 14.1 12.5 15.9 Anhangabaú 10.0 10.3 3.6 1.4 3.4 0.5 9.4 2.4 25.2 27.7 5.1 10.6 Belini 23.7 30.8 6.4 1.7 5.9 15.1 6.9 0.0 4.3 7.3 25.6 12.7 Branca 12.4 17.8 4.7 6.7 4.8 3.5 13.3 12.4 7.8 10.9 13.1 10.6 Cassandoca 7.3 8.1 0.9 1.0 1.0 0.3 0.3 0.6 16.9 8.6 25.5 28.9 Corujas 15.0 22.6 7.1 3.7 6.3 0.0 7.4 0.0 10.5 13.2 8.1 18.4 Curtume 7.6 9.3 8.1 4.2 1.9 0.0 3.0 7.1 8.4 6.5 19.7 22.1 Luz 6.3 6.4 1.3 1.1 3.4 0.8 1.8 6.7 13.6 29.8 3.5 14.6 Fortunato Ferraz 12.3 21.7 10.6 3.1 1.6 3.5 6.0 0.0 8.0 4.6 16.8 23.3 Glicério 6.3 4.8 1.7 6.2 1.6 5.6 16.3 0.0 11.2 25.3 12.8 24.5 Iguatemi 18.7 21.9 4.7 1.1 6.8 0.0 5.2 0.0 16.1 37.2 15.9 9.1 Morenguinho 18.6 13.1 3.6 3.9 2.8 14.7 0.0 0.0 13.1 23.8 8.9 27.3 Parque Móoca 10.7 6.6 3.2 0.5 9.9 0.0 6.8 0.0 8.9 15.8 4.7 13.2 Sapateiro 22.7 24.0 2.1 3.5 0.9 1.4 4.1 0.7 6.4 15.6 11.9 18.9 Saracura 7.9 12.3 0.1 0.7 0.0 0.0 0.0 0.0 15.7 29.8 30.1 24.2 Tiburrinho 17.0 15.0 0.3 1.9 1.6 0.0 0.0 0.0 12.8 5.8 14.3 8.2 Uberaba 17.1 9.1 0.2 3.7 2.6 1.5 0.0 3.7 10.5 26.3 24.7 11.7 Verde I 14.9 12.8 0.3 3.5 2.1 6.7 0.0 0.0 6.6 19.5 18.1 15.5 Verde II 21.8 26.8 0.6 1.3 2.7 0.3 0.0 1.3 7.1 18.2 23.4 19.3 Dreno do Brooklin 3.7 18.7 8.7 3.8 2.0 0.0 37.8 0.0 6.5 12.4 6.0 14.6 Pacaembú 12.7 22.0 17.2 1.8 0.0 2.1 9.7 15.3 10.5 17.5 6.2 10.9 Traição 11.9 11.8 0.3 8.4 4.2 1.9 36.6 4.6 4.7 11.0 4.2 21.0 Vinte e três de maio 13.3 9.4 4.1 5.1 0.0 0.0 0.0 0.0 12.7 24.0 15.8 32.6
17 With these analyses, it was possible to do scatter plots (Figure 1 and 2). Figure 1 shows a determination coefficient of 0.43, which means there are 43% correlation between the variables, considered low, and indicates a change in tree cover between 2002 and 2009 in São Paulo city despite showing a tendency to positive correlation.
Figure 1. Tree cover percent scatter plots in 2009 and 2002 (São Paulo, SP, 2013).
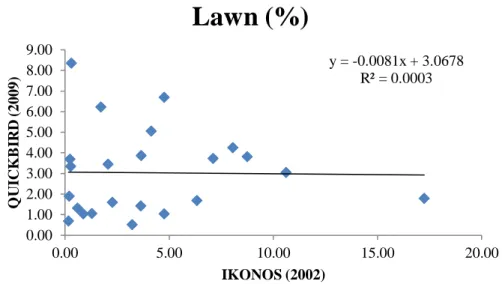
Analyzing the lawn percentage correlations between 2009 and 2002, the R² value of 0.0003 (Figure 2) reveals a low value association, demonstrating an even greater change in lawn areas after seven years, without tendency to correlation values. Comparing it to the tree cover R² value, it is possible to affirm that lawn areas are easier to be occupied and modified than areas with trees, which have their management protected by law.
y = 0.8568x + 3.9501 R² = 0.4349 0.00 5.00 10.00 15.00 20.00 25.00 30.00 35.00 0.00 5.00 10.00 15.00 20.00 25.00 Q U IC K B IR D (2009) IKONOS (2002)
Tree cover (%)
18
Figure 2. Lawn percent scatter plots in 2009 and 2002 (São Paulo, SP, 2013).
The watersheds description, classes percentage changes from 2002 to 2009 and its possible causes are shown below:
Aclimação
Tree cover increased 4%, the lawn area reduced 0.7% and exposed soil was totally reduced in 2009 (Table 2). It is suggested that exposed soil area gave way to the trees.
Belini
An increase of 7.1% in tree cover and 4.6% lawn reduction (Table 2) suggests tree occupation in lawn areas.
Branca
An upgrade of 5.4% in tree cover (Table 2) can be explained by trees growth after seven years and the presence of clouds blocking part of the image of Ikonos satellite (2002) that are absent in Quickbird satellite images (2009).
Corujas
Tree cover increased 7.6% while lawn reduced 3.37% (Table 2), the hypothesis are that trees have grown on law areas and the clouds presence in Ikonos satellite image (2002).
Fortunato Ferraz
There was an increase of 9.4% in tree cover, a decrease of 7.5% of lawn and 6% in dark exposed land (Table 2), probably due to trees extent on these areas.
y = -0.0081x + 3.0678 R² = 0.0003 0.00 1.00 2.00 3.00 4.00 5.00 6.00 7.00 8.00 9.00 0.00 5.00 10.00 15.00 20.00 Q U IC K B IR D (2009) IKONOS (2002)
Lawn (%)
19
Morenguinho
It was observed a decrease of 5.5% in tree cover that is probably related to the increase of 18.4% of dark roof and 10.6% of shade (Table 2) that occupied green areas. In cities vertical occupation it is normal that shadows increase, together with roofs due to the large buildings structures (SOUZA, 1994).
Saracura
It was observed an increase of 4.4% in tree cover and 0.5% in lawn area in contrast to the decrease of all others classes (Table 2).
Córrego Uberaba
A decrease of 7.9% in tree cover and 1.2% in light exposed soil in combination to an increase of 3.4% in lawn area and 16.1% in shade (Table 2) suggests an intensive land use change in this area.
Córrego Verde II
Tree cover and lawn had a growth of 5.0% and 0.7%, respectively, which may be related to a 2.4% light exposed soil decrease (Table 2).
Dreno do Brooklin
There was an increase of 15% in tree cover and a reduction of 4.9% in lawn area (Table 2) probably because of tree growth, pruning, planting seedlings and others. It is necessary to consider that occurred a slight confusion between these classes due to Ikonos satellite image resolution.
Pacaembú
Tree cover increased 9.2% while lawn area had a reduction of 15.4%, which may have been occupied by dark exposed soil, which increased 5.6% (Table 2). There was also a confusion between tree cover and lawn classes in the Ikonos satellite image.
Traição
Dark exposed soil had an intense reduction of 31.9%, because it has probably taken by lawn areas that grew 8% (Table 2).
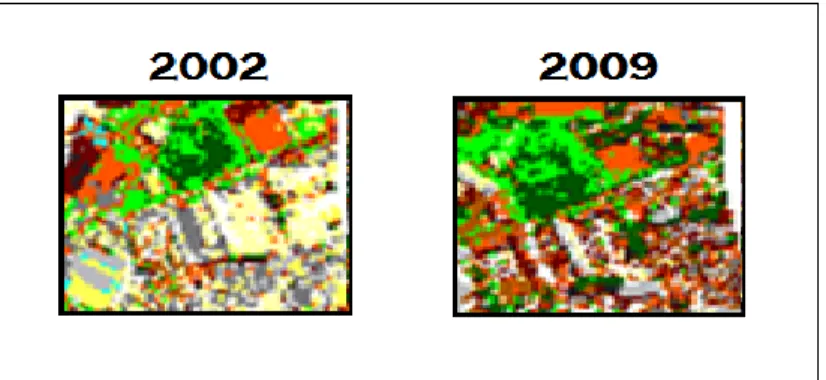
Analyzing the total area of São Paulo city, while 125% of exposed soil decreased from 2002 to 2009, roofs and shadows show a growth of 122.4% and 157.7% (Table 2), respectively, which means that exposed soil of 2002 may have been occupied by buildings in 2009, which we can see in Figures 3, 4 and 5.
20
Figure 3. Exposed soil area in 2002 occupied by roofs and a building in 2009 in the Branca watershed
(São Paulo, SP, 2013).
Figure 4. Exposed soil area in 2002 occupied by ceramic and metallic roofs in 2009 in the Tiburrinho
watershed (São Paulo, SP, 2013).
Figure 5. Exposed soil, trees and lawn areas in 2002 occupied by constructions in 2009 in the Parque da
Mooca watershed (São Paulo, SP, 2013).
The watershed with a higher tree cover is Belini, both in 2002 and in 2009, followed by Sapateiro and Verde II in 2002 and by Verde II and Sapateiro in 2009 (Table 3). On the other hand, those with lower tree cover were Dreno do Brooklin (2002) and Glicério (2009), according to Table 3.
21
Table 3. Watersheds ranking according to tree cover percentage in the Ikonos (2002) and Quickbird
(2009) satellite images (São Paulo, SP, 2013).
Ikonos satellite (2002) Quickbird satellite (2009)
Ranking Watersheds Tree cover (%) Ranking Watersheds Tree cover (%) 1º Belini 23.68 1º Belini 30.85 2º Sapateiro 22.77 2º Verde II 26.83 3º Verde II 21.79 3º Sapateiro 23.98 4º Iguatemi 18.73 4º Corujas 22.64 5º Morenguinho 18.65 5º Pacaembú 22.03 6º Uberaba 17.10 6º Iguatemi 21.95
7º Tiburrinho 17.05 7º Fort Ferraz 21.75
8º Corujas 15.02 8º Dreno do Brooklin 18.73
9º Verde I 14.92 9º Branca 17.84
10º Vinte e três de maio 13.28 10º Aclimação 15.44
11º Pacaembú 12.76 11º Tiburrinho 14.99
12º Branca 12.37 12º Morenguinho 13.10
13º Fort Ferraz 12.30 13º Verde I 12.76
14º Traição 11.99 14º Saracura 12.34
15º Aclimação 11.39 15º Traição 11.78
16º Parque da Móoca 10.68 16º Anhangabaú 10.31
17º Anhangabaú 10.05 17º Vinte e três de maio 9.42
18º Saracura 7.94 18º Curtume 9.31
19º Curtume 7.64 19º Uberaba 9.14
20º Cassandoca 7.31 20º Cassandoca 8.06
21º da Luz 6.33 21º Parque da Móoca 6.62
22º Glicério 6.30 22º da Luz 6.36
22
The Dreno do Brooklinwatershed, in seven years, presented a growth of 15.01% in tree cover, which is very expressive compared to other areas (Table 3). The tree cover percentages revealed a variation between 3.72% and 23.68% in 2002, and a variation between 4.88% and 30.85% in 2009 (Table 3).
São Paulo urbanization has intensely increased during that period andmost areas were occupied by asphalt, which entails significant microclimate change. Urban forest has increased in several regions but it is still far from representing a minimal ideal index. It is necessary that the management sector responsible to these watersheds rethink their administrative actions and how they focus on protecting and increasing their green areas over the years.
ACKNOWLEDGEMENTS
To all who participated and assisted in obtaining the materials for study, to the Urban Forestry Laboratory from Forest Science Department of ESALQ/USP, for the support and resources made available to the research full execution
REFERENCES
BAESSO, R. S.; SOUZA, A. A. 2010. O coeficiente de determinação é uma medida confiável do poder explicativo de modelos de estimação do valor intrínseco das ações negociadas na Bovespa? In: CONGRESSO USP CONTROLADORIA E CONTABILIDADE, 10., Belo Horizonte. Anais. Belo Horizonte: UFMG. p. 1-17.
BONAMETTI, J. H. 2003. Arborização urbana. Revista Terra e Cultura, Londrina, year XIX, n. 36, p. 51-55.
CENTRO DE PESQUISAS METEOROLOGICAS E CLIMÁTICAS APLICADAS A AGRICULTURA, CEPAGRI. 2013. Available in: <http://www.cpa.unicamp.br/outras-informacoes/clima_muni_565.html>. Access May 2013.
CONGALTON, R. G. 2001. Accuracy assessment and validation of remotely sensed and other spatial information. International Journal of Wildland Fire, Clayton South, v. 10, p. 321-328.
CONTI, F. 2009. Biometria, Regressão e Correlação. Universidade Federal do Pará. Available in: <http://www.ufpa.br/dicas/biome/biopdf/bioreg.pdf>. Access June 2013.
FERREIRA, E.; DANTAS, A. A. A.; MORAIS, A. R. 2007. Exatidão na classificação de fragmentos de matas em imagem do satélite Cbers-CCD, no município de Lavras, MG. In: SIMPÓSIO BRASILEIRO DE SENSORIAMENTO REMOTO, 8., Florianópolis. Anais. Florianópolis: INPE. p. 887-894.
INSTITUTO BRASILEIRO DE GEOGRAFIA E ESTATÍSTICA, IBGE. 2013. Available in: <http://www.ibge.gov.br/home/default.php>. Access May 2013.
KOTTEK, M.; GRIESER, J.; BECK, C.; RUDOLF, B.; RUBEL, F. 2006. World Map of the Köppen-Geiger climate classification updated. Meteorol. Z., Stuttgart, v. 15, p. 259-263.
23 LANDIS, J. R.; KOCH, G. G. 1977. The measurement of observer agreement for categorical data.
Biometrics, Washington, v. 33, n. 1, p. 159-174.
LOMBARDO, M. A. 1990. Vegetação e clima. In: ENCONTRO NACIONAL SOBRE ARBORIZAÇÃO URBANA, 3., Curitiba. Anais. Curitiba: Impresso na Fundação de Pesquisas Florestais do Paraná. p. 1-13.
MOREIRA, T. C. L.; SILVA FILHO, D. F.; POLIZEL, J. L. 2007. Extração de cobertura arbórea intra-urbana de imagens de alta resolução. In: SIMPÓSIO BRASILEIRO DE SENSORIAMENTO REMOTO, 13., Florianópolis. Anais. Curitiba: INPE, p. 5403-5409.
NOWAK, D. J.; ROWNTREE, R. A.; MCPHERSON, E. G.; SISINNI, S. M.; KERKMANN, E. R.; STEVENS, J. C. 1996. Measuring and analyzing urban tree cover. Landscape and Urban Planning, Amsterdam, v. 36, p. 49-57.
SILVA FILHO, D. F. 2006. Videografia aérea multiespectral em silvicultura urbana. Ambiência, Guarapuava, v. 2, p. 55-68.
SOUZA, M. A. A. 1994. A identidade da metrópole: a verticalização em São Paulo. Coleção Estudos
urbanos. Editora Hucitec, v. 8, 257 p.
XIAO, Q.; USTIN, S.; MCPHERSON, E. G.; PEPER, P. 1999. Characterization of the structure and species composition of urban trees using high resolution AVIRIS data. In: SUMMARIES OF THE EIGHT JPL AIRBORNE EARTH SCIENCE WORKSHOP, 8., Pasadena. Proceedings... Pasadena: California Institute of Technology, Jet Propulsion Laboratory, p. 451-460.
Received in September 27, 2016 Accepted in November 06, 2017