Vol.46, n. 4 : pp. 587-593, December 2003
ISSN 1516-8913 Printed in Brazil
BRAZILIAN ARCHIVES OF
BIOLOGY AND TECHNOLOGY
A N I N T E R N A T I O N A L J O U R N A L
Profile of the Alcohols Produced in Fermentations with Malt
Contaminated with Trichothecenes
Christian Oliveira Reinehr and Eliana Badiale Furlong
*Laboratório de Micotoxinas; Departamento de Química; Fundação Universidade Federal do Rio Grande; [email protected]; C. P. 474; 96201-900; Rio Grande - RS - Brazil
ABSTRACT
In order to study the influence of mycotoxins on the production of alcohols, a fermentative process on a laboratorial scale was simulated. Malt was contaminated with deoxynivalenol and T-2 in different ratios (up to 500 ppb), according to a 32 factorial design, and the alcohols obtained after the fermentation were determined through gas chromatography. The results showed that trichothecenes influenced the profile of the alcohols produced by
Saccharomyces cerevisiae during the fermentative process of malt, especially the profile of methyl and isoamyl alcohols.
Key words: Deoxynivalenol, fermentation, malt, T-2 toxin, trichothecenes
* Author for correspondence
INTRODUCTION
The presence of mycotoxins in food for human consumption could be due to fungal contamination (raw materials, semimanufactured and final products), or by the contamination of animal products, through contaminated feed consumed by the animal (Ueno, 1983). The fungi which usually contaminate vegetables and grains in the field are
Fusarium, Trichoderma, Myrothecium, Stachybotrys, Cylindrocarpon and Trichothecium. Most of the described trichothecenes belong to the Fusarium
species, which attack cereals in zones of temperate climate (Langseth and Rundberget, 1998).
Trichothecenes are a family of sesquiterpenoids with ester and alcohol functions, which present a double bond between carbons 9 and 10, and an epoxide ring at positions 12 and 13 of the structure, which is shown in Figure 1. The epoxide ring and the double bond in position 9 are the basic elements for toxicity; however, other
substitutes and their positions and sizes also influence the degree of toxicity.
Trichothecenes can be found in several products. Studies have shown the presence of deoxynivalenol (DON) and T-2 toxin in barley and other cereals (Scott, 1990, Furlong et al., 1995, Langseth et al., 1999). Barley is used in the production of beer, which also in some cases appears to be contaminated by deoxynivalenol and nivalenol (Shim et al., 1987), and by deoxynivalenol and zearalenone (Scott et al., 1992, 1993).
Figure 1 - Structure of the trichothecenes. Substitutes such as H, OH, acils, epoxides, esters can appear at positions 3, 4, 7, 8, 14 and 15 of the structure (Langseth and Rundberget, 1998).
In view of the fact that malt used for the industrial production of beer is often contaminated, a fermentative process was simulated with the purpose of verifying whether the presence of the mycotoxins deoxynivalenol (in virtue of its high incidence in this type of raw material) and T-2 (in virtue of its high toxicity) influence the profile of alcohols produced during alcoholic fermentation.
MATERIALS AND METHODS
Reagents and samples
All the reagents used were of analytical grade, from Merck Chemical Co. and Aldrich Chemical Co. (alcohols standards), and Sigma Chemical Co. (toxin standards). Non-contaminated malt collected at a local brewery was used. The yeast used for the fermentative process was
Saccharomyces cerevisiae, obtained in dried form.
Contamination and fermentation
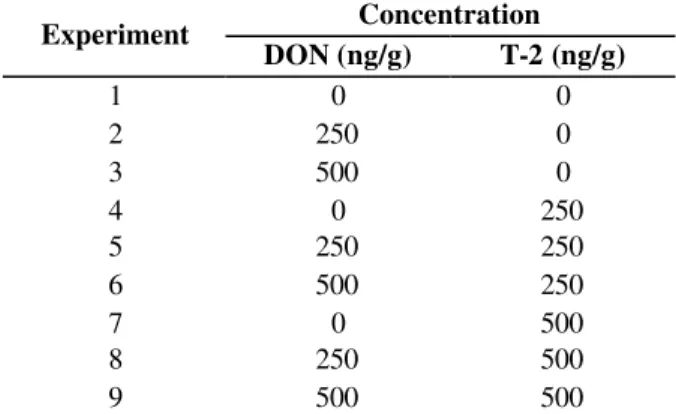
Non-contaminated malt was milled. To each fermentor, 20 g of milled malt were added. Contamination was carried out by adding the toxins in different amounts to each fermentor. A full factorial design was planned, and the degrees of contamination were as shown in Table 1. The degrees of contamination were expressed in ppb (ngtoxin/gmalt). The degrees chosen are under 1000
ng/g, which is usually accepted as limit in animal feed by several countries. Two experiments were done for each combination.
A culture of Saccharomyces cerevisiae was grown overnight (ca. 18 hours) in a medium with agar (1.75%), dextrose (2%), peptone (1%) and yeast
extract (1%) at 30°C. To each fermentor with malt, 250 ml of water were added. A 10-ml aliquot of the Saccharomyces culture was placed in each fermentor. The fermentors were closed to generate anaerobic conditions and were then placed in a shaker with temperature and agitation controllers at 30°C and 70 rpm. The samples were collected after 24 h of fermentation.
Determination of the produced alcohols
The determination of the alcohols was done in a Varian gas chromatograph – model 3400 CX – equipped with a flame ionization detector (FID) and a capillar column, model DB-FFAP Megabore (stationary phase: nitroterephtalic acid modified by polyethylene glycol). The column was of the following dimensions: 30 m long, 0.545 mm in diameter and with a 1 mm film thickness. The carrier gas was nitrogen (N2), at a speed of 2
ml/min. The temperatures of the injector and the detector were both 150ºC. The initial temperature of the column was 50ºC, which lasted for 2 minutes. The temperature increased 10ºC/min, to 120ºC, where it remained for a further 2 minutes – a total of 11 minutes. The amount of sample injected was 1 µl. The alcohols produced were identified by comparing the retention times to standards, and were quantified through external standardization. The compounds verified in the chromatograms were determined by the software Varian Star version 4.51, through the peaks areas.
Table 1 - Matrix of the 32 factorial design
Concentration Experiment
DON (ng/g) T-2 (ng/g)
1 0 0
2 250 0
3 500 0
4 0 250
5 250 250
6 500 250
7 0 500
8 250 500
9 500 500
Statistical analysis
RESULTS AND DISCUSSION
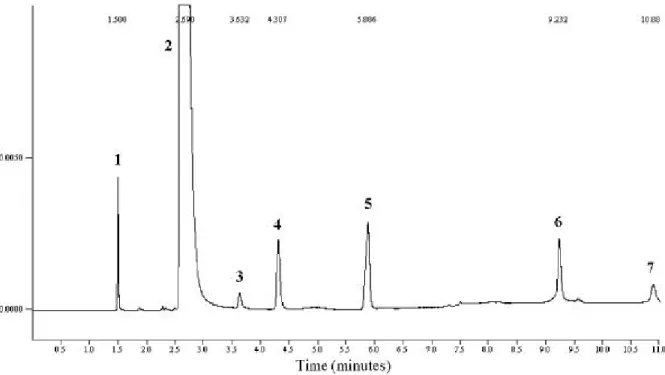
Analysing the chromatograms of the experiments 7 distinct peaks were detected, 6 of which were identified in accordance with their retention times. Fig. 2 shows a chromatogram of one of the experiments after the fermentation.
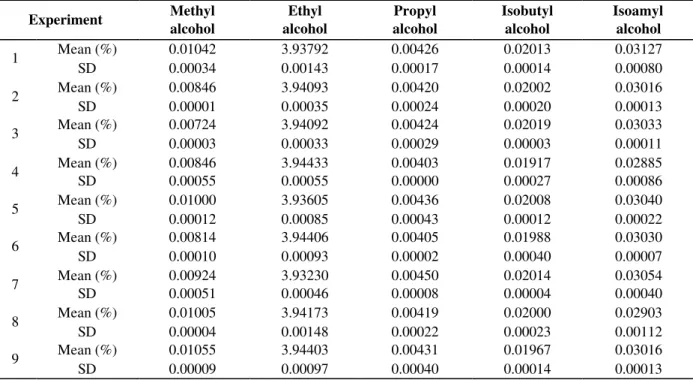
Table 2 presents the means and standard deviations in the experiments for each alcohol produced. The standard deviations were all below 10%, indicating that the replicates were very close to each other. After the fermentation, it was observed that the final average of ethanol formed was 3.94%, close to the concentration obtained in the usual brewing process (around 4%).
The resume of the Analysis of Variance is presented in Table 3. As can be seen, neither deoxynivalenol nor the T-2 toxin showed any significant effect on the concentration of propyl alcohol. However, all the other alcohols were shown to be dependent upon the presence of the toxins studied. For the other four alcohols, the interaction effect was significant (95% confidence interval), so it was of no advantage to analyse the
effects separately. Consequently only the interaction effect was studied.
The production of ethanol was influenced by the presence of the mycotoxins (Fig. 3). When the T-2 toxin was present at a concentration of 500 ng/g, the production of ethanol increased with increasing concentrations of DON.
When the concentration of T-2 was 250 ng/g, the maximal ethanol production appeared with a higher concentration of DON or without it. Furthermore, when the T-2 toxin was absent, the concentration of ethanol was not influenced by DON. Although the concentration of ethanol presented little variation (between 3.932 and 3.944%), the differences were statisticaly confirmed at 95% confidence interval. In industrial processes the amount of alcohol produced normally is very high, making these differences important.
Schapira et al. (1989) studied the influence of diverse mycotoxins on the malting process. They concluded that deoxynivalenol did not affect this process. Böswald et al. (1995) and Madhyastha et al. (1994) showed that the presence of deoxynivalenol did not inhibit the growth of
Saccharomyces cerevisiae.
Table 2 - Means and standard deviations (SD) in the experiments, as determined by gas chromatography. The means are the average of two experiments.
Experiment Methyl
alcohol
Ethyl alcohol
Propyl alcohol
Isobutyl alcohol
Isoamyl alcohol
Mean (%) 0.01042 3.93792 0.00426 0.02013 0.03127
1
SD 0.00034 0.00143 0.00017 0.00014 0.00080
Mean (%) 0.00846 3.94093 0.00420 0.02002 0.03016
2
SD 0.00001 0.00035 0.00024 0.00020 0.00013
Mean (%) 0.00724 3.94092 0.00424 0.02019 0.03033
3
SD 0.00003 0.00033 0.00029 0.00003 0.00011
Mean (%) 0.00846 3.94433 0.00403 0.01917 0.02885
4
SD 0.00055 0.00055 0.00000 0.00027 0.00086
Mean (%) 0.01000 3.93605 0.00436 0.02008 0.03040
5
SD 0.00012 0.00085 0.00043 0.00012 0.00022
Mean (%) 0.00814 3.94406 0.00405 0.01988 0.03030
6
SD 0.00010 0.00093 0.00002 0.00040 0.00007
Mean (%) 0.00924 3.93230 0.00450 0.02014 0.03054
7
SD 0.00051 0.00046 0.00008 0.00004 0.00040
Mean (%) 0.01005 3.94173 0.00419 0.02000 0.02903
8
SD 0.00004 0.00148 0.00022 0.00023 0.00112
Mean (%) 0.01055 3.94403 0.00431 0.01967 0.03016
9
SD 0.00009 0.00097 0.00040 0.00014 0.00013
Table 3 - Results of the Analysis of Variance (* Significant different at 95% confidence interval)
p-value
Effect Methyl
alcohol
Ethyl Alcohol
Propyl alcohol
Isobutyl alcohol
Isoamyl alcohol
DON 0.0008 * < 0.0001 * 0.9055 0.1894 0.4654
T-2 < 0.0001 * 0.0095 * 0.4749 0.0160 * 0.0930
Interaction < 0.0001 * < 0.0001 * 0.5095 0.0074 * 0.0217 *
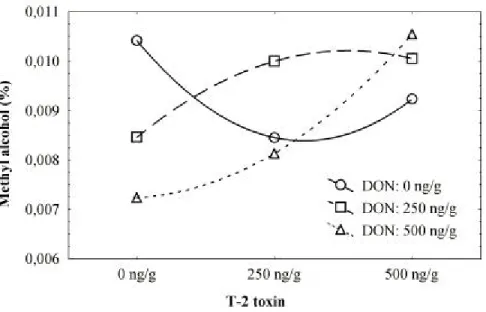
Figure 4 - Plot of means for the two-way interaction between degrees of contamination with deoxynivalenol and with T-2 toxin, showing concentration of methyl alcohol produced.
Whitehead and Flannigan (1989) showed that the DON did not affect the production of ethanol. Ethanol is produced during the exponential growth phase and the maximal ethanol concentration occurs as the culture enters the stationary phase. Ethanol production follows this pattern regardless or whether the T-2 toxin is in the medium. In mithocondria isolated from Saccharomyces cerevisiae, T-2 toxin inhibited site II of the electron transport chain and succinate dehydrogenase activity, but not NADH dehydrogenase activity (Koshinsky et al., 1992). However, in relation to the existing glucose there was a higher concentration of ethanol as the toxin T-2 inhibited the oxidative but not the fermentative metabolism. Thus, the inhibition of the mitochondrial function and an increase in the catabolism of the glucose led to a consequent higher formation of ethanol (relative to glucose). According to these statements, the production of ethanol should not be influenced by the T-2 toxin. This was not observed, because the influence of this toxin was dependent upon the presence of the other toxin. Moreover, in the study developed by Koshinsky et al. (1992), the concentration of the toxin was much higher (between 20 and 200 µg/g) than that used in this study (maximal 500 ng/g). With regard to methanol, at the end of the fermentation there was a high variation in its concentration in the experiments (between 0.011
and 0.007%). It was observed that there was a higher production of methanol when both toxins were absent. When T-2 was present at 500 ng/g, the production of methyl alcohol increased with increasing concentrations of DON. In the absence of T-2 and when the concentration of DON increased, it was found that the production of methanol decreased (Fig. 4).
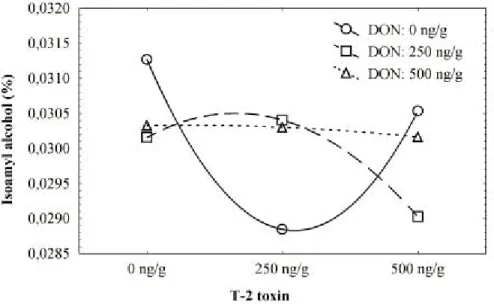
production of amyl alcohol was constant, with or without T-2 toxin (Fig. 5).
The main metabolic pathway for the production of higher alcohols is related to deamination, decarboxylation and reduction of the aminoacids which are in the medium. Several enzymes play a role in these reactions, making further studies necessary to determine which enzymes are really affected by the trichothecenes. The results presented here were partially expected because fermentative metabolism was believed not to be affected by these mycotoxins. Although propyl alcohol production was not affected, different
alcohols such as ethanol, methanol and other higher alcohols were differently produced with the presence of T-2 toxin and DON.
Based on these results, it was concluded that unpredictable productions of methanol and higher alcohols could be obtained depending on the presence of fungal contamination in cereals. When barley is contaminated with trichothecenes (even in low concentrations, such as 500 ppb), quality control must be present during brewing process, not only relative to post contamination, but also due to unexpected concentrations of alcohols.
Figure 5 - Plot of means for the two-way interaction between degrees of contamination with deoxynivalenol and with T-2 toxin, showing concentration of isoamyl alcohol produced.
ACKNOWLEDGEMENTS
The financial support received from CAPES (Fundação Coordenação de Aperfeiçoamento de Pessoal de Nível Superior) is gratefully acknowledged.
RESUMO
Os tricotecenos são metabólitos produzidos por diversos fungos, principalmente os do gênero
Fusarium. As condições climáticas de diversos países, como o Brasil, favorecem o crescimento desses fungos e a produção dos tricotecenos, os quais podem estar presentes em vários cereais,
REFERENCES
Böswald, C.; Engelhardt, G.; Vogel, H. and Wallnöfer, P. R. (1995), Metabolism of the Fusarium
mycotoxins zearalenone and deoxynivalenol by yeast strains of technological relevance. Natural Toxins, 3, 138-144.
Furlong, E. B.; Valente-Soares, L. M.; Lasca, C. C. and Kohara, E. Y. (1995), Mycotoxins and fungi in wheat stored in elevators in the state of Rio Grande do Sul, Brazil. Food Additives and Contaminants,
12 : (5), 683-688.
Koshinsky, H. A.; Cosby, R. H. and Khachatourians, G. G. (1992), Effects of T-2 toxin on ethanol production by Saccharomyces cerevisiae. Biotechnology and Applied Biochemistry, 16 : (3), 275-286.
Langseth, W.; Bernhoft, A.; Rundberget, T.; Kosiak, B. and Gareis, M. (1999), Mycotoxin production and cytotoxicity of Fusarium strains isolated from Norwegian cereals. Mycopathologia,144, 103-113. Langseth, W. and Rundberget, T. (1998), Instrumental
methods for determination of nonmacrocyclic trichothecenes in cereals, foodstuffs and cultures.
Journal of Chromatography A, 815, 103-121.
Madhyastha, M. S.; Marquardt, R. R.; Masi, A.; Borsa, J. and Frohlich, A. A. (1994), Comparison of toxicity of different mycotoxins to several species of bacteria and yeasts: use of Bacillus brevis in a disc diffusion assay. Journal of Food Protection, 57 : (1), 48-53. Schapira, S. F. D.; Whitehead, M. P. and Flannigan, B.
(1989), Effects of the mycotoxins diacetoxyscirpenol and deoxynivalenol on malting characteristics of barley.
Journal of the Institute of Brewing,95, 415-417. Scott, P. M. (1990), Trichothecenes in grains. Cereal
Foods World, 35, 661-666.
Scott, P. M. (1996), Mycotoxins transmitted into beer from contaminated grains during brewing. Journal of AOAC International, 79 : (4), 875-882.
Scott, P. M.; Kanhere, S. R.; Daley, E. F. and Farber, J. M. (1992), Fermentation of wort containing deoxynivalenol and zearalenone. Mycotoxin Research, 8, 58-66.
Scott, P. M.; Kanhere, S. R. and Weber, D. (1993), Analysis of Canadian and imported beers for
Fusarium mycotoxins by gas chromatography/mass spectrometry. Food Additives and Contaminants,
10 :(4), 381-389.
Shim, W. B.; Kim, J. C.; Seo, J. A. and Lee, Y. W. (1997), Natural occurance of trichothecenes and zearalenone in Korean and imported beers. Food Additives and Contaminants, 14 : (1), 1-5.
Ueno, Y. (1983), Trichothecenes: chemical, biological and toxicological aspects. New York: Elsevier. Whitehead, M. P. and Flannigan, B. (1989), The
Fusarium mycotoxin deoxynivalenol and yeast growth and fermentation. Journal of the Institute of Brewing, 95, 411-413.