E f f i c i e n c y a n a l y s i s o f s c i e n t i f i c
l a b o r a t o r i e s
M AR C E L A D O C AR MO S I L V AI J O ÃO C AR L O S C . B . S O AR E S D E ME L L OII C AR L O S F R AN C I S C O SI M Õ E S G O ME SIII I S AB E L L A C O U T O C AR L O SIV http://dx.doi.org/10.22347/2175-2753v12i36.2471 AbstractUniversity laboratories involved with the teaching of science develop several intellectual property assets, offering to universities opportunities for investing in the scientific environment. Such feedback loop might be improved if investments in laboratories with high efficiency rates were analyzed and investigated. The purpose of this paper is to analyze how efficiency is taken into account in biomedicine, medicine and exact sciences laboratories to receive financial investments, through Data Envelopment Analysis (DEA); at the same time, it was possible to observe the low efficiency of some scientific laboratories, which indicates a need for improvement in the scientific environment to subsidize scientific research by using its own revenues.
Keywords: Data Envelopment Analysis. Scientific laboratories. Efficiency.
Innovation.
Sub meti do em: 16 /08/2019 Ap r o v ado em: 04/05/2020
I Universidade Federal Fluminense (UFF), Niterói (RJ), Brasil;
http://orcid.org/0000-0002-6098-6380; e-mail: [email protected].
II Universidade Federal Fluminense (UFF), Niterói (RJ), Brasil;
http://orcid.org/0000-0002-6507-2721; e-mail: [email protected].
III Universidade Federal Fluminense (UFF), Niterói (RJ), Brasil;
http://orcid.org/0000-0002-6865-0275; e-mail: [email protected].
IV Universidade Federal Fluminense (UFF), Niterói (RJ), Brasil;
A n á l i se d e e f i c i ê n c i a d o s l a b o r a t ó r i o s c i e n t í f i c o s d e
u m a u n ive r si d a d e
Resumo
Laboratórios de universidades de ensino científico desenvolvem vários ativos de propriedade intelectual, oferecendo às instituições universitárias royalties pelo investimento em ambiente científico. Esse ciclo de feedback pode ser melhorado se os investimentos em laboratórios com índices eficientes forem analisados e investigados, como uma constante nessas instituições universitárias. O objetivo deste artigo é analisar via Análise Envoltória de Dados como a eficiência dos laboratórios científicos de biomedicina, medicina e ciências exatas torna-se apta para receber investimentos; ao mesmo tempo, analisando seus royalties, é possível observar outros laboratórios científicos que não são tão eficientes, destarte, melhorando todo o ambiente científico para subsidiar pesquisas por receitas próprias, considerando um cenário de escassez de investimentos em pesquisas científicas nesta instituição universitária.
Palavras-chave: Análise Envoltória de Dados. Laboratórios científicos de universidades.
Eficiência. Inovação. Royalties.
A n á l i s i s d e e f i c i e n c i a d e l o s l a b o r a t o r i o s c i e n t í f i c o s d e
u n ive r si d a d e s
Resumen
Los laboratorios científicos de las universidades desarrollan varios activos de propiedad intelectual, ofreciendo a las universidades oportunidades para invertir en un entorno científico. Este ciclo de retroalimentación podría mejorarse si las inversiones en laboratorios con altas tasas de eficiencia fueran analizadas e investigadas. El objetivo de este trabajo es analizar cómo es establecida la eficiencia en los laboratorios científicos de biomedicina, medicina y ciencias exactas para recibir inversiones, por medio del Data Envelopment Analysis (DEA); al mismo tiempo, es posible observar la baja eficiencia de algunos laboratorios científicos, lo que indica una necesidad por mejorar el ambiente científico para subsidiar la investigación científica usando sus propios ingresos.
Palabras clave: Data Envelopment Analysis. Laboratorios de universidades
Introduction
Brazilian Higher Education Institutions (IES, by its acronym in Portuguese) need scientific basis for obtaining revenues, turning laboratories into benchmarking centers, developing innovative technologies (as products or services in any economic sector), and generating profits to support the university itself and/or other research institutions, without the intensive use of government grants, considering that the budget for educational policies and improvements are low in Brazil (SILVA; GOMES; COSTA JUNIOR, 2018).
Scientific laboratories are the centers for developing technology and innovation, especially when they belong to universities, which ensures that the outcomes of the research will be available for the society. Open innovation and social technologies are possibilities for improving life in society while creating ruptures and adapting new technologies stemming from researches.
The innovation process needs different sources: companies, universities, laboratories, research and development institutes, among others. Technological innovation in companies is a key factor in the maintenance of their activities and for the growth and development of the country (PEREIRA; VEROCAI; CORDEIRO; GOMES; COSTA, 2015). This is because scientists require a certain support to reach out to the commercialization of the outcomes of the research; the registry of industrial property is one of the factors that increases investments in new research, infrastructure for laboratories and other institutional demands (O’KANE, 2018; SILVA; GOMES; COSTA JUNIOR, 2018).
The resources for investment in scientific research is sometimes scarce; consequently, in order to support scientific studies, it is necessary to understand the impact of the lack of efficiency; conversely, it is also necessary to understand the impact of fewer investments in scientific research, and how this investment can be applied in the laboratory of an educational institution, i.e. university.
Considering the scenario presented herein, the purpose of this paper is to observe the efficiency of scientific laboratories by applying the method Data Envelopment Analysis (DEA) in order to identify the different clusters of investment in laboratories in the fields of biomedicine, medicine and exact sciences. The outcomes of this analysis can also shed light on the possibility of making investments in laboratories; these new
investments would not be only used by the efficient laboratory, but they could also be employed to boost research in more inefficient ones, i.e. labs with scarcity of resources.
The following section of this paper contextualizes the concept of efficiency regarding technology research, as well as the use of DEA as a nonparametric method. In the third section, the methodology is presented, followed by the results of the research (Section 4), and final considerations (Section 5).
Theoretical framework
The fast occurrence of changes hampers the acquisition of technology due to the exogenous processes present in production environments. There is a difficulty in assimilating new technologies by the individuals that did not take part in the creation process. Currently, one of the technological dimensions for innovation is the permanent learning provided by scientific research and studies. Regarding higher education institutions, i.e. universities, educational performance evaluations are usually subject to several variables that need to be taken into account simultaneously (MELLO; GOMES; MEZA; MELLO; MELLO, 2006).
Innovation in the context of universities
According to Chesbrough (2003), there are some seminal studies in the field of open innovation that indicate a few dimensions regarding the origin of open innovation, innovative user, research for exogenous knowledge, commercialization of this exogenous technology, implementation of mechanisms and tools, creation of open innovation in specific industries and, finally, the generation of ideas for competition purposes (KOVÁCS; LOOY; CASSIMAN, 2015; LAMBERTI; MICHELINO; CAMMARANO; CAPUTO, 2015).
Technological innovation is the evolution of useful knowledge, which is enabled and constrained by existing institutions and influenced by the ongoing negotiation and recombination of overlapping institutions (i.e., social technology) (VARGO; WIELAND; AKAKA, 2015).
There are several definitions for the concept of service innovation and all of them relate to improvements in performance and strengthening the capacity of the firm to compete with other firms. In many cases, the provision of service can be more valuable to the company than trading products, considering that products tend to turn into commodities at a faster pace (CHEN; BATCHULUUN; BATNASAN, 2015).
Thus, service innovation has emerged as a delivering service of the other economic sectors, which are considered more important in the field of economics. Due to the importance attributed to the things – i.e. products – that are delivered, technology and innovation theories tend to focus on such products, neglecting the relevance of the provision and innovation of services (KLEMENT; YU, 2008). In addition, the current approach uses the innovation analysis in conjunction with the service sector and the manufacturing industry in terms of innovation (Ibid).
The exchange of knowledge generates a problem-solving process in which knowledge-intensive business services transform information and knowledge into customized solutions that their customers use in innovation processes (SHEARMUR; DOLOREUX; LAPERRIÈRE, 2015).
By dimensioning the identification of innovation, productive agents need to participate in research and development processes in order to pursue constant innovation - mainly the ones operating in small and medium-sized businesses – in order to assimilate knowledge, and to enable the transfer of technology, creating a rupture.
Investment in universities might be regarded by entrepreneurs who wish to promote their demand for knowledge capitalization by bringing together teachings, trainings and closer relationships between universities and private partners, as observed by Etzkowitz (2008). The Triple Helix Model brings together government, private initiative and universities to establish a permanent process to boost innovation. In this way, bringing together universities, the agents of the production process and the government makes everyone establish themselves in a process of technological monitoring that keeps people and organizations connected in permanent learning, internalizing the innovation in the productive processes in an incremental or radical way. Each participation dimension has its own areas of expertise and operates with synergy and complementarity in the fields of promotion, research, and application of innovation.
The Triple Helix Model, at the university level, considers the extension of these concepts to the field of technology. It should be understood as the situation in which the institution introduces a product and/or technologically new process, as well as when a technologically significant improvement is introduced in its own process and product. Updates and modernizations are not understood as technological innovation (ETZKOWITZ, 2008). The technology of a scientific lab needs to be perceived through the development of projects in high-tech labs, with high-tech machinery and suppliers,
considering that professionals must be given the appropriate training for management and operational purposes. The university, through its management structure, stimulates the creation of scientific laboratories - also in early stages – and fights for their development, either in the context of the internal structures, i.e. university environment and facilities, or in the search for connections with productive processes, and society agents that support the development of a partnership in order to reach the desired scientific outcomes.
The enforcement of the Brazilian Innovation Law (nº. 10.973/2004) became one of the most important milestones in the promotion of technological innovation in Brazil because it brought together universities and the knowledge economy upon sharing knowledge with society by promoting inventions and intellectual property. Despite the growth in the number of patents originating from universities and research institutes over the past few years, it is important to observe what happens inside the IES to better understand their performance in terms of innovation (SANTOS; TORKOMIAN, 2013; SILVA; GOMES; COSTA JUNIOR, 2018).
Thus, considering that the purpose of a scientific laboratory is to promote innovation and technology created within universities to the society in general, the educational institution analyzed herein evaluated some opportunities to institutionalize its scientific laboratories and to open investment opportunities for external parties. These scientific laboratories were created to promote registries of intellectual properties. On the one hand, companies contact laboratories in universities and research institutions to promote technological innovation, which leads to the establishment of intellectual property rights and subsequent profit for both parties involved. On the other hand, the society reaches for universities and research institutions in order to promote scientific developments that lead to researches that can be disseminated throughout society – such transaction often does not include payment of royalties, but includes registry of intellectual property and has the potential to generate profit depending on the partnership between the private entity and the higher education institution (SILVA; GOMES; COSTA JUNIOR, 2018).
In this section, Henry Chesbrough’s open innovation dimensions were contextualized in accordance with Henry Etzkowitz’s Triple Helix Model, concerning the internalization and externalization of technology where the solutions via patenting for using new technologies and licensing are some new types of networking to deal with innovations. Concepts were aligned according to the perspective of scientific
laboratories for improving innovative goods and services in order to bring to the university a feedback from other scientific laboratories in the short term and to support the scientific networking in the middle term, until another innovative rupture occurs.
Data Envelopment Analysis – DEA
A seminal article that developed some concepts and definitions about Data Envelopment Analysis was written by Charnes, Cooper and Rhodes (1978); the original title of this article was Measuring the Efficiency of Decision-Making Units and it was published in the European Journal of Operational Research (EJOR). This article provides the necessary information to establish a Multicriteria Decision Aid in order to empirically measure productive efficiency of Decision Making Units (DMUs). This is a model where resources (whether scarce or not) are analyzed as inputs; the outputs are the result stemming from the calculation of criteria, i.e. inputs are considered available criteria producing different outputs (PEREIRA; MELLO, 2015; CHARNES; COOPER; RHODES, 1978).
DEA is a complex model that aims at modeling real-world issues where it is necessary to establish the efficiency of a productivity unit. It is an operational research technique that enables the investigation between the relationship input-output of each DMU with other analyses, considering their weights computed via linear programming in order to maximize the DMU’s efficiency (MEZA; BIONDI NETO; MELLO; GOMES, 2005). Although DEA has a strong link to operational research, this tool is also used in management, where its adoption supports measuring efficiency in the fields of energy, industry, banking, educations, and healthcare (including hospitals) (EMROUZNEJAD; GUO-LIANG, 2017).
The use of DEA in this paper as a supportive decision method is relevant because it is a linear programming procedure used for the estimation of production frontiers relating inputs and outputs; the weights of the inputs and outputs are not required a priori (KI-HOON; REZA, 2012). In this particular application, the inputs and outputs developed by the university analyzed herein are taken into consideration because all scientific research is important for the development of technological advances in society.
DEA compares the performance among DMUs that perform similar tasks and distinguish them according to the used inputs and produced outputs. DEA presents some mathematical models; two of the most famous ones are the Constant Return
Scale (CRS), also known as CCR (CHARNES; COOPER; RHODES, 1978), and the Variable Return Scale (VRS) also known as BCC (BANKER; CHARNES; COOPER, 1984), where the factors considered in the input do not cause a proportional variation in the outputs. In a nutshell, the first model considers constant returns to scale; the second one assumes variable returns to scale and no proportionality among inputs and outputs (MEZA; BIONDI NETO; MELLO; GOMES, 2005).
The justification of the use of DEA in this paper followed the guidelines elaborated by Meza, Biondi Neto, Mello and Gomes (2005); i.e. CCR is a problem of multipliers or efficiency ratio, in which products and inputs are transformed into single measures. The performance measure of each DMU is optimized through k program runs, one for each DMU. The BCC-DEA model is a strong basis for DEA models, whose premise does not require constant returns to scale and the production planning is a production possibility set (PPS) belonging to a convex combination, for a possible production planning set. There is a convexity restriction to be in DMUs combination:
∑ 𝜆 = 1
.The BCC-DEA Model has its basic formulation as follows, considering the PPS as (JAHANSHAHLOO; LOTFI; AKBARIAN, 2010):
𝑇 = {(𝑋, 𝑌)|𝑋 ≥ ∑
𝑗∈𝐽𝜆
𝑗𝑋
𝑗, 𝑌 ≤ ∑
𝑗∈𝐽𝜆
𝑗𝑌
𝑗, ∑
𝑗∈𝐽𝜆
𝑗= 1, 𝜆
𝑗≥ 0, 𝑗 ∈ 𝐽
}
(1)where Xj and Yj are input and output vectors of DMUj, respectively. The input-oriented BCC-DEA Model computes DMUk, k ∈ J as follows:
min
𝜃 − 𝜖(∑
𝑚𝑖=1𝑠
𝑖−+ ∑
𝑠𝑟=1𝑠
𝑟+)
subject to:∑ 𝜆
𝑗𝑦
𝑟𝑗 𝑗∈𝐽− 𝑠
𝑟+= 𝑦
𝑟𝑘, 𝑟 = 1, … , 𝑠,
∑ 𝜆
𝑗𝑥
𝑖𝑗 𝑗∈𝐽+ 𝑠
𝑖−= 𝜃𝑥
𝑖𝑘, 𝑖 = 1, … , 𝑚,
(2)∑ 𝜆
𝑗 𝑗∈𝐽= 1,
𝜆
𝑗≥ 0, 𝑗 ∈ 𝐽
𝑠
𝑖−≥ 0, 𝑖 = 1, … , 𝑚,
𝑠
𝑟+≥ 0, 𝑟 = 1, … , 𝑠,
𝜃𝑓𝑟𝑒𝑒.
The output-oriented BCC-DEA Model corresponds to DMUk; k ∈ J, where:
Max
𝜑 + 𝜖(∑
𝑚𝑖=1𝑡
𝑖−+ ∑
𝑠𝑡
𝑟+ 𝑟=1)
Subject to:∑ 𝜆
𝑗𝑦
𝑟𝑗 𝑗∈𝐽− 𝑡
𝑟+= 𝜑𝑦
𝑟𝑘, 𝑟 = 1, … , 𝑠,
∑ 𝜆
𝑗𝑥
𝑖𝑗 𝑗∈𝐽+ 𝑡
𝑖−= 𝑥
𝑖𝑘, 𝑖 = 1, … , 𝑚,
(3)∑ 𝜆
𝑗 𝑗∈𝐽= 1,
𝜆
𝑗≥ 0, 𝑗 ∈ 𝐽,
𝑡
𝑖−≥ 0, 𝑖 = 1, … , 𝑚,
𝑡
𝑟+≥ 0, 𝑟 = 1, … , 𝑠,
𝜑𝑓𝑟𝑒𝑒.
Variable returns to scale in the BCC-DEA Model are obtained from a convexity constraint because hyperplanes do not need to pass through the origin, unlike the CCR-DEA Model. According to this assumption, the efficiency of BCC-DEA Models is higher than that of CCR-DEA Model regarding output orientation and all the computation surrounding its development. Hence, the BCC-DEA Model was chosen because it applies all the procedures pertinent to this paper regarding efficiency in the clusters of scientific laboratories in order to understand how these scientific laboratories become efficient and how they can support other labs in or outside their department areas at the university to pursue their own efficiency.
Methodology
The data was collected in this paper from a census used by the innovation department of a university, whose lab management can be characterized as bureaucratic. After collecting the data from this census, it was possible to investigate which laboratories were profitable by analyzing the conduction of research and the financial investments.
This data collection was accomplished in order to understand which scientific laboratories operating in the fields of science, technology and biomedicine had the infrastructure for offering better innovative products and services, patents, trademarks, and copyrights to increase the university’s revenue and to become more sustainable over time. Hence, it was possible to observe and analyze laboratories pertaining to seven different research fields: Biomedicine, Biosciences, Chemistry, Exact Sciences, Geology, Oceanography and Physics.
The coordinators of these laboratories informed the quantity of assets, human resources, and number of scientific productions, i.e. what the scientific laboratories have produced since their creation. The questionnaire was answered through an electronic institutional database with confidentiality. The data collection result was codified according to each scientific laboratory (e.g. “181Exact” means scientific laboratory number 181 pertaining to the field of exact sciences).
After understanding the initial elements, it was necessary to aggregate the scientific laboratories in clusters according to their area of operation; subsequently, it was used the DEA method in this empirical case to analyze the investments made in the scientific laboratories of a university. The purpose of such analysis is to observe the profitability of efficient labs and to investigate if the surplus of the financial investment is used in other inefficient labs in order to enable an improvement in their research. It was considered as inputs professors (who take part in the duties of the scientific laboratories, e.g. research and teaching), alumni (who participate in the research conducted at the scientific laboratory), incentives (revenues stemming from developed researches) and public-private partnerships (agreements between the society, companies, government and universities for developing research in product and service). It was considered as outputs activities as accomplished at events, published articles, published books, patented products, participation in social
projects, services (participations in services outside the scope of the research), and theses and/or dissertations.
In order to decide which of them could be an example to other scientific laboratories, it was necessary to observe their profiles. The DEA analysis shows, despite indicating efficiency, how an alternative can use the other one(s) as benchmarking; i.e. a comparison to improve its own inputs (criteria). It means that the tables presented herein indicate not only the efficiency of each laboratory, but also the comparisons that can be made between an effectively productive laboratory and laboratories still trying to achieve their full potential. The potential improvement of the scientific laboratories with low efficiency might attract further investments for their potential productivity with the support from the university rector and pro-rector, who are responsible for the survival of laboratories in the medium term.
The analysis focused on observing the efficiency of scientific laboratories, which improve scientific knowledge for the university while turning successful researches into investments for other – less efficient – laboratories and on demanding higher investments for research with middle and long-term outcomes.
Thus, this paper is looking for “hubs”. In other words, it means that scientific laboratories can trigger opportunities for the university to turn them into investments for developing other scientific laboratories, observing the possibility to improve researches according to new possibilities of investment. After analyzing the clusters, the benchmarking is accomplished for obtaining improvements in inefficient scientific laboratories (MELLO; MEZA; GOMES; SERAPIÃO; LINS, 2003).
By observing some DEA techniques aligned to the objectives of this paper, the BCC DEA model was chosen because of its particular orientation to outputs, since the purpose of scientific laboratories is to improve the efficiency of products and services; without fixing inputs or outputs, even when scientific researches differ in their elapsing of time for achieving results (MEZA; BIONDI NETO; MELLO; GOMES, 2005; PEREIRA; MELLO, 2015).
The collected data was computed by the software package ISYDS – Integrated System for Decision Support (in Portuguese, SIAD – Sistema Integrado de Apoio a
Decisão), version 3, in order to pursue efficiency and benchmarking results, regarding
clustered and non-clustered data. The program was chosen randomly for computing inputs and outputs, which enabled users to observe the DEA outcomes that indicated
which laboratories were able to financially support others (MEZA; BIONDI NETO; MELLO; GOMES, 2005).
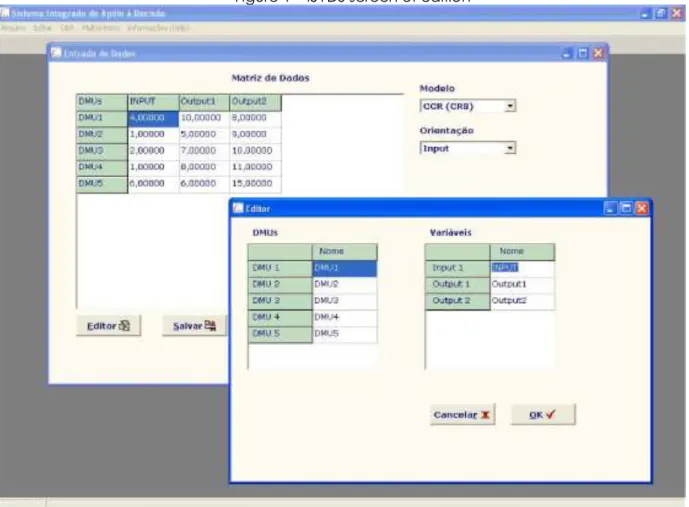
Basic DEA-CCR and BCC models are already included in ISYDS. Both models include input or output orientation, producing complete results: efficiency scores, weights, benchmarks, targets, and slacks (Ibid). It is possible to choose between the classic models (CCR or BCC) and orientation (input or output). The user can choose only one model and one orientation at a time and can also change the details of the data, e.g. values and variables names, with the toolbar (Ibid) (Figure 1).
Figure 1 – ISYDS screen of edition
Source: MEZA; BIONDI NETO; MELLO; GOMES (2005).
Results
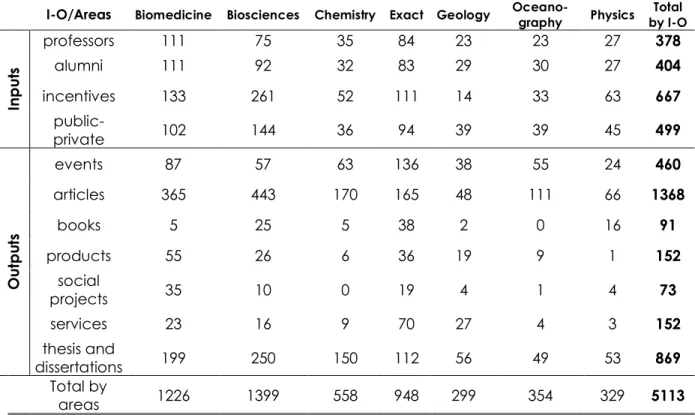
Table 1 shows 132 scientific laboratories according to each research field, where bioscience is the main area with the highest number of inputs and outputs.
Table 1 – Number of scientific laboratories according to the research area
Initially, 43.18% laboratories – from the total of 132 - were considered efficient as follows: 15 labs operating in the biomedicine area, 9 in biosciences, 8 in chemistry, 15 in the field of exact sciences, 5 in geology, 4 in oceanography, and just 1 in the field of physics.
The first BCC-DEA model computation indicated that three scientific laboratories were computed with zero efficiency; hence, it occurred a new computation with 132 scientific laboratories where, in this new process, no labs computed had zero results. The three scientific laboratories excluded were from the research fields of chemistry, exact sciences and biosciences.
According to the information, from the 31 scientific laboratories in the area of exact sciences only five need to improve their efficiency; in this cluster, 83.87% of the observations related to efficient laboratories. In Table 2, we observed that it is possible to understand standard global goals range from 23.46% up to 90.84% for these 5 scientific laboratories demanding changings. When the comparison occurs among scientific laboratories, at the benchmarking level analysis, there is a range from 0.000028% (368Exact lab for improving like 295Exact lab) up to 63.40% (235Exact lab for improving just like 396Exact lab).
I-O/Areas Biomedicine Biosciences Chemistry Exact Geology Oceano-graphy Physics by I-O Total
In p ut s professors 111 75 35 84 23 23 27 378 alumni 111 92 32 83 29 30 27 404 incentives 133 261 52 111 14 33 63 667 public-private 102 144 36 94 39 39 45 499 O ut p ut s events 87 57 63 136 38 55 24 460 articles 365 443 170 165 48 111 66 1368 books 5 25 5 38 2 0 16 91 products 55 26 6 36 19 9 1 152 social projects 35 10 0 19 4 1 4 73 services 23 16 9 70 27 4 3 152 thesis and dissertations 199 250 150 112 56 49 53 869 Total by areas 1226 1399 558 948 299 354 329 5113
Table 2 – Benchmarking analysis for the improvement of 5 laboratories in the field of exact sciences
Exacts labs id 231Exact 235Exact 248Exact 368Exact 372Exact
181Exact 0.00% 0.00% 0.00% 0.00% 11.39% 200Exact 33.24% 0.00% 6.93% 0.00% 5.32% 202Exact 0.00% 12.01% 0.00% 7.41% 37.89% 203Exact 0.00% 0.00% 3.00% 0.00% 0.00% 216Exact 0.00% 17.51% 0.00% 0.00% 0.00% 276Exact 0.00% 3.77% 6.22% 0.00% 0.00% 282Exact 0.00% 0.00% 8.08% 0.00% 7.51% 295Exact 2.53% 0.00% 0.00% 0.00% 0.00% 359Exact 2.41% 1.10% 0.00% 0.00% 0.00% 378Exact 0.00% 0.00% 45.96% 62.96% 9.57% 396Exact 0.00% 63.40% 29.81% 0.00% 0.00% 409Exact 27.64% 0.00% 0.00% 3.70% 0.00% 416Exact 33.90% 0.00% 0.00% 25.93% 28.32% 445Exact 0.27% 2.21% 0.00% 0.00% 0.00%
Source: The Authors (2019).
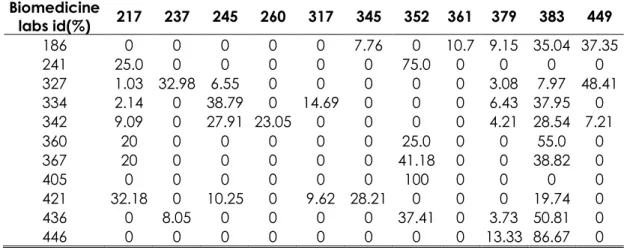
From the 35 scientific laboratories in the biomedicine area, 11 must improve their efficiency, which represents 31.43% of the efficiency of the cluster biomedicine. In Table 3 it is possible to observe global goals range between 15.38% (241Biomedicine lab) up to 99.05% (327Biomedicine lab). When the comparison occurs among scientific laboratories, at the benchmarking level analysis, there is a range that goes from 1.03% up to 100%. Lab 405biomedicine achieved the maximum efficiency; this way, the other laboratories need to improve significantly their performance to meet such capability (when compared to 352biomedicine in the direct benchmarking analysis), followed by 446biomedicine with 86.67% (in the direct benchmarking analysis, compared to 383biomedicine lab). Considering future studies, the 327Biomedicine lab is an opportunity for studying and analyzing its homogeneous qualitative features being either not comparing it to others.
Table 3 – Benchmarking analysis for the improvement of 11 laboratories in the field of biomedicine
Biomedicine labs id(%) 217 237 245 260 317 345 352 361 379 383 449 186 0 0 0 0 0 7.76 0 10.7 9.15 35.04 37.35 241 25.0 0 0 0 0 0 75.0 0 0 0 0 327 1.03 32.98 6.55 0 0 0 0 0 3.08 7.97 48.41 334 2.14 0 38.79 0 14.69 0 0 0 6.43 37.95 0 342 9.09 0 27.91 23.05 0 0 0 0 4.21 28.54 7.21 360 20 0 0 0 0 0 25.0 0 0 55.0 0 367 20 0 0 0 0 0 41.18 0 0 38.82 0 405 0 0 0 0 0 0 100 0 0 0 0 421 32.18 0 10.25 0 9.62 28.21 0 0 0 19.74 0 436 0 8.05 0 0 0 0 37.41 0 3.73 50.81 0 446 0 0 0 0 0 0 0 0 13.33 86.67 0
There are 25 scientific laboratories in the field of biosciences, and, according to Table 4, efficiency is found in 18 whilst 7 must improve their efficiency: 209biosciences, 228biosciences, 229biosciences, 330biosciences, 403biosciences, 404biosciences and 420biosciences. In the benchmarking analysis, the opportunity for increasing the global goals of these 7 scientific laboratories ranges from 52.08% (420 labs) up to 88.99% (228 labs).
The benchmarking analysis indicates that there is a range from 0.17% (lab 228 compared to 447 lab) up to 77.78% (lab 229 compared to 447 lab id). The second strongest comparison for pursuing a change in performance is lab 330biosciences, with 64.29% (considering this lab intends to reach out the efficiency of lab212).
Table 4 – Benchmarking analysis for the improvement of 7 laboratories in the field of biosciences(%) Labs id 212 213 252 263 309 340 391 400 407 417 427 447 209 13.84 47.29 0.00 27.68 0.00 8.96 0.00 0.00 0.00 0.00 0.00 2.24 228 0.00 1.68 0.00 0.00 34.66 0.00 33.52 27.97 0.00 2.01 0.00 0.17 229 0.00 0.00 0.00 0.00 0.00 0.00 0.00 0.00 22.22 0.00 0.00 77.78 330 64.29 7.14 0.00 28.57 0.00 0.00 0.00 0.00 0.00 0.00 0.00 0.00 403 13.04 0.00 6.52 26.09 0.00 0.00 0.00 0.00 0.00 54.35 0.00 0.00 404 0.00 0.00 35.00 20.00 0.00 0.00 0.00 23.65 0.00 2.50 18.85 0.00 420 0.00 35.89 0.00 0.00 10.86 0.00 12.56 25.35 0.00 15.34 0.00 0.00
Source: The Authors (2019).
It was observed that, in the field of chemistry, 13 laboratories were considered efficient; however, in the benchmarking analysis, one scientific lab needs improvements (402chemistry), according to Table 5, ranging from 5.81% (when 402chemistry lab is compared to 344, which is placed in a higher position) up to 76.74% (when 402 lab is compared to 218chemistry lab, which is placed in an even higher position).
Table 5 – Benchmarking analysis for the improvement of 3 laboratories in the field of chemistry (%)
Lab id 218chemistry 287chemistry 344chemistry
402chemistry 76.74% 17.44% 5.81%
Source: The Authors (2019).
Considering there was no benchmarking analysis, in the field of Geology it was not possible to establish a comparison of efficiency among the 8 scientific laboratories. In other words, it is possible to affirm that all geology laboratories were efficient.
In the field of Oceanography, 11 scientific laboratories were considered completely efficient; however, there are opportunities for improving – via benchmarking analysis –2 scientific laboratories, according to Table 6, from 25.00% (when 182oceanography lab is
compared to 314 lab and 450 lab, both placed in higher positions) up to 100%, when 365oceanography is compared to 364oceanography, which is placed in a quite better position; the last comparison indicates a paradox between 365 and 364 because in order to achieve efficiency, the participation in events must be increased.
Table 6 – Benchmarking analysis for the improvement of 2 laboratories in the field of oceanography (%)
Labs id 302oceanography 314oceanography 364oceanography 450oceanography
182oceanography 50.00% 25.00% 0.00% 25.00%
365oceanography 0.00% 0.00% 100.00% 0.00%
Source: The Authors (2019).
The 9 laboratories of the physics area showed total efficiency and the benchmarking comparison among them presents an utmost efficiency among the 9 laboratories.
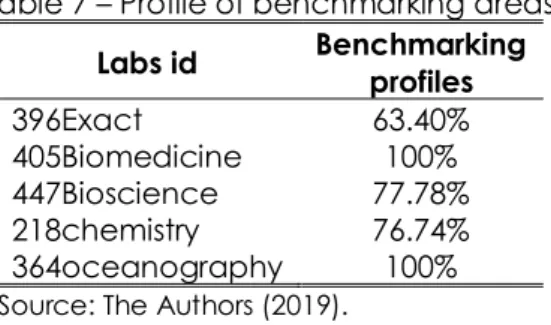
Table 7 – Profile of benchmarking areas
Labs id Benchmarking profiles
396Exact 63.40%
405Biomedicine 100% 447Bioscience 77.78% 218chemistry 76.74% 364oceanography 100%
Source: The Authors (2019).
As shown in Table 7, the highest efficiency performance of some laboratories work as a benchmarking for others, which are still considered inefficient and are trying to learn how to conduct better their researches. Considering the scientific laboratory “396Exact”, its benchmarking plays a relevant role in the number of researches it produced, indicating a high number of outputs, such as articles, theses and books. The lab “405Biomedicine” organized its inputs for developing researches at the cell level, speeding up the conduction of researches; the same was accomplished by lab “447Bioscience” and “364oceanography”. The benchmark of lab “218chemistry” achieved the highest performance, with articles and theses as outputs. It is interesting to observe that 3 labs organized their inputs for offering better output results, whilst other labs conducted research to produce more outputs, giving them high benchmarking power.
Regarding Chemistry, Oceanography, Geology and Physics labs in the DEA analysis, it is possible to conclude that these four areas were not quite well explained in their efficiencies because the DMUs numbers were a little unexpected for such in the analysis. This observation is important for future research that aims at investigating efficiency in the middle and long terms regarding this university. It might be important to apply DEA
methods in minmax and minsum criteria, discrimination power of DMUs, and zero-sum game modelling in order to understand better their efficiencies and to make better decisions on the allocation of investments.
The efficiency strategic plan of the university, which lasted 6 months, required the assistance from the rector and pro-rector, who summoned several departments (Physics, Chemistry, Oceanography, and Geology) to support one another in order to achieve the desired research outcomes. Some inputs, e.g. professors, alumni, incentives and public-private partnerships, were necessary to boost research in laboratories pertaining to the fields of Biomedicine, Bioscience, and Exact sciences.
The purpose of the 6-month (and ongoing) strategic plan carried out by the university on this project is to observe how different areas of knowledge can cooperate by sharing their intellectual assets (e.g. facilities or partnerships) in and outside the university campus. Such situation can be considered a “barter project”, a system of exchange used to increase the number of outputs. As a beginner level “barter project”, it is not possible to measure the monetary efficiency gain stemming from the scientific laboratories; however, considering the lack of financial resources provided by the university, the scientific laboratories are still carrying out their research while supporting one another (learning how to articulate themselves in order to work with inputs producing better outputs) and implementing actions for their own independent living, e. g. participation in scientific meetings. This paper shows how efficiency can be increased within intellectual production, focusing mainly on articles, theses and books; not monetary gains in the short term.
Conversely, the “barter project” considers how an efficient lab might support an inefficient scientific laboratory without compromising their research or diminishing their efficiency. Some good perspectives come along as the first outcomes start to emerge: private companies are partnering with some scientific laboratories in order to promote research and to create new partnerships among the agents involved, helping to carry out researches with scarce financial resources.
Final considerations
Innovation research may struggle when there is a scarcity of financial support. This way, the open innovation must be aligned with the government, private initiatives and universities to establish a permanent process that boosts innovation. Regarding scarcity, sometimes a university needs to recreate its projects looking inside its departments in order
to figure out how to achieve efficiency in the researches carried out in scientific laboratories.
The application of the BCC-DEA Model, used to investigate the challenge of improving efficiency in scientific laboratories of a university, was applied successfully in the short term perspective, considering the data collected at this first stage of this research; especially because the university is currently on strike. It is important for future studies to use as output scientific articles corroborating the goals of scientific laboratories, considering they provide society with a sustainable performance over time.
Clustering the efficiency analysis clarified which laboratories were efficient within their clusters and which ones were inefficient outside the cluster. Such analysis shows that it is important to consider the difference between facilities and intellectual assets produced by scientific research. Thus, inside the clusters, it was possible to identify 4 efficient areas (e.g. ready to support other ones) and 3 inefficient areas, despite benchmarking opportunities to improve the lab’s efficiency. The rector and pro-rector of the university emphasized that doing benchmarking is a relevant tool to be used in the short term, considering the periods of insufficient financial resources and delay in receiving money by government funding agencies.
Considering the use of DEA analysis in future studies, the four efficient laboratory fields might be analyzed considering other models, such as minmax and minsum criteria, discrimination power of DMUs, and zero-sum game modelling in order to understand better their efficiencies and to make better decisions on the allocation of investments.
It is possible to observe in the middle and long terms if this “barter project” would became a good parameter for the university to reallocate better its resources in order to promote higher efficiency in their scientific laboratories by using the BCC-DEA Model or other multicriteria aid supportive tools.
References
BANKER, R. D.; CHARNES, A.; COOPER, W. W. Some models for estimating technical and scale inefficiencies in data envelopment analysis. Management Science, Providence, v. 30, n. 9, p. 1078-1092, 1984. Available in:
https://personal.utdallas.edu/~ryoung/phdseminar/BCC1984.pdf. Access in: 8 oct. 2017.
BRASIL. Lei 10.973, de 2 de dezembro de 2004. Dispõe sobre incentivos à inovação e à pesquisa científica e tecnológica no ambiente produtivo e dá outras
providências. Diário Oficial da União, Brasília, DF, dez. 2004. Available in:
http://www.planalto.gov.br/ccivil_03/_ato2004-2006/2004/lei/l10.973.htm. Access in: 9 oct. 2017.
CHARNES, A.; COOPER, W. W.; RHODES, E. Measuring the efficiency of decision-making units. European Journal of Operational Research, Amsterdam, v. 2, n. 6, p. 429-444, 1978. Available in:
https://personal.utdallas.edu/~ryoung/phdseminar/CCR1978.pdf. Access in: 8 oct. 2017.
CHEN, J. K. C.; BATCHULUUN, A.; BATNASAN, J. Services innovation impact to customer satisfaction and customer value enhancement in airport. Technology in
Society, New York, v. 43, p. 219-230, 2015. Available in:
https://daneshyari.com/article/preview/375137.pdf. Access in: 10 oct. 2017.
CHESBROUGH, H. W. The era of open innovation. MIT Sloan Management Review, Cambridge, v. 44, n. 3, p. 35-41, 2003. Available in:
https://pdfs.semanticscholar.org/81d3/eb67d64c6ade17eb190836cdd5cb3fbdc76f. pdf?_ga=2.129378252.1960258784.1594236757-209608428.1594134065. Access in: 11 oct. 2017.
EMROUZNEJAD, A.; GUO-LIANG, Y. A survey and analysis of the first 40 years of scholarly literature in DEA: 1978-2016. Socio-Economic Planning Sciences, New York, v. 61, p. 4-8, 2017. Available in:
https://pure.aston.ac.uk/ws/files/21790118/First_40_years_of_scholarly_literature_in_D EA.pdf. Access in: 10 feb. 2018.
ETZKOWITZ, H. The triple helix: university-industry-government innovation in action. New York: Routledge, 2008.
JAHANSHAHLOO, G. R.; LOTFI, F. H.; AKBARIAN, D. Finding weak defining hyperplanes of PPS of the BCC model. Applied Mathematical Modelling, New York, v. 34, n. 11, p. 3321-3332, 2010. DOI: https://doi.org/10.1016/j.apm.2010.02.023. Available in:
https://www.sciencedirect.com/science/article/pii/S0307904X10000843. Access in: 8 oct. 2017.
KI-HOON, L.; REZA, F. S. Measuring corporate sustainability management: a data envelopment analysis approach. International Journal of Production Economics, Amsterdam, v. 140, n. 1, p. 219-226, 2012.
KLEMENT, C. F. F.; YU, A. S. O. Influência da tecnologia para a inovação em serviços.
Rev. Adm. UFSM, Santa Maria, RS, v. 1, n. 1, p. 101-115, jan./abr. 2008.
KOVÁCS, A.; LOOY, B. V.; CASSIMAN, B. Exploring the scope of open innovation: a bibliometric review of a decade of research. Scientometrics, Amsterdam, v. 104, n. 3, p. 951-983, 2015. DOI: https://doi.org/10.1007/s11192-015-1628-0. Available in:
https://link.springer.com/article/10.1007/s11192-015-1628-0. Access in: 10 oct. 2017.
LAMBERTI, E.; MICHELINO, F.; CAMMARANO, A.; CAPUTO, M. Open innovation measurement: a conceptual framework based on literature review. In: IBIMA CONFERENCE, 25., 2015, Amsterdam. Proceedings […]. Amsterdam: IBMA, 2015. p. 975-980.
MELLO, J. C. C. B. S. de; GOMES, E. G.; MEZA, L. A.; MELLO; M. H. C. S. de; MELLO, A. J. R. S. de. Engineering post-graduate programmes: a quality and productivity analysis.
Studies in Educational Evaluation, Elmsford, NY, v. 32, n. 2, p. 136-152, 2006.
MELLO, J. C. C. B. S. de; MEZA, L. A.; GOMES, E. G.; SERAPIÃO, B. P.; LINS, M. P. E. Análise de envoltória de dados no estudo da eficiência e dos benchmarks para companhias aéreas brasileiras. Pesquisa Operacional, Rio de Janeiro, v. 23, n. 2, p. 325-345, 2003. DOI: http://dx.doi.org/10.1590/S0101-74382003000200005. Available in: https://www.scielo.br/pdf/pope/v23n2/a05v23n2.pdf. Access in: 11 oct. 2017.
MEZA, L. A.; BIONDI NETO, L.; MELLO, J. C. C. B. S. de; GOMES, E. G. ISYDS – Integrated System for Decision Support (SIAD – SISTEMA INTEGRADO DE APOIO A DECISÃO): a software package for data envelopment analysis model. Pesquisa Operacional, Rio de Janeiro, v. 25, n. 3, p. 493-503, 2005. DOI:
http://dx.doi.org/10.1590/S0101-74382005000300011. Available in: https://www.scielo.br/pdf/pope/v25n3/27835.pdf. Access in: 9 oct. 2017.
O’KANE, C. Technology transfer executives' backwards integration: an examination of interactions between university technology transfer executives and principal investigators. Technovation, Essex, v. 76-77, p. 64-77, 2018.
PEREIRA, E. R.; MELLO, J. C. C. B. S. de. Uso da suavização da fronteira na
determinação de pesos únicos em modelos DEA CCR. Production, São Paulo, v. 25, n. 3, p. 585-597, 2015. DOI: http://dx.doi.org/10.1590/0103-6513.057710. Available in: https://www.scielo.br/pdf/prod/v25n3/0103-6513-prod-057710.pdf. Access in: 14 oct. 2017.
PEREIRA, F. de C.; VEROCAI, H. D.; CORDEIRO, V. R.; GOMES, C. F. S.; COSTA, H. G. Bibliometric analysis of information systems related to innovation. Procedia Computer
Science, [S. l.], v. 55, p. 298-307, 2015. Available in:
https://www.researchgate.net/publication/280308528_Bibliometric_Analysis_of_Infor mation_Systems_Related_to_Innovation. Access in: 9 oct. 2017.
SANTOS, M. E. R. dos; TORKOMIAN, A. L. V. Technology transfer and innovation: the role of the brazilian TTOs. International Journal of Technology Management &
SHEARMUR, R.; DOLOREUX, D.; LAPERRIÈRE, A. Is the degree of internationalization associated with the use of knowledge intensive services or with innovation?.
International Business Review, [S. l.], v. 24, n. 3, p. 457-465, 2015.
SILVA, M. do C.; GOMES, C. F. S.; COSTA JUNIOR, C. L. da. A hybrid multicriteria methodology topsis-macbeth-2n applied in the ordering of technology transfer offices. Pesquisa Operacional, Rio de Janeiro, v. 38, n. 3, p. 413-439, 2018. DOI: https://doi.org/10.1590/0101-7438.2018.038.03.0413. Available in:
https://www.scielo.br/pdf/pope/v38n3/1678-5142-pope-38-03-413.pdf. Access in: 8 nov. 2018.
UNIVERSITY INSTITUTION. Data collected from innovation department. [S. l: s. n.], 2016. VARGO, S. L.; WIELAND, H.; AKAKA, M. A. Innovation through institutionalization: a service ecosystems perspective. Industrial Marketing Management, New York, v. 44, p. 63-72, 2015.