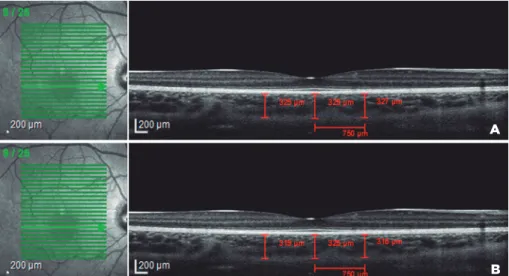
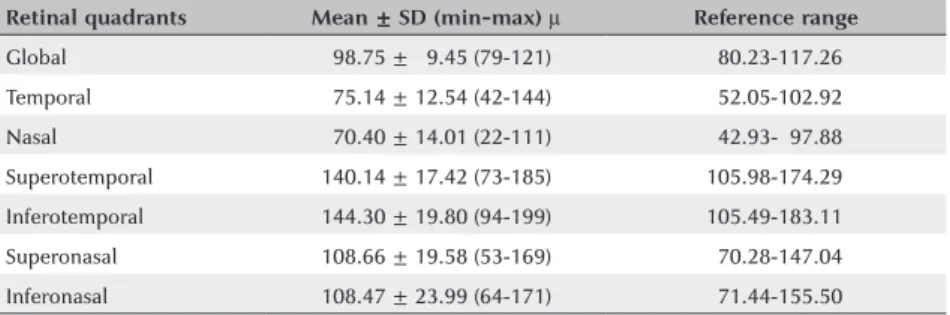
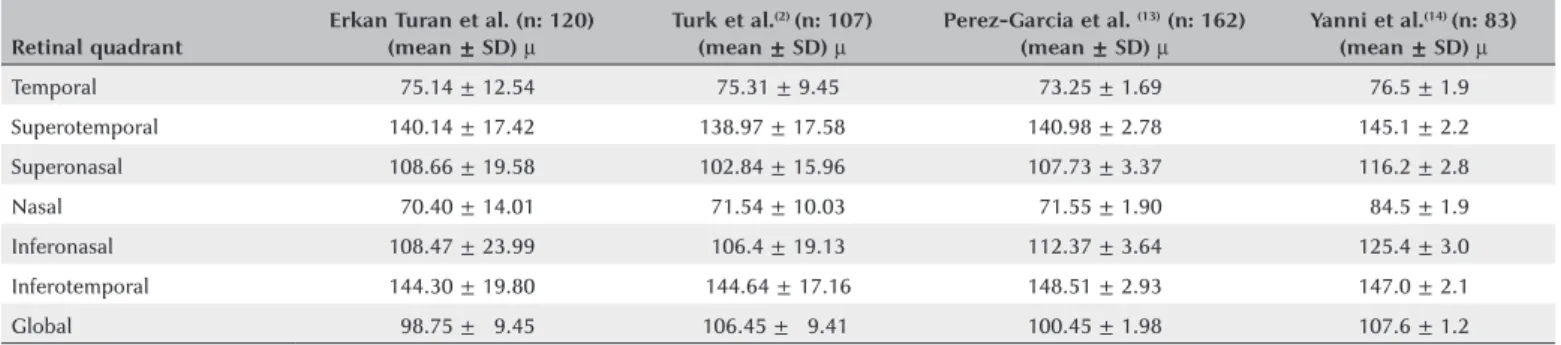
Normative values for optical coherence tomography parameters in healthy children and interexaminer agreement for choroidal thickness measurements
Texto
Imagem
Documentos relacionados
IL-based aqueous biphasic systems (IL-based ABS) as separation processes ... Extraction and purification of biocompounds using IL-based ABS ... Antioxidants and amino acids ...
(a) Photoresponse of a cork sensor with two ZnO/EC printed layers for different applied voltages; (b) photoresponse of a cork sensor to 10 complete cycles ON/OFF, at a lower
Purpose : To evaluate the association between macular hole volume (MHV) and postoperative central macular thickness (CMT ) using spectral-domain optical coherence tomography
Purpose: To investigate subfoveal choroidal thickness (SFCT ) in patients with pre-eclampsia using enhanced depth imaging optical coherence tomography (EDI-OCT ).. Methods: A
Purpose: To evaluate choroidal thickness (CT ) using spectral domain optical coherence tomography (SD-OCT ) imaging at baseline and 6 months after intravi- treal
De acordo com alguns autores Figueiredo (2001), Martínez, citado por cid e Peres (2007) e Hervey, citado por Jacob (2008), a animação sociocultural na terceira
Neste trabalho, a PET/CT com FCH-F18 apresentou bons resultados no restadiamento de doentes com CaP em recidiva bioquímica, permitindo a identificação de doença à
Comparando os resultados obtidos para Portugal com o Top 10 de cada atributo turístico, verifica-se que Portugal é associado mais frequentemente que a média (dos restantes
