O R I G I N A L A R T I C L E S UDC: 617.7-007.681 DOI: 10.2298/VSP150224163Z
Peripapillary retinal nerve fiber layer thickness in different glaucoma
stages measured by optical coherence tomography
Debljina peripapilarnih retinalnih nervnih vlakana kod razli
č
itih stepena
glaukoma merena opti
č
kom koherentnom tomografijom
Maja Živković*, Vesna Jakšić†, Predrag Jovanović*, Marko Zlatanović*, Gordana Zlatanović*, Jasmina Djordjević-Jocić*
*Ophthalmology Clinic, Clinical Center Niš, Niš, Serbia; †Faculty of Medicine, University of Belgrade, Belgrade, Serbia
Abstract
Background/Aim. One of the most reliable methods for structural measurements of glaucomatous damage is spectral domain optical coherence tomography (SD-OCT). The aim of this study was to measure peripapillary retinal nerve fiber layer (RNFL) thickness with SD-OCT in eyes with different stages of glaucoma, as well as to determine which sector in the peri-papillary circle is the most vulnerable to glaucomatous damage. Methods. The study included 153 eyes of 93 patients with confirmed primary open angle glaucoma (POAG). All the pa-tients underwent a complete ophthalmic examination, includ-ing visual field testinclud-ing and peripapillary RNFL thickness meas-ured by SD-OCT. They were divided into three subgroups: early, moderate and severe stage of glaucoma based on the mean deviation (MD) index of visual field. The results were presented as mean RNFL thickness: total, in the four quadrants and 12 clock-hour RNFL thickness. Results. The overall mean peripapillary RNFL was 74.95 14.51 μm. The lower quadrant had the thickest RNFL (92.78 25.84 μm), followed by upper (88.82 22.04 μm), nasal (64.31 11.67 μm) and temporal ones (54.02 12.76 μm), showing a significant difference (χ2 = 273.36, DF = 3, p < 0.001). Comparison between RNFL thick-ness in early glaucoma and moderate and severe stages revealed that the most sensitive sectors were inferior and superior ones, as well as sectors at 5–7 clock hour position. The greatest de-crease in RNFL thickness was observed in the 9 o'clock hour sector in all three glaucoma subgroups (46.99 13.28 μm), while the RNFL was the thickest in the 6 o'clock hour sector (102.63 34.12 μm). Conclusion. Peripapillary RNFL thickness is in-versely proportional to the degree of glaucomatous damage: the greater the damage, the thinner peripapillary RNFL.
Key words:
glaucoma, open-angle; disease progression; nerve fibers; optic disk; diagnosis; tomography, optical, coherence; sensitivity and specificity.
Apstrakt
Uvod/Cilj. Jedna od najpouzdanijih metoda za merenje strukturnih promena kod glaukoma je spektralna optička koherentna tomografija – spectral domain optical coherence tomo-graphy (SD-OCT). Cilj rada bio je da se izmeri debljina peri-papilarnih retinalnih nervnih vlakana (RNFL) uz pomoć SD-OCT, kao i da se utvrdi koji je sektor u pomenutom prostoru najosetljiviji na glaukomatozno oštećenje. Metode. U studiju je bilo uključeno ukupno 153 očiju 93 bolesnika sa potvrđenim primarnim glaukomom otvorenog ugla (POAG). Svim bolesnicima urađen je kompletan oftal-mološki pregled, uključujući dodatno kompjuterizovano vidno polje i merenje peripapilarnih RNFL pomoću SD- OCT. Bolesnici su bili podeljeni u tri podgrupe: rani, srednji i odmakli stepen glaukoma (prema vrednostima MD na vid-nom polju). Rezultati. Rezultati su predstavljeni kao sred-nje vrednosti ukupne debljine RNFL za celu grupu i podgrupe, kao i preko 4 cirkularna i 12 linearnih sektora. Srednja vrednost RNFL iznosila je 74,95 14,51 µm. Na-jdeblji je bio donji kvadrant (92,78 25,84 µm), potom gornji (88,82 22,04 µm), nazalni (64,31 11,67 µm) i tem-poralni (54,02 12,76 µm) što je značajna razlika (χ2 = 273,36, DF = 3, p < 0,001). Poređenjem debljine RNFL kod ranog glaukoma u odnosu na srednji i odmakli stadijum, najsenzitivniji su bili gornji i donji kvadrant kao i sektor od 5 do 7 sati. Najtanja je bila pozicija na 9 sati (46,99 13,28 µm), a najdeblja na 6 sati (102,63 34,12 µm). Zaključak. Debljina peripapilarnih RNFL i stepen glaukoma su obrnuto proporcionalni: veći stepen oštećenja podrazumeva tanja peripapilarna RNFL.
Ključne reči:
neuropathy characterized by structural changes of the optic nerve head (ONH) and peripapillary retinal nerve fiber layer (RNFL) damage associated with functional visual field (VF) defects. An early detection and follow up of glaucoma require functional testing using standard automated perimetry (SAP) as gold standard, particularly the 24–2 Swedish Interactive Threshold Algorithm (SITA) strategy, as well as structural tes-ting which can be based on ophthalmic findings and followed by stereoscopic photography of ONH. But, one of the most re-liable methods for objective and precise structural measure-ments of glaucomatous damage is the optical coherence tomography (OCT) which provides both quantitative and qualitative measurements of the RNFL thickness.
OCT in diagnostics of the ONH structural changes became a part of standard procedure for diagnosis and moni-toring of patients with retinal pathology. OCT is also highly sensitive in differentiating glaucomatous from non-glaucomatous ONH changes which include (non)arteritic an-terior ischemic opticopathy, intracranial tumors, optical neu-ritis, dominant optic atrophy, methanol poisoning, Leber's opticopathy 1–5 where OCT finding shows more diffuse dec-rease in peripapillary RNFL thickness in comparison to glau-coma 6. Also, the differences between healthy eyes and eyes with glaucoma are significant 7. Due to its advantages in per-forming examinations, OCT method can significantly facili-tate differentiation of ONH structural damages in suspected cases.
It should be noted that numerous factors, such as age, axial length etc. can affect RNFL thickness giving false posi-tive results shown as linear regression 8–13.
The aim of this study was to measure peripapillary RNFL thickness with spectral domain OCT (SD-OCT) in the eyes with different stages of glaucoma, as well as to deter-mine which sector in the peripapillary circle is the most vul-nerable one to glaucomatous damage.
Methods
This study included 153 eyes of 93 patients with con-firmed primary open angle glaucoma (POAG). Patients with glaucoma were referred from the glaucoma department of the University Eye Clinic in Niš, Serbia. All the patients underwent complete ophthalmic examination, including best corrected visual acuity, intraocular pressure measurement by applanation tonometry, gonioscopy, visual field testing using the 24-2 SITA algorithm (Humphrey Field Analyzer II; Carl Zeiss Meditec, Inc., Dublin, CA), slit lamp examination of anterior segment and fundus examination with a plus 90-diopter lens. Peripapillary, RNFL thickness was measured using a glaucoma analysis mode in Cirrus HD OCT device software version 6.0 (Carl Zeiss Meditec, Inc.). This study followed the tenets of the Declaration of Helsinki, the study protocol was approved by the Ethics Committee of the Me-dical faculty of Niš and informed consent was obtained from all the participants. They were classified into three subgroups
dB. The patients with any other intraocular disease, opacifica-tion of ocular media, intraocular surgery, ocular trauma and secondary glaucoma were excluded from the study.
Inclusion criteria were: confirmed POAG (glaucomato-us VF loss consistent with optic nerve damage), VF test reliability indices values, such as false positive, false negati-ves and fixation loss less than 20%; no ocular opacities or other ocular pathology, no other structural optic nerve ab-normalities or secondary glaucoma; negative history of pre-vious eye disease, trauma and/or eye surgery and no neuro-logic disease; axial length in referral values.
ONH imaging was automatically made over an area of 6×6 mm by a 200×200-pixel resolution axial scan. Each eye was dilated with tropicamide 1% drops before recording. Images with a signal power more than seven were used for analysis. In all subgroups overall mean of the whole circle circumference, linear maps at 12 o'clock hour positions and circular maps within 4 quadrants and mean peripapillary RNFL thickness were recorded for each patient.
For the statistical analysis, mean peripapillary RNFL and its segment in four quadrants, as well as at 12 o'clock hour positions were calculated. Comparison between the me-ans of the groups for paired variables was evaluated by one-way ANOVA. Kolmogorov-Smirnov test was used to deter-mine whole circle circumferences, 4 quadrants and 12 clock-hour sectors RNFL thickness distribution in the observed group and subgroups. Data were analyzed using SPSS v. 20.0 for Windows (SPSS, Inc., Chicago, IL). The value of p
< 0.05 was considered statistically significant.
Results
The study included 153 randomly selected eyes in 93 POAG patients (52 female and 41 male), mean age of 65.09 ± 10.12 years (range 20–59 years). The subgroups were age and sex matched. The overall mean peripapillary RNFL was 74.95 ± 14.51 µm. The RNFL was the thickest in the lower quadrant (92.78 µm), followed by upper (88.82 µm), nasal (64.31 µm), and temporal (54.02 µm) quadrant. The overall mean, 4 quadrants mean, and 12 clock-hour sectors mean RNFL thiakness values are shown in Table 1.
There was a highly significant difference between the observed quadrants in different glaucoma stages (χ2 = 273.36, DF = 3, p < 0.001). Temporal quadrant was highly
significantly thinner than all the other quadrants, while the nasal one was significantly thinner than upper and lower ones (p< 0.001). A detailed comparison of the
peripapillary RNFL thickness in all four sectors and among different stages of glaucoma showed the following results: in temporal and nasal sectors there was no difference in RNFL thickness regression between moderate and severe glaucoma (the loss of RNFL thickness was 17% vs 8%,
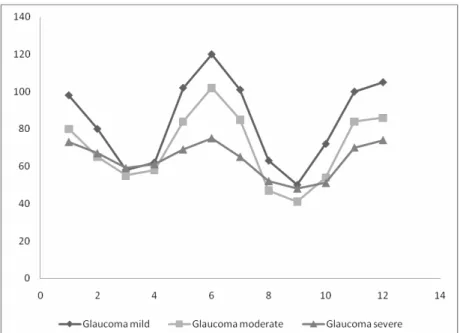
Fig. 1 – Thickness (μm) of peripapillary retinal nerve fiber layer (RNFL) in early (mild), moderate and severe glaucoma in 12 o'clock sectors.
inferior sector, results of peripapillary RNFL show thinning of 16% in moderate, up to 35% in severe glaucoma.
The curves of RNFL thickness in three glaucomatous subgroups are presented in Figure 1. As it can be seen, the thinnest sector in all the three glaucoma subgroups (mean thickness was 46.99 13.28 μm) is at 9 o'clock hour positi-on. The RNFL thicknesses among the different glaucoma subgroups was significantly different, but an overlapping was observed. At positions 3, 4, 8 and 9 o'clock, the thinnest peripapillary RNFL was in moderate glaucoma instead of se-vere glaucoma, as expected. It is interesting that at positions from 3 up to 5 o'clock, there was no difference in RNFL thickness with repeated overlapping in moderate glaucoma subgroup vs. severe glaucoma subgroup.
The results of this study show that the greatest thinning and linear regression of peripapillary RNFL from early to moderate and, finally, severe glaucoma, were in the following positions: 6 o'clock position – in moderate glau-coma 15% up to 38%, at 7 o'clock position - 16% up to 37%, at 5 o'clock hour – 18% up to 33%.
Discussion
OCT offers a possibility of quantitative and morpholo-gic RNFL analysis. For the purposes of measuring peripapillary RNFL thickness in this study we used Cirrus HD-OCT, which was found to be a reliable diagnostic tool with excellent reproducibility regarding the monitoring of glaucoma progression, as demonstrated by many studies 14, 15. Also, SD-OCT demonstrates advantage over time domain OCT for two reasons. First, it shows an enlarged circle aro-und the optic nerve head with sufficient detail to identify possible errors caused by influence of potential epiretinal
following: average RNFL thickness represents the mean thick-ness of the entire nerve fiber that reaches the optic disc. Also, the majority of the nerve fibers converge on the optic disc either superiorly or inferiorly. In the present study, the peripapillary RNFL was thicker superiorly and inferiorly, which can be explained by normal peripapillary RNFL distribution. In early glaucoma, as reported in some histological studies, there is 25– 35% loss of retinal ganglion cells before VF damage is confir-med, while many of these nerve fibers are still undamaged 17. Taliantzis et al. 18 reported that deep structural alterations detec-ted by OCT are an important indicator of early glaucomatous changes, even if they are not detected with SAP. Once the VF loss is established, smaller amounts of RNFL thickness are necessary for the reduction of mean deviation value 19.
those with early glaucoma, but not between early and mode-rate glaucomatous eyes. Our study shows that the linear re-duction of RNFL thickness as glaucomatous damage is more progressive. It should be mentioned that more glaucomatous eyes were included in the study (153 vs 68) and we used SD
OCT, not scanning laser polarimetry for RNFL thickness measurement. However, even a complete loss of ganglion cells, as it is demonstrated in severe glaucoma, leaves some residual thickness which consists of glial cells and blood vessels 24. In the end, even residual retinal thickness in the eyes with severe glaucoma is different in different peripapillary sectors, corresponding with papillomacular bundle. It supports the result of this study that in nasal and temporal sectors there is no difference between different gla-ucoma stages, while in superior and inferior quadrants the thinning of peripapillary RNFL is significant.
As previously mentioned, SD-OCT is useful for deter-mining structural changes in peripapillary RNFL thickness, and also for evaluating the correlation between perimetric defects and corresponding nerve fiber loss 25. New summary statistics combining VF and OCT results are being develo-ped, as it has been reported in a study of Racette et al. 26 who integrated functional and structural measurements using Arti-ficial Neural Networks. Very similar to these results, Bizios et al. 27 demonstrate relevance vector machine on a combined optimized confocal scanning laser ophthalmology (CSLO) device using the Heidelberg retina tomograph (HRT) and short-wavelength automated perimetry data for the purpose of improving glaucoma diagnostic accuracy. The multivaria-te and Moorfields algorithm of the HRT provide good ability to distinguish glaucoma tous from normal eyes 22.
Most studies included patients with VF loss, as we did. But, when glaucoma suspects with normal VF were in-cluded in the study, the sensitivity and specificity of diag-nostic tests were significantly lower when compared to ca-ses with glaucomatous VF abnormalities 22. In presented study we were focused on a SD OCT potential and power to detect the difference between RNFL thickness in diffe-rent glaucoma stages without comparing with VF defects. Since the before mentioned approach could have limited utility, we considered that it is very important to define the peripapillary RNFL sectors that are most vulnerable to gla-ucomatous damage.
As it was reported, a simple OCT imaging report is sensi-tive to providing quantitasensi-tive information for most cases, but for difficult ones interpreting physicians should have conside-rable experience in analyzing OCT scans 16 and they should always have on mind that OCT is only a part of the glaucoma diagnostics and the following up process which is of great im-portance when combined with SAP or CSLO results.
Conclusion
The sector of the thickest peripapillary RNFL is the temporal one, followed by nasal, superior and inferior sec-tors. The thinning of the RNFL at advanced stages of glau-coma is greater in the inferior and superior sectors. There is no decrease of peripapillary RNFL thickness in the nasal and temporal quadrants in comparison to early glaucoma RNFL thickness. The most valuable and sensitive parameters in as-sessing the degree of peripapillary RNFL glaucomatous da-mage are in the 5, 6 and 7 clock hour sectors.
R E F E R E N C E S
1. Deleon-Ortega JE, Arthur SN, McGwin G Jr, Xie A, Monheit BE, Girkin CA. Discrimination between glaucomatous and nonglaucomatous eyes using quantitative imaging devices and subjective optic nerve head assessment. Invest Ophthalmol Vis Sci 2006; 47(8): 3374−80.
2. Medeiros FA, Zangwill LM, Bowd C, Vessani RM, Susanna R, Weinreb RN. Evaluation of retinal nerve fiber layer, optic nerve head, and macular thickness measurements for glaucoma de-tection using optical coherence tomography. Am J Ophthal-mol 2005; 139(1): 44−55.
3. Jaffe GJ, Caprioli J. Optical coherence tomography to detect and manage retinal disease and glaucoma. Am J Ophthalmol 2004; 137(1): 156−69.
4. Greaney MJ, Hoffman DC, Garway-Heath DF, Nakla M, Coleman AL, Caprioli J. Comparison of optic nerve imaging methods to distinguish normal eyes from those with glaucoma. Invest Ophthalmol Vis Sci 2002; 43(1): 140−5.
5. Zangwill LM, Bowd C, Berry CC, Williams J, Blumenthal EZ, Sánchez-Galeana CA, et al. Discriminating between normal and glaucomatous eyes using the Heidelberg Retina Tomograph, GDx Nerve Fiber Analyzer, and Optical Coherence Tomo-graph. Arch Ophthalmol 2001; 119(7): 985−93.
6. Gupta PK, Asrani S, Freedman SF, El-Dairi M, Bhatti TM. Dif-ferentiating glaucomatous from non-glaucomatous optic nerve cupping by optical coherence tomography. Open Neurol J 2011; 5: 1−7.
7. Cvenkel B, Kontestabile AS. Correlation between nerve fibre layer thickness measured with spectral domain OCT and visual field in patients with different stages of glaucoma. Graefes Arch Clin Exp Ophthalmol 2011; 249(4): 575−84.
8. Sakata LM, Deleon-Ortega J, Sakata V, Girkin CA. Optical co-herence tomography of the retina and optic nerve: A review. Clin Experiment Ophthalmol 2009; 37(1): 90−9.
9. Savini G, Barboni P, Carbonelli M, Zanini M. The effect of scan diameter on retinal nerve fiber layer thickness measurement using stratus optic coherence tomography. Arch Ophthalmol 2007; 125(7): 901−5.
10.Parikh RS, Parikh SR, Sekhar GC, Prabakaran S, Babu JG, Tho-mas R. Normal age-related decay of retinal nerve fiber layer thickness. Ophthalmology 2007; 114(5): 921−6.
11.Wu Z, Vazeen M, Varma R, Chopra V, Walsh AC, LaBree LD, et al. Factors associated with variability in retinal nerve fiber layer thickness measurements obtained by optical coherence tomo-graphy. Ophthalmology 2007; 114(8): 1505−12.
12.Harwerth RS, Wheat JL, Rangaswamy NV. Age-related losses of retinal ganglion cells and axons. Invest Ophthalmol Vis Sci 2008; 49(10): 4437−43.
15.Mwanza J, Chang RT, Budenz DL, Durbin MK, Gendy MG, Shi W, et al. Reproducibility of peripapillary retinal nerve fiber layer thickness and optic nerve head parameters measured with cir-rus HD-OCT in glaucomatous eyes. Invest Ophthalmol Vis Sci 2010; 51(11): 5724−30.
16.Hood DC, Raza AS. On improving the use of OCT imaging for detecting glaucomatous damage. Br J Ophthalmol 2014; 98(Suppl 2): ii1−ii9.
17.Kerrigan-Baumrind LA, Quigley HA, Pease ME, Kerrigan DF, Mitchell RS. Number of ganglion cells in glaucoma eyes com-pared with threshold visual field tests in the same persons. In-vest Ophthalmol Vis Sci 2000; 41(3): 741−8.
18.Taliantzis S, Papaconstantinou D, Koutsandrea C, Moschos M, Apos-tolopoulos M, Georgopoulos G. Comparative studies of RNFL thickness measured by OCT with global index of visual fields in patients with ocular hypertension and early open angle glau-coma. Clin Ophthalmol 2009; 3: 373−9.
19.Galvão Filho RP, Vessani RM, Susanna R Jr. Comparison of reti-nal nerve fibre layer thickness and visual field loss between dif-ferent glaucoma groups. Br J Ophthalmol 2005; 89(8): 1004−7. 20.Sihota R, Sony P, Gupta V, Dada T, Singh R. Diagnostic
capabil-ity of optical coherence tomography in evaluating the degree of glaucomatous retinal nerve fiber damage. Invest Ophthal-mol Vis Sci 2006; 47(5): 2006−10.
21.Leung CK, Chan WM, Yung WH, Ng AC, Woo J, Tsang MK, et al. Comparison of macular and peripapillary measurements for
report by the American Academy of Ophthalmology. Oph-thalmology 2007; 114(10): 1937−49.
23.Hwang YH, Kim YY. Glaucoma diagnostic ability of quadrant and clock-hour neuroretinal rim assessment using cirrus HD optical coherence tomography. Invest Ophthalmol Vis Sci 2012; 53(4): 2226−34.
24.Hood DC, Anderson SC, Wall M, Kardon RH. Structure versus function in glaucoma: an application of a linear model. Invest Ophthalmol Vis Sci 2007; 48(8): 3662−8.
25.Horn FK, Mardin CY, Laemmer R, Baleanu D, Juenemann AM, Kruse FE, et al. Correlation between local glaucomatous visual field defects and loss of nerve fiber layer thickness measured with polarimetry and spectral domain OCT. Invest Ophthal-mol Vis Sci 2009; 50(5): 1971−7.
26.Racette L, Chiou CY, Hao J, Bowd C, Goldbaum MH, Zangwill LM, et al. Combining functional and structural tests improves the diagnostic accuracy of relevance vector machine classifiers. J. Glaucoma 2010; 19(3): 167−75.
27.Bizios D, Heijl A, Bengtsson B. Integration and fusion of stan-dard automated perimetry and optical coherence tomography data for improved automated glaucoma diagnostics. BMC Ophthalmol 2011;11: 20.