http://dx.doi.org/10.1590/s2175-97902018000317223
Article
*Correspondence: A. H. Helmy. Pharmaceutical Chemistry Department, Na-tional Organization for Drug Control and Research (NODCAR), 6 Abo-Hazem Street, Haram, Giza, Egypt. E-mail: [email protected]
Forced degradation of gliquidone and development of validated
stability-indicating HPLC and TLC methods
Mohamed Refaat El-ghobashy
1, Ali Mohamed Yehia
1, Aya Helmy Helmy*
2, Nadia Fayek Youssef
21Analytical Chemistry Department, Faculty of Pharmacy, Cairo University, Cairo, Egypt, 2Pharmaceutical Chemistry Department, National Organization for Drug Control and Research (NODCAR), Giza, Egypt
Forced degradation studies of gliquidone were conducted under different stress conditions. Three degradates were observed upon using HPLC and TLC and elucidated by LC-MS and IR. HPLC method was performed on C18 column using methanol-water (85:15 v/v) pH 3.5 as a mobile phase with isocratic
mode at 1 mL.min-1 and detection at 225 nm. HPLC analysis was applied in range of 0.5-20 µg.mL-1
(r =1) with limit of detection (LOD) 0.177 µg.mL-1. TLC method was based on the separation of
gliquidone from degradation products on silica gel TLC F254 plates using
chloroform-cyclohexane-glacial acetic acid (6:3:1v/v) as a developing system with relative retardation 1.15±0.01. Densitometric measurements were achieved in range of 2 -20 µg /band at 254 nm (r = 0.9999) with LOD of 0.26 µg /band. Least squares regression analysis was applied to provide mathematical estimates of the degree of linearity. The analysis revealed a linear calibration for HPLC where a binomial relationship for TLC. Stability testing and methods validation have been evaluated according to International Conference on Harmonization guidelines. Moreover, the proposed methods were applied for the analysis of tablets and the results obtained were statistically compared with those of pharmacopeial method revealing no significant difference about accuracy and precision.
Keywords: Gliquidone/forced degradation/stability-indicating. HPLC/method validation. TLC/method
validation.
INTRODUCTION
Gliquidone is 1, 1-cyclohexyl-3-{4-[2-(3, 4-dihydro-7-methoxyy-4, 4-dimethyl-1, 3- dioxo-2 (1H) - isoquinolyl)
ethyl benzene sulphonyl]} urea. It is a sulfonylurea
derivative used as oral anti-diabetic drug for the treatment
of type 2 diabetes mellitus. The drug is given as a supplemental therapy followed by diet modification and
improves the glycemic control as well as reducing the blood sugar level (Brayfield, 2014). Gliquidone is official in BP(Brithish Pharmacopeia, 2016). Literature survey revealed that quantitation of gliquidone has been achieved by UV spectrophotometry (Arayne, Sultana,
Mirza, 2006), LC-MS (Maurer et al., 2002) and HPLC in dosage form and biological fluids (Arayne et al., 2010a; Arayne et al., 2010b; Guo et al., 1992; Sridevi, Diwan, 2000). Recently, spectrofluoremetric normal and
derivative synchronous methods have been published for the determination of gliquidone in drug substance and drug products (El-Ghobashy et al., 2018). To date, no stability -indicating method has been described in the literature and no previous studies focused on gliquidone degradation have been performed. As per regulatory requirements for registration of new drugs, stress degradation should be
applied. Therefore, forced degradation studies involving
gliquidone will increase the chemical information about the degradation products of active pharmaceutical ingredients in both pure and pharmaceutical forms (Görög, 2000)
offering a scientific impact for the present novel work. In
addition, the stress testing to identify the degradation of the molecule can be further used to develop stability-indicating methods of analysis (FDA, 2000). A stability-indicating method accurately measures the changes in active ingredient concentration without interference from other degradation
products, impurities and excipients (ICH, 2003a).
The goals of the present study are: i) to perform a
forced degradation study of gliquidone according to the
of the degradation products; iii) to develop and validate
HPLC and TLC methods able to quantify the drug even in
the presence of the its degradation products.
EXPERIMENTAL
Material and chemicals
Drug substance, gliquidone working standard (99.36%) was kindly supplied by Mina Pharm Company,
Cairo, Egypt. Drug product, Glorenor® tablets, batch No. EIE2313 Mina pharm under license of Menarini –Italy
labeled to contain 30 mg gliquidone per each tablet and was purchased from commercial sources in the local
market. HPLC grade methanol (Macron Poland), ethanol
(Sigma Aldrich, USA), water-in house was bi-distilled.
Chloroform (Sigma Aldrich), cyclohexane (S.D. fine-chem limited, Mumbai, India), glacial acetic acid (Piochem
Egypt). Sodium hydroxide extra pure 98 % (Lobachem
Mumbai, India), hydrochloric acid 37% (Honeywell) and
hydrogen peroxide 30% (Panreac) were analytical grade.
b. Instrumentation and chromatographic conditions For HPLC: an HPLC system (Agilent Technology
1260 series, USA) equipped with G1314F UV detector, G1311C quaternary pump, G1316A column oven, Agilent 1260 series vacuum degasser, and 20 microliter loop manual injector was used. HPLC separation and analysis were performed on C18, 250 mm × 4.6 mm, 10 µm, column
(Phenomenex®, USA). The mobile phase consisted of
methanol and water pH 3.5 adjusted with ortho-phosphoric acid (85:15 v/v) using a pH meter (Jenway 3510, England).
An isocratic elution with a flow rate of 1 mL.min-1 was kept
throughout the analysis and the detection was achieved
at 225 nm. The column was conditioned for ≥30min at
ambient temperature (25 ± 2 °C). Data were recorded and analyzed by Chemstation® software (Agilent, USA). A mixture of methanol-water in the ratio of (85: 15 v/v) was
used as a diluent for the working solutions. All solutions
were filtered through 0.45 mm nylon membrane filter before HPLC injections.
For TLC- densitometry: CAMAG scanner 3 plus and CAMAG TLC sampler linomat IV (CAMAG, Multenz, Switzerland) supplied with a 100 µL syringe for TLC- densitometric determinations. The following parameters were taken into consideration; slit dimension: 6×0.3 mm;
scanning speed: 20mm/s; data resolution: 100 µm/step; bandwidth: 6 mm. Results output: chromatograms and
integrated peak areas of WINCATS software. TLC aluminum
plates (20×10) were coated with 0.25 mm silica gel 60 F254 (Merck, Germany) and chloroform - cyclohexane -glacial
acetic acid (6:3:1v/v) was used as a developing system.
For LC- MS: an Agilent technology 6420 triple Quad LC/MS consisting of a G1311A gradient quaternary pump, G1329A auto injector, and the G6420A MS
detector was employed. HPLC separation was performed
on C18, 60×4.6 mm, 5 μm, column (BD, USA). The
mobile phase consisted of a mixture of acetonitrile
and acidified water (0.075% formic acid) at a flow rate
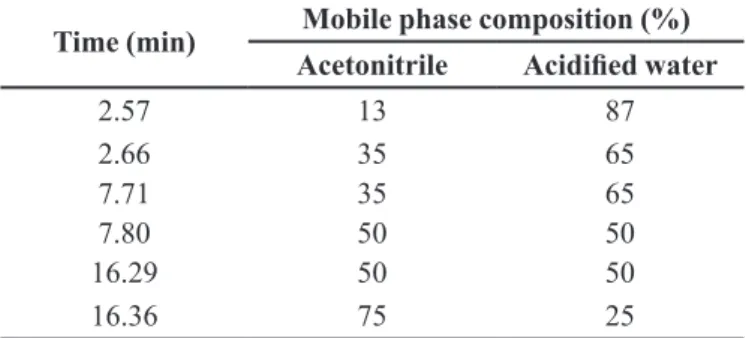
0.7 mL.min-1 (Table I). Nitrogen and gas temperature of 270 °C with a flow of 10 liter/min and nebulizer of 50 pounds per square inch (psi) were used. The ionization mode was ESI and the data were analyzed by Mass
Hunter® software.
For IR spectroscopy: NICOLET 6700, FT - IR Thermo SCIENTIFIC - CLASS 1 LASER PRODUCT (USA) using KBr disc, Mini - Pellet Press and OMNIC
software for data output.
Preparation of degradation product and stock standard solutions
Acid hydrolytic degradation
Gliquidone (50 mg) was refluxed for 9 hours with different concentrations of 50 mL ethanolic hydrochloric acid (1M; 2M; 3M; 4M) and the same concentration was left in 0.1-3 M ethanolic hydrochloric acid at room
temperature for 3 days. After this period, each solution was
neutralized, filtered, evaporated using a water bath, and
had the volume reconstituted with methanol to produce concentration equivalent to 1 mg.mL-1.
Base hydrolytic degradation
Gliquidone (50 mg) was refluxed for 9 hours with distinct concentrations of 50 mL ethanolic sodium
hydroxide (1 M; 2 M; 3 M; 4 M) and the same concentration was left in 0.1-3 M ethanolic sodium hydroxide at room
temperature for 3 days. After this period, each solution was
neutralized, filtered, evaporated using a water bath, and
had the volume reconstituted with methanol to produce concentration equivalent to 1 mg.mL-1.
TABLE I - Gradient elution of LC-MS mobile phase
Time (min) Mobile phase composition (%) Acetonitrile Acidified water
2.57 13 87
2.66 35 65
7.71 35 65
7.80 50 50
16.29 50 50
Neutral hydrolytic degradation
50 mg of gliquidone was refluxed with 50 mL of bi-distilled water for 5 hours and filtered, evaporated using water bath and completed to volume with methanol (1 mg.mL-1).
Oxidative degradation
50 mg of gliquidone was refluxed with 50 mL of
30% hydrogen peroxide for 5 hours, filtered, evaporated
using a water bath and completed to volume with methanol (1 mg.mL-1).
Thermal degradation
100 mg of gliquidone in solid state was spread
to 1 mm thickness in a Petridish and kept in the oven (Memmert UM-400, Germany) at 40 °C and 80 °C for 4 hours. 10 mg of each sample was taken into 10-mL volumetric flask, dissolved and diluted with methanol.
Stress degradation studies
From hydrolytic, oxidative and thermal degradation solutions (1 mg.mL-1), different aliquots were transferred into 10-mL volumetric flasks and diluted to the mark with
methanol for the primary trials. Samples were analyzed by
HPLC and TLC in order to evaluate the stability of intact drug towards these stress conditions. The basic hydrolytic degradation was analyzed by LC-MS. Moreover
degradation solution was applied in bands on silica gel glass plates and developed in chloroform -cyclohexane - glacial acetic acid (6:3:1 v/v). Each of the isolated bands
was extracted from silica with methanol, air dried and IR spectra were scanned. All collected samples were kept in
refrigerator at 5 °C ± 2.
Standard stock solutions
For HPLC, Gliquidone 0.2 mg.mL-1 was prepared
in methanol; further dilution with the diluent to obtain a solution of 20 µg.mL-1. For TLC, Gliquidone 1 mg.mL-1
was prepared in methanol.
Laboratory prepared mixtures solutions containing
different ratios of gliquidone and its alkaline degradation products were prepared to contain 10- 80% w/w of alkaline degradation for HPLC and TLC.
Preparation of calibration curves
HPLC method
Aliquots of standard solution 20 µg.mL-1 equivalent
to 5-200 µg of gliquidone were transferred into a series of
10-mL volumetric flasks, and the volume was completed with the diluent. Triplicate injections of each dilution
were eluted at flow rate 1mL.min-1 on a C18 column using methanol – water at pH 3.5 adjusted with ortho-phosphoric acid (85/15 v/v) as the mobile phase. The integrated peak areas were recorded at 225 nm under the specified
chromatographic conditions. Calibration curve was
prepared by plotting peak areas versus the concentration 0.5- 20 μg.mL-1 and the regression equation was computed.
TLC-densitometric method
Aliquots of standard solution 1 mg.mL-1 equivalent to 2 to 20µg/band were spotted on precoated TLC plates using CAMAG linomat IV applicator under a nitrogen stream. The procedure was carried out as under “Instrumentation
and chromatographic conditions” and plates were developed for up to 8 cm at room temperature in a chromatographic
chamber previously saturated for 30-45 minutes. The
plates were air dried and densitometric measurements were performed at 254nm in absorbance mode with the
CAMAG TLC scanner 3 as under the specified instrumental conditions. The calibration curve was prepared by plotting the peak areas versus the concentration 2-20 µg/band and
regression equation was computed.
Assay of Glorenor® tablets
Using HPLC method
Twenty tablets were accurately weighed, crushed to a fine powder. An accurately weighed portion equivalent
to 60 mg of gliquidone was transferred to 250-mL
beaker, extracted with 40 mL methanol by shaking for 30 min using an ultrasonic bath (sonamac), filtered into 100-mL volumetric flask and diluted to volume with the
same solvent. Further dilution with the HPLC diluent to obtain an 18 µg.mL-1 solution. The procedure detailed under “preparation of calibration curve “was followed
and gliquidone concentration was calculated using the corresponding regression equation.
Using TLC-densitometric method
Aliquots of the same tablets solution (60 mg.100 mL-1) covering the working concentration range were spotted and the procedure under “preparation of calibration curve” was
performed and gliquidone concentration was calculated using the corresponding regression equation.
RESULTS AND DISCUSSION
Results of forced degradation studies
elucidated by LC-MS analysis and IR-spectroscopy.
Gliquidone was found to be stable under thermal conditions at 40 °C and 80 °C for 4 hours (data not show). Partial degradation was observed under neutral hydrolytic and oxidative (30% H2O2) conditions for 5 hours (Figure 1a-b). Significant degradation was observed in 0.1 M-3 M
ethanolic HCl or ethanolic NaOH at room temperature for 3 days or refluxing for 7 hours (data not show). A complete degradation of gliquidone was produced only
upon using 4 M ethanolic HCl and 4 M ethanolic NaOH under reflux for 9 hours and the same peaks were observed in both conditions as shown in Figure 1c, d. The solutions were subjected to HPLC and TLC analysis to establish the number of products formed. The chromatographic profiles of the degradation products formed under 4 M ethanolic HCl and 4 M ethanolic NaOH conditions are presented in Figure 1c-d, respectively. In both conditions peaks with
same retention time were obtained.
Elucidation of the degradation products
LC/MS analysis: solution of base degradation was subjected to LC-MS analysis and mainly 3 degradation
products were detected. Suggested chemical formula and m/z were C8H12N2O2S (200.26) degradate I, C41H40N4O9S
(764.84) degradate II and C20H25N3O4S (403.49) degradate III. Gliquidone and suggested degradates structures were shown in Figure 2a, b, c and d.
IR spectra (Cross, 1964): IR spectrum of degradate I Figure 2b, C=O amide stretching; cyclohexyl groups; gem-dimethyl groups and CH-stretching at 2857 cm-1
of - O -CH3 were absent ,but 3467 (NH stretching), 1648
(NH bend), 1560 (NH bend, indicate – SO2NH) and 11332,1165 (S=O stretch) were present. The main groups of gliquidone IR spectrum Figure 2a, were observed in degradate II and suggested to form a more conjugated molecule Figure 2c. The presence of NH- stretching
FIGURE 1 - Original chromatograms of a) neutral hydrolytic degradation, b) oxidative degradation, c) acid hydrolytic degradation,
at 3502 cm-1; NH-amide at 1649 cm-1; C=O at 1713,
1676 cm-1; NH-bend at 1558 cm-1 indicate - SO 2NH-
sulfonamide group; S=O stretching at 1338 cm-1; and
cyclohexyl groups of 2930, 1456, 1260 cm-1 were an indication of degradate III Figure 2d.
Methods development
HPLC method
Stability-indicating HPLC method has been, optimized, developed, and validated for the separation and determination of gliquidone in presence of degradation
products Figure 1(a-e). The three components of HPLC
method: column type, mobile phase composition and aqueous phase pH were studied and asymmetry was a
function of judgment. The optimum ratio of mobile phase
composition was found to be methanol - water (85:15 v/v).
Water with pH value 3.5 offered a good symmetry, this
pH is about 1 pH unit below pKa of the acidic drug (4.3) hence the uncharged form is obviously predominant and high retention on C18 stationary phase is observed.
Working at a more acidic pH has an unfavorable effect
on column lifetime; therefore pH 3.5 was optimized
for peak symmetry and column capacity of gliquidone. Moreover, C18 column phenomenex
® 10µm 250×4.6mm improves the peak shapes and resolution of gliquidone and its degradation products Figure 1(a-e). The gliquidone
(Rt = 5.9±0.03 min) and the degradation products
(I: Rt = 2.26 min; II: Rt = 2.58 min; III = 2.91 min) were
detected at the maximum wavelength of absorption
(225 nm). Final conditions: 20 microliter injection volume, 1 mL.min-1 flow rate, 25 °C temperature, phenomenex®
C18 (250 mm×4.6 mm I.d., 10µ particle diameters) and
methanol- water pH 3.5 (85/15 v/v) were found to be ideal for HPLC performance.
TLC method
TLC-densitometric method was developed for the
resolution of gliquidone from its degradation products on
TLC aluminum plates, coated with silica gel 60 F254 as a stationary phase Figure 3b. The best developing system
was found to be chloroform, cyclohexane and glacial acetic acid in the ratio of (6:3:1v/v) showing Rf values 0.60±0.01 for gliquidone, and 0.01±0.01, 0.24±0.01, 0.52±0.01 for
the degradation products I, II, III respectively Figure 3a
and the calculated relative retardation factor (Rret) was
found to equal 1.15±0.01, revealing a good separation of
the drug from its degradation products. Different scanning
FIGURE 3 - a) 2D TLC-densitogram of separated peaks of gliquidone (Rf 0.60±0.01) and the 3 degradation products (Rf degradate.
I 0.01±0.01, degradate. II 0.24±0.01, degradate. III 0.0.52±0.01) and b) 3D TLC densitogram of gliquidone Rf (0.6±0.01) in the
wavelengths were tested (225,254 and 312) to obtain good
sensitivity with minimum noise. The slit dimensions of the
scanning light beam should ensure complete coverage of band dimensions without interference of the adjacent band and 6×0.3 mm was proved to be the slit dimension of choice that provided highest sensitivity and scanning at wavelength 254 nm. Gliquidone was successfully resolved from its degradation products upon using the mentioned conditions.
Method validation
The suggested HPLC and TLC methods were validated according to ICH guidelines (ICH, 2003b) for specificity, linearity, accuracy, precision and robustness to
demonstrate that the developed procedures are sensitive, selective, accurate, precise and suitable for their intended use and to be used for QC analysis of gliquidone in drug substance and pharmaceutical product.
Specificity
Specificity could be demonstrated by the resolution
of gliquidone and its degradation products as shown in
representative HPLC Figure 1a-e and TLC Figure 3a-b Chromatograms. The presented HPLC and TLC methods
were specific for identification and quantification of gliquidone in tablets without interference of excipients namely lactose, starch, pregelatinized starch and
magnesium stearate (Torrinomedica, 2015).
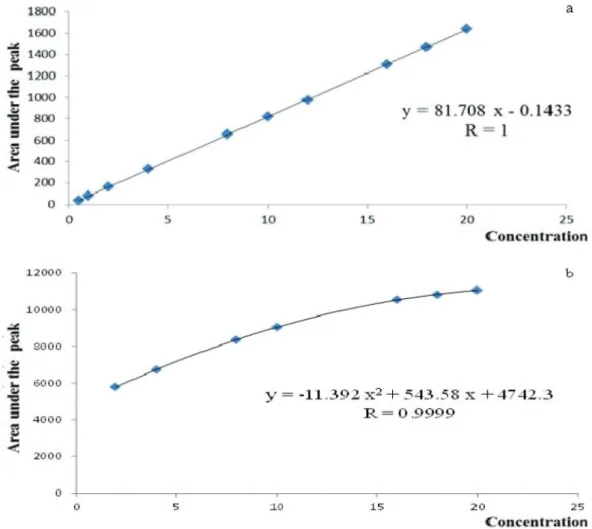
Linearity/range
Linearity was established by analysis of samples in concentration range 0.5-20 µg.mL-1 by HPLC and 2 - 20 µg/band by TLC. For HPLC method, the linear
relationship in the concentration range was evaluated by calculation of the regression line by the method of least
squares Figure 4a. However, for TLC method, regression
data were statistically analyzed and found to be binomial regression to provide mathematical estimates of the degree
of linearity Figure 4b. Correlation coefficient, y intercept,
slope of the regression line and the residual sum of squares
were listed in Table II.
Accuracy
Drug substance was analyzed using 3 concentrations of 9 determinations (2, 10, 18 µg.mL-1) for HPLC and (4, 10, 16 µg/band) for TLC methods Table II. The drug product was assayed by HPLC and TLC methods and
standard added technique was applied to demonstrate
the accuracy of the methods. The results were expressed as percent recovery ±%RSD. The calculated student’s t-test and the variance ratio F- test revealed no significant difference between the performance of both HPLC and TLC and the official method for tablets regarding accuracy and precision and the results were abridged in Table III
(Agarwal, 2013).
Precision
The intra-day variability was assessed considering
three concentration levels prepared in triplicate: 6, 10, and 14 µg.mL-1 and 8, 10, and 12 µg/band for the HPLC and
TLC methods, respectively. Intermediate precision was
determined by analyzing the same concentrations n=9 for
HPLC and for TLC on three successive days to estimate
inter-day variation. Precision results were expressed for
each type as %RSD as shown in Table II. The precision of instruments was checked by repeated measurement of the
concentration (10 µg.mL-1) for HPLC and (10 µg/band) for TLC for 6 times. %RSD for measured peak areas by both HPLC and TLC procedures was found to be 0.536 and 0.477, respectively. These values are bellow of that
considered adequate (1%) to ensure proper functioning of
HPLC and TLC systems.
LOD and LOQ
LOD and LOQ were calculated for both HPLC and
TLC procedures by the method based on the standard deviation σ of the response and the slope S of the calibration curve using the following formula: LOD = 3.3 σ/S and LOQ=10 σ/S and results are given in Table II.
Robustness
The robustness of analytical HPLC and TLC procedures is a measure of its capacity to remain unaffected
by small but deliberate variation. For HPLC method the following parameters were tested: pH of mobile phase ±0.1; mobile phase composition ±1 %, different C18 columns (suppliers), column temperature 25±2 ̊C, flow rate ±0.05 and wavelength ±1. For TLC method: different
plates (lots), developing system composition ±1 % and
scanning wavelength ±2. Negligible difference was found
in %RSD of response (0.56-1.65 for HPLC, 0.15-0.58 for
TLC). Moreover, robustness of the proposed methods was concerned with the stability of solutions for 2 weeks and
extraction time 10 - 30 min.
System suitability testing
System suitability parameters were evaluated. ICH
states that system suitability testing is an integral part TABLE II - Performance data and validation parameters developed for HPLC and TLC methods
Characteristic parameter HPLC TLC
Range 0.5-20 µg.mL-1 2-20µg/band
Slope 81.708 543.58 for x
11.392 for x2
SD of slope 0.176
---Intercept -0.143 4742.3
SD of intercept 2.018
---Correlation coefficient (r) 1 0.9999
LOD 0.177µg.mL-1 0.261µg/band
LOQ 0.537µg.mL-1 0.791µg/band
Residual sum of squares 117.485
---Accuracy (%recovery ± %RSD) Drug substance
Drug product
99.305±0.997 103.304±0.514
99.991±1.055 102.799±0.579 Precision (%RSD)
Intra-day Inter-day
Precision of instruments
0.867 1.812 0.536
TABLE III - Determination of gliquidone in pharmaceutical formulation by the proposed HPLC and TLC, application of the standard added technique and statistical comparison
Item Taken µg.mL-1 Found µg.mL-1 %Recovery %Comparison method
(Brithish Pharmacopeia, 2016)
HPLC method 1.8
5.4 10.8
18
1.869 5.540 11.147 18.636
103.85 102.61 103.21 103.53
103.20 103.18 102.85 103.48
Mean x̅ ± SD 103.30 ± 0.530 103.180 ± 0.256
SE 0.265 0.128
t-test 0.408 (2.45)
F-test 4.32 (9.28)
Standard added to 5.4 µg.mL-1 2.7
5.4 10.8
2.660 5.319 10.657
98.54 98.49 98.68
TLC method 3.6
6 8.4
12 18
3.705 6.114 8.673 12.404 18.460
102.92 101.89 103.25 103.36 102.56
Mean x̅ ± SD 102.80 ± 0.595
SE 0.266
t-test 1.287 (2.36)
F-test 5.446 (9.12)
Standard added to 6 µg/band 3
6 12
2.943 5.945 11.900
98.131 99.081 99.172
Figures between parenthesis are the tabulated t and F- values (at degree of freedom=4 for comparison method, =4 for HPLC and
=5 for TLC methods) at p=0.05 (B.L.Agarwal, 2013).
of the chromatographic procedures.Capacity factor (k̀), asymmetry factor, resolution (Rs), selectivity (α) and
number of theoretical plates (N) were calculated for HPLC (United States Pharmacopeia, 2016) and TLC (Variyar, Chattyie, Sharma, 2011) methods and the results are given
in Table IV.
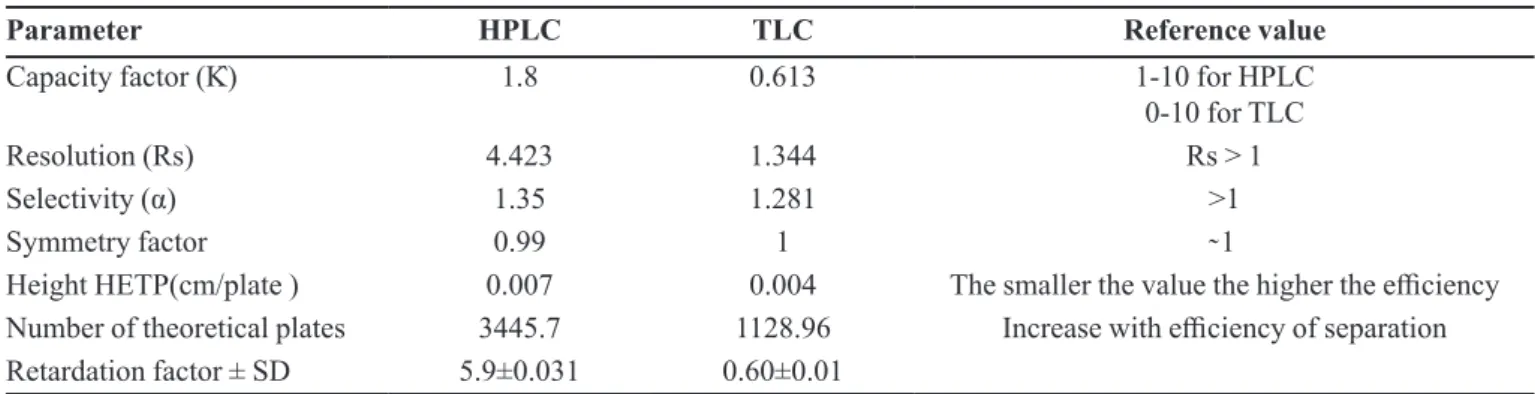
TABLE IV - System suitability parameters of HPLC and TLC methods developed for the determination of gliquidone
Parameter HPLC TLC Reference value
Capacity factor (K̀) 1.8 0.613 1-10 for HPLC
0-10 for TLC
Resolution (Rs) 4.423 1.344 Rs > 1
Selectivity (α) 1.35 1.281 >1
Symmetry factor 0.99 1 ̴ 1
Height HETP(cm/plate ) 0.007 0.004 The smaller the value the higher the efficiency
Number of theoretical plates 3445.7 1128.96 Increase with efficiency of separation
Retardation factor ± SD 5.9±0.031 0.60±0.01
CONCLUSION
Stability studies of gliquidone revealed its stability in thermal conditions and partially degraded under acid and base hydrolysis on cold, neutral hydrolysis and
M. R. El-ghobashy, A. M. Yehia, A. H. Helmy, N. F. Youssef
in acid and base hydrolytic conditions when refluxed for 9 hours. Results of HPLC and TLC showed the formation
of mainly 3 detectable degradation products in acid and
base media. The induced degradates were confirmed by LC - MS analysis and IR spectroscopy. Hence
chromatographic techniques introduce a high separation
power in pharmaceutical field so; HPLC and TLC have
been developed for the separation of gliquidone and its
degradation products. The cited methods were applicable
for assay and purity testing of gliquidone in drug substance and drug product without interference of tablet excipients.
The results obtained indicate that the introduced HPLC and TLC methods represent the sensitive, accurate, precise
and rapid stability-indicating assays for gliquidone.
Moreover, can be classified among the highly selective
procedures and contribute to QC routine analysis.
REFERENCES
Agarwal BL. Basic statistics. 6th ed. New Delhi, India: New Age International; 2013.
Arayne MS, Sultana N, Mirza AZ, Shamshad H.
High-performance Liquid Chromatographic analysis of pioglitazone, gliquidone, rosuvastatin and simvastatin in formulations and human serum. Chin J Chem. 2010a;28(10):1998-2002.
Arayne MS, Sultana N, Mirza AZ. Spectrophotometric method
for quantitative determination of gliquidone in bulk drug,
pharmaceutical formulations and human serum. Pak J Pharm
Sci. 2006;19(3):182-5
Arayne MS, Sultana N, Mirza AZ, Siddiqui FA. Validated
RP-HPLC method for quantification of gliquidone in pharmaceutical formulation and human serum. J Chil Chem Soc. 2010b;55(2):156-8.
Brayfield A. Matindale The complete drug reference. 38th ed.
London: Pharmaceutical Press; 2014.
Brithish Pharmacopeia. BP. London: TSO; 2016.
Cross AD. Introduction to practical Infra-Red spectroscopy. 2nd ed. London: Buttr WorthS; 1964.
El-Ghobashy MR, Yehia AM, Helmy AH, Youssef NF.
Application of normal fluoresence and stability-indicating derivative synchronous fluoresence spectroscopy for the determination of gliquidone in presence of its fluorescent
alkaline degradation product. Spectrochim Acta A Mol Biomol
Spectrosc. 2018;188:619-25.
Food and Drug Administration. FDA. Guidance for industry: analytical procedures and methods validation: chemistry manufacturing, and controls documentation, draft guidance.
Silver Spring, MD: Food and Drug Administration; 2000.
Görög S. Identification and determination of impurities in drugs.
2nd ed. Amsterdam: Elsevier Science Publishing; 2000.
Guo P, Li ZW, Chen CH, Deng SP, Tang SG.Direct injection of
plasma to determine gliquidone in plasma using HPLC column
switching technique. Yao Xue Xue Bao. 1992;27(6):452-5.
International Conference on Harmonization. ICH. Technical
requirements for registration of pharmaceuticals for human use: stability testing of new drug substance and products Q1A (R2). Geneva; 2003a.
International Conference on HarmonizatioN. ICH. Technical
requirments for registration of pharmaceuticals for human use: validation of analytical procedures-test and methodology Q2 (R1). Geneva; 2003b.
Maurer HH, Kratzsch C, Kraemer T, Peters FT, Weber AA.
Screening, library-assisted identification and validated quantification of oral antidiabetics of the sulfonylurea-type in plasma by atmospheric pressure chemical ionization liquid chromatography-mass spectrometry. J Chromatogr B Analyt
Technol Biomed Life Sci. 2002;773(1):63-73.
Sridevi S, Diwan PV.Validated HPLC method for the detrmination of gliquidone in rate plasma. Pharm Pharmacol Comm. 2000;6:303-7.
Torrinomedica. Glurenor. Available from: http://www.
torrinomedica.it/farmaci/schedetecniche/Glurenor.asp#SP13. 2015.[cited 2015 Dec 23].
United States Pharmacopeia. USP 1; 2016. p. 459.
Variyar PS, Chattyie S, Sharma A. Fundamentals and theory
of HPTLC-based separation. In: Srivastava M, editor. High Performance Thin-Layer Chromatography (HPTLC). Berlin
Heidelberd: Springer-Verlag; 2011. p. 27-40.
Received for publication on 01st December 2016