*Correspondence: Panikumar Anumolu Durga. Gokaraju Rangaraju College of Pharmacy, Department of Pharmaceutical Analysis, 500090 - Hyderabad - Andhra Pradesh, India. E-mail: [email protected]
A
vol. 50, n. 4, oct./dec., 2014 http://dx.doi.org/10.1590/S1984-82502014000400025
Quantification and stress degradation studies of cefepime/
tazobactam in dry injection form by an RP-HPLC method
Ramakrishna Kommana, Gouthami Kannabattula, Sunitha Gurrala, Venkat Raj Yeradesi,
Panikumar Anumolu Durga
*Gokaraju Rangaraju College of Pharmacy, Osmania University, Hyderabad, Andhra Pradesh, India
A simple, speciic, precise, accurate, linear, rapid, economic and validated stability indicating an RP-HPLC method for the simultaneous quantiication of cefepime and tazobactam in a dry injection dosage form has been developed. Separation was performed on a 5 µm ACE C18 column with phosphatebuffer, pH adjusted to 4.5 with phosphoric acid: methanol (70:30) at a low rate of 1 mL/min and at a temperature of 25 °C. Regression analysis showed linearity at a detector wavelength of 290 nm in the range of 200-600 μg/mL for cefepime and 25-75 μg/mL for tazobactam. All of the analytes were adequately resolved with acceptable tailing. The percentage content found for cefepime was 99.98% and of tazobactam was 99.49% in the parenteral formulation. The method was validated in terms of linearity, precision, accuracy, speciicity, robustness and system suitability according to ICH guidelines. Stress degradation studies were performed on the placebo and drug products, drugs of interest were well resolved from the degradation products. The developed method was effectively applied for the simultaneous quantiication of cefepime and tazobactam in a dry injection formulation.
Uniterms: High performance liquid chromatography/quantitative analysis. Cefepime/quantiicação.
Tazobactam/quantiicação. Dry injection formulation/quantitative analysis. Pharmaceutical formulations/
degradation studies.
Desenvolveu-se método especíico, preciso, exato, linear, rápido e econômico, de validação de estabilidade, indicando o método de CLAE-FR para a quantiicação simultânea de cefepima e tazobactam na forma de dosagem injetável seca. A separação foi realizada em coluna C18 de ACE 5 mM com tampão fosfato, pH ajustado para 4,5 com ácido fosfórico:metanol (70:30), em luxo de 1 mL/min e temperatura de 25 °C. A análise de regressão mostrou linearidade no detector de comprimento de onda de 290 nm, na faixa de 200-600 μg/mL, para cefepima, e 25-75 μg/mL, para tazobactam. Todos os analitos foram, adequadamente, resolvidos com cauda aceitável. O teor percentual encontrado na formulação parenteral foi de 99,98%, para cefepima, e de 99,49%, para o tazobactam. O método foi validado em termos de linearidade, precisão, exatidão, especiicidade, robustez e adequação do sistema de acordo com as diretrizes ICH. Estudos de degradação por estresse foram realizados no grupo placebo e nos medicamentos e os fármacos de interesse foram bem resolvidos a partir dos produtos de degradação. O método desenvolvido foi efetivamente aplicado para quantiicação simultânea de cefepima e tazobactam na formulação injetável seca.
Uniterms: CLAE-FR. Cromatograia líquida de alta eiciência/fase reversa/análise quantitativa. Cefepima/
quantiicação. Tazobactam/quantiicação. Formulação injetável seca/análise quantitativa. Formulações
INTRODUCTION
ICH and WHO recommend that analysis of pharmaceutical inished products during stability testing should be conducted using a validated stability-indicating method. In this study, ICH and WHO recommendations were therefore kept in mind for the simultaneous estimation of cefepime (CEF) and tazobactam (TAZ).
CEF is a fourth-generation, semi-synthetic, broad spectrum, cephalosporin. Chemically, it is 1-[[(6R,7R
)- 7-[2-(2-amino-4-thiazolyl)-glyoxylamido]-2-carboxy-8- oxo-5-thia-1-azabicyclo[4.2.0]oct-2-en-3-yl]methyl]-1-methylpyrrolidinium chloride, 72-(Z)-(O-methyloxime),
monohydrochloride, monohydrate (Figure 1). It is used in the treatment of moderate-to-severe infections, such as
pneumonia, uncomplicated urinary tract infections, skin and soft tissue infections, intra-abdominal infections and febrile neutropenia.
TAZ is semi-synthetic parenteral penicillin. It is a β-lactamase inhibitor with a broad spectrum of antibacterial activity against most gram positive, gram negative aerobic and anaerobic bacteria (Ghafur, Ashwini, Priyadarshini,
2012.). Chemically, it is known as (2S,3S,5R
)-3-methyl-7-oxo-3-(1H-1,2,3-triazol-1-ylmethyl)-4-thia-1-azabicyclo
[3.2.0] heptane-2-carboxylic acid 4, 4-dioxide (Figure 2). An extensive literature search was carried out on analytical methods that were developed to estimate the combination of CEF and TAZ. The literature survey revealed that several spectrophotometric methods had been reported for the determination of CEF alone as well as for stability and degradation studies (Singh, 2013; Moreno, Salgado, 2012; Chahana, Harsha, Chhaganbhai, 2013). CEF in combination with other drugs can be estimated using numerous liquid chromatography methods (Palacios
et al., 2005; Nanda et al., 2012; Pedroso, Salgado, 2014).
TAZ was also successfully determined by HPLC methods. However, there is no RP-HPLC method available for stability indicating the validated simultaneous quantification of CEF and TAZ in combination so far. Hence, this research work was carried out with the objective of developing a simple RP-HPLC method for the simultaneous quantiication of CEF and TAZ in bulk as well as in a dry injection formulation and its application
to stress degradation studies.
MATERIAL AND METHODS
Instruments
The HPLC system consisted of a Waters E2695 with EMPOWER software, a POLMAN pH meter, model
FIGURE 1- Chemical structure of CEF.
FIGURE 2 - Chemical structure of TAZ.
LP139SA, and a Sartorius analytical Balance, model BSA224S-CW.
Chemical reagents
Methanol was of HPLC grade, while all other
chemicals and reagents, including orthophosphoric acid, potassium dihydrogen phosphate, and hydrochloric acid,
were of analytical reagent grade and were supplied by Merck. Double-distilled water and milli-Q water was used for all of the experiments, as appropriate. Filtration of the mobile phase was performed using 0.45 mm nylon filters (Millipore, USA). CEF and TAZ drug samples were gifted by Aurobindo Pharma Pvt. Ltd. (Hyderabad, India).
Preparation of standard solutions
Standard stock solutions of the two drugs were prepared by accurately weighing 40 mg CEF and 5 mg TAZ and then dissolving this in a few mL of methanol. The volume of this solution was then made up to 100 mL with the mobile phase. The stock solution was diluted with mobile phase to obtain inal concentrations equal to 400 μg/mL CEF and 5 μg/mL TAZ. The solution was iltered using a nylon ilter before analysis.
Preparation of sample solution
sterile water to a volume of 10 mL. From this, 2 mL was transferred into a 100 mL volumetric lask and diluted up to the mark with mobile phase to obtain a concentration equal to 2000 μg/mL of CEF and 250 μg/mL of TAZ. The above solution was further diluted with mobile phase to obtain inal concentrations within the linearity range to quantify them using the proposed RP-HPLC method.
Method validation
The proposed method was validated as per ICH guidelines for the following parameters: linearity and
range, precision, accuracy, specificity, ruggedness,
robustness, limit of detection (LOD), limit of quantitation (LOQ), system suitability and forced degradation studies.
Linearity
Appropriate aliquots of standard stock solution
were diluted with diluent to obtain inal concentrations of CEF and TAZ in the range of 200-600 μg/mL and 25-75 μg/mL, respectively. A 10 μL aliquot of each sample was injected six times for each concentration level and a calibration curve was constructed by plotting the average peak area versus the drug concentration.
Precision
Precision was checked for both the system and the developed method. The system precision was checked using standard CEF and TAZ solutions. The retention time and area of ten determinations were measured and the RSD (Relative Standard Deviation) was calculated. A homogenous sample of a single batch was analysed six times to determine the precision of the developed method. Percentage assay values and the RSD of the assay were
calculated.
Accuracy
The accuracy of an analytical method is the
closeness of test results obtained by that method to
the true value. Accuracy of the proposed method was ascertained on the basis of a recovery study performed using the standard addition method. Accuracy was performed at three different levels for CEF and TAZ. A known quantity of CEF and TAZ standard was spiked at 50%, 100% and 150% levels into the placebo. Analyses of samples were performed in triplicate for each level. The percentage recovery was calculated from the
obtained results.
Specificity
The analytes should show no interference from other extraneous components and should be well resolved from them. Speciicity is the procedure used to detect the analytes quantitatively in the presence of a component that may be expected to be present in the sample matrix.
Robustness
As deined by the ICH, the robustness of an analytical
procedure refers to its capability to remain unaffected by
small and deliberate variations in method parameters. The robustness was studied by evaluating the effect of small but deliberate variations in the chromatographic conditions. Different parameters that were altered to evaluate robustness of the method included low rate by ±0.2 mL/min, temperature by ± 5 °C and mobile phase
composition.
Forced degradation studies
To determine whether the analytical method was able to indicate stability, a CEF and TAZ formulation was stressed under various conditions to conduct forced degradation studies. Intentional degradation was attempted in stress conditions of acidic (0.1 N HCl), basic (0.1 N NaOH), neutral (water), oxidative degradation (1% H2O2)
and thermal treatment (heated at 80 °C to evaluate the ability of the proposed method to separate CEF and TAZ from its degradation products). The test preparation was subjected to acid stress degradation by treating 5 mL of sample with 5 mL of 0.1 N HCL. The contents were mixed well and constantly stirred for 30 min and then neutralised with 5 mL of 0.1 N NaOH. Then, it was diluted as per the test procedure and injected into the HPLC system. Similarly, alkali (NaOH), peroxide degradation (H2O2),
neutral degradation (60 °C for 60 min) and thermal degradation (80 °C for 30 min) tests were carried out.
RESULTS AND DISCUSSION
For the method development, several trials were
carried out and the final optimised chromatographic
conditions for the separation and quantiication of CEF and TAZ in the bulk and dry injection formulation were reported. Preliminary studies involved using an ACE
C18 column, with a 5 µm size of the packing material,
and several mobile phase compositions for the effective separation of these two drugs. Using the ACE C18 Column,
(70:30) by isocratic elution at a low rate of 1 mL/min and a detection wavelength of 290nm with injection volume of 10 µL at 25 °C afforded the best separation of these analytes. The chromatogram of the optimised method is shown in Figure 3. The system suitability parameters are shown in Table I.
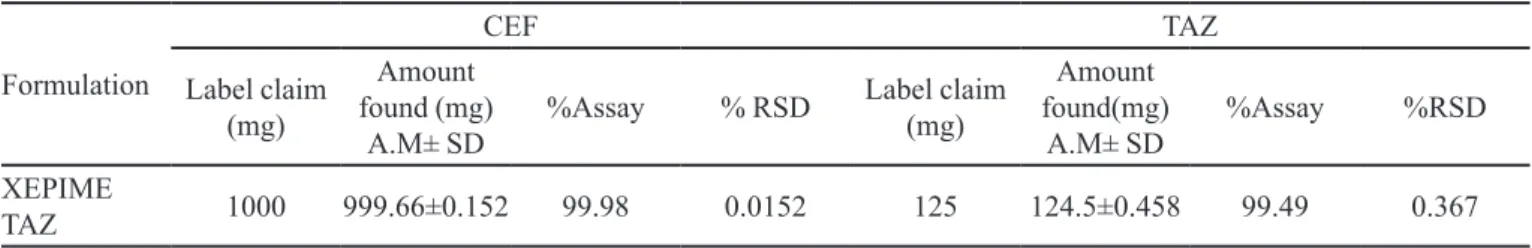
From the results of the assay study, the content of CEF was found to be 999 mg/mL (label claim percentage was 99.98%) while TAZ was 124.5 mg/mL (label claim percentage was 99.49%) (Table II).
Linearity
Linear calibration plots for the proposed method were obtained in concentration ranges of 200-600 μg/mL for CEF and 25-75 μg/mL TAZ. The linear regression equation for CEF was y=15625x-5844, with a correlation
coefficient of 0.999 (Figure 4), and for TAZ it was y=82449x-9735, with a correlation coeficient of 0.999 (Figure 5).
Accuracy
The accuracy of the method was determined by the standard addition method. Three levels of solutions (50, 100 and 150%) of the nominal analytical concentrations were prepared. Percentage recoveries along with standard deviations and relative standard deviations for each analyte (n=6) are given in Table III. Recovery studies showed the method to be highly accurate and suitable for
the intended use.
FIGURE 3 - Chromatogram obtained after optimisation.
TABLE I - Results of system suitability parameters
Sample Retention
time Area
USP resolution
USP
Tailing countPlate
CEF 1.477 6286610 1.480 3671
TAZ 2.616 4169897 7.225 1.442 4969
TABLE II - Assay of CEF and TAZ in formulation
Formulation
CEF TAZ
Label claim (mg)
Amount found (mg)
A.M± SD %Assay % RSD
Label claim (mg)
Amount found(mg)
A.M± SD %Assay %RSD
XEPIME
TAZ 1000 999.66±0.152 99.98 0.0152 125 124.5±0.458 99.49 0.367
FIGURE 4 - Linearity plot of CEF.
TABLE III - Accuracy of the proposed HPLC method
Amount of test solution
Recovery
level (%) Recovery of analyte
Amount of std added Theoretical content (µg/mL) Amount found(µg/mL)
A.M± SD (n=3) Recovery (%) % RSD
400 µg/ m L CE F 50 µg/ m L TA Z
0 CEF 0 400 398.47±1.917 99.61 0.481
TAZ 0 50 49.59 ±0.002 99.18 0.041
50 CEF 200 600 599.95±0.630 99.91 0.105
TAZ 25 75 74.67±0.110 99.99 0.147
100 CEF 400 800 798.64±0.076 99.92 0.001
TAZ 50 100 99.63±0.574 99.63 0.576
150 CEF 600 1000 998.43 ±0.165 99.48 0.016
TAZ 75 125 124.46±0.450 99.57 0.362
Precision
The system and the developed method produced satisfactory precision results. The replicate estimation
of a dry injection formulation analysed by the proposed method yielded quite consistent results, indicating the
repeatability of the method. The study showed %R.S.D.<2 for both CEF and TAZ (Table IV).
Limit of detection and limit of quantification
The Limit of detection (LOD) and Limit of Quantiication (LOQ) were determined by making different solutions with decreasing concentrations of analytes. LOD was found to be 0.475 μg/mL and 0.148 μg/mL for CEF and TAZ, respectively (S/N ratio 3:1). LOQ was found to be 1.585 μg/mL and 0.494 μg/mL for CEF and TAZ, respectively (S/N ratio 10:1).
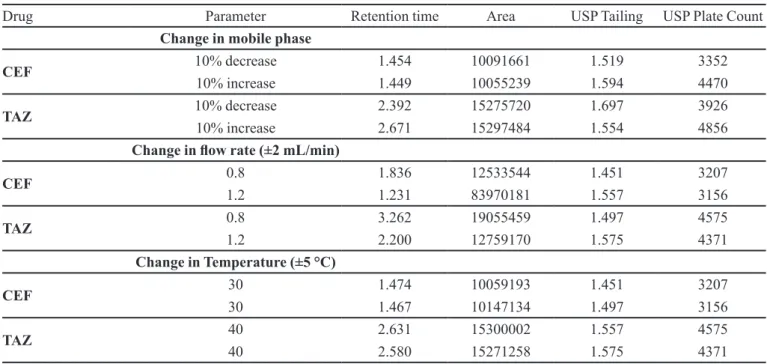
Robustness
Robustness of the method was performed by slightly varying the chromatographic conditions. The results showed a negligible effect on the chromatographic parameters by slight variations in chromatographic conditions with respect to mobile phase, temperature and low rate. Results are presented in Table V.
Stress degradation studies
All of the stress conditions applied were capable of degrading both of the drugs. The degradation data are shown in Table VI; it was shown that CEF degradation was more eficient in acidic than other stress conditions and TAZ degradation was lower in all of the stress conditions. The drugs of interest peaks were well separated from the degradation product peaks and the resolution was found to be more than 2. Hence, the developed RP-HPLC method has the ability to quantify CEF and TAZ in the presence
of degradation products.
CONCLUSION
There is currently no RP-HPLC method that is capable of the simultaneous estimation of CEF and TAZ
in the injection dosage form. Also, no stress degradation
studies have been performed for this combination. The developed method was simple, rapid, precise, accurate
and economical, and can be employed for the routine
estimation of CEF and TAZ in injection dosage. All of the validation parameters were found to be highly acceptable indicators for speciicity, linearity and range, accuracy, precision, ruggedness, LOD, LOQ and robustness. The stress degradation studies of CEF and TAZ were checked by the proposed method and the degradation peaks were
TABLE IV - Results of method precision of CEF and TAZ
Injection no. CEF TAZ Retention Time (min ) Peak Area Retention Time (min ) Peak Area
1 1.480 6264001 2.638 4139862
2 1.480 6266419 2.637 4132529
3 1.481 6269715 2.638 4131457
4 1.479 6262821 2.637 4137014
5 1.481 6267552 2.640 4136180
6 1.480 6266298 2.640 4133972
Mean 6266134 4135169
SD 2468.5 3118.70
well separated from the sample peaks. The developed method was successfully applied for the simultaneous quantification of CEF and TAZ in a dry injection
formulation.
ACKNOWLEDGEMENT
The authors would like to thank Dr CVS Subrahmanyam, Principal of Gokaraju Rangaraju College, for support with the instrumentation, and Aurobindo Labs
for their gifted samples.
REFERENCES
CHAHANA, A.P.; HARSHA, U.P.; CHHAGANBHAI, C.P. Estimation of cefepime hydrochloride in an injectable dosage form by difference spectrophotometry. J. Global Pharma Technol., v.5, p.6-8, 2013.
TABLE V - Robustness study results of CEF and TAZ
Drug Parameter Retention time Area USP Tailing USP Plate Count
Change in mobile phase
CEF 10% decrease 1.454 10091661 1.519 3352
10% increase 1.449 10055239 1.594 4470
TAZ 10% decrease 2.392 15275720 1.697 3926
10% increase 2.671 15297484 1.554 4856
Change in low rate (±2 mL/min)
CEF 0.8 1.836 12533544 1.451 3207
1.2 1.231 83970181 1.557 3156
TAZ 0.8 3.262 19055459 1.497 4575
1.2 2.200 12759170 1.575 4371
Change in Temperature (±5 °C)
CEF 30 1.474 10059193 1.451 3207
30 1.467 10147134 1.497 3156
TAZ 40 2.631 15300002 1.557 4575
40 2.580 15271258 1.575 4371
TABLE VI - Results of forced degradation studies
Nature of stress %Assay CEF %Assay TAZ %Net degradation CEF %Net degradation TAZ
Neutral 98 92 1.98 4.83
Acid 73 97 27.40 2.18
Base 96 94 3.59 4.72
Peroxide 83 96 16.56 3.21
Thermal 87 97 12.65 2.17
GHAFUR, A.; ASHWINI, T.; PRIYADARSHINI, K. Clinical proile of patients treated with cefepime/tazobactam a new ß-lactam/ ß-lactamage inhibitor combination. J. Micr. Infect. Dis., v.2, p.79-85, 2012.
INTERNATIONAL CONFERENCE ON HARMONISATION. ICH. Harmonised tripartite guideline. Validation of analytical procedures: text and methodology Q2B. Geneva: ICH Expert Working Group, 1996. 13 p.
PALACIOS, F.J.J.; MOCHON, M.C.; SANCHEZ, J.C.J.; BELLO LOPEZ, M.A.; PEREZ, A.G. Validation of an HPLC method for determination of cefepime in human serum, cerebrospinal fluid, and urine. Pharmacokinetic proiles. Chromatographia, v.62, p.355-361, 2005.
MORENO, A.H.; SALGADO, H.R.N. Comparison of high performance liquid chromatography and three titrimetric methods for the determination of ceftazidime in
pharmaceutical formulations. Adv. Anal. Chem., v.2, n.3,
p.6-13, 2012.
SINGH, S.; MOHD, R.; RAJ, V.; KUMAR, A. Newer method to estimate cefepime in bulk and pharmaceutical formulation by ultraviolet spectroscopy. Int. J. Pharm. Life Sci., v.1, p.149-158, 2013.
PEDROSO, T.M.; SALGADO, H.R.N. Validation of analytical methodology for quantification of cefazolin sodium by
liquid chromatography. Braz. J. Pharm. Sci., v.50,
p.213-223, 2014.