Article
0103 - 5053 $6.00+0.00
*e-mail: [email protected]
Stability Indicating Square-Wave Stripping Voltammetric Method for
Determination of Gatiloxacin in Pharmaceutical Formulation and Human Blood
Hanaa Salah El-Desoky
Analytical & Electrochemistry Research Unit, Department of Chemistry, Faculty of Science, Tanta University, 31527-Tanta, Egypt
Um método de voltametria de re-dissolução catódica adsortiva de onda quadrada, indicativa de estabilidade, completamente validado, sensível e preciso foi desenvolvido para determinação de gatiloxacina na forma bruta, em formulações farmacêuticas e em amostras de plasma e soro humano. Os limites de detecção encontrados de gatiloxacina na forma bruta e no soro humano foram 1,5 × 10⁻⁹ e 2,2 × 10⁻⁹ mol L–1, respectivamente. O método descrito foi aplicado com
sucesso na determinação de gatiloxacina em formulações farmacêuticas e em amostras biológicas humanas sem extração prévia às análises. Interferências de excipientes comuns, de alguns íons de metais comuns, de espécies orgânicas, de fármacos co-administrados e de produtos de degradação induzida por ácido não foram signiicativos, durante a análise de gatiloxacina nas diversas amostras analisadas. Além disso, parâmetros farmacocinéticos de gatiloxacina em plasma de voluntários saudáveis, após a administração de uma dose oral (400 mg de gatiloxacina) foram também estimados por meio do método voltamétrico de re-dissolução descrito.
A fully validated, sensitive and precise stability-indicating square-wave adsorptive cathodic stripping voltammetric method has been developed for determination of gatiloxacin in the bulk form, pharmaceutical formulation, and in spiked human serum and real plasma samples. The
achieved detection limits of gatiloxacin in the bulk form and human serum were 1.5 × 10⁻⁹ and
2.2 × 10⁻⁹ mol L–1, respectively. The described method was applied successfully for determination
of gatiloxacin in formulation and human biological samples without extraction prior to the analysis. No signiicant interferences from common excipients, some common metal ions, organic species, co-administrated drugs and from the acid-induced degradation products were obtained during analysis of gatiloxacin in the various analyzed samples. Besides, pharmacokinetic parameters of gatiloxacin in plasma of healthy volunteers following the administration of an oral single dose (400 mg gatiloxacin) were also estimated by means of the described stripping voltammetric method.
Keywords: gatiloxacin, tequin tablets, human blood, stripping voltammetry,pharmacokinetic parameters
Introduction
Gatiloxacin (1-cyclopropyl-6-luoro-1, 4-dihydro-8-methoxy-7-[3-methyl-1-piperazinyl]-4-oxo-3-quinoline carboxylic acid), (Scheme 1), is a synthetic broad-spectrum antimicrobial luoroquinolone. It is active against both gram-negative and gram-positive bacteria and used in the treatment of a wide range of infections.1,2 Its absolute
bioavailability is 96%, with mean peak plasma concentration of 3.1 to 3.6 µg mL-1 usually occurring within 1.0 to 2.0 h
after administration of an oral single dosing of a 400 mg gatiloxacin.2-4 It undergoes limited biotransformation
in humans with less than 1% of the dose excreted in the
urine as ethylenediamine and methylethylenediamine metabolites.2
Various instrumental analytical methods have been described for assay of gatiloxacin in bulk form, pharmaceutical formulation and biological luids. These
include high-performance liquid chromatography,5-13
high-performance thin-layer chromatography,14-16
liquid chromatography,17,18 spectrofluorimetry,19-22
spectrophotometry,23-28 capillary electrophoresis,29-32
chemiluminescence,33,34 voltammetry at a carbon paste
electrode,35-38 and atomic absorption spectrometry.39-41 Most
of the reported methods for assay of gatiloxacin necessitate samples pretreatment and time-consuming extraction steps prior to the analysis and required expensive equipment and considerable skills are necessary to operate them successfully. To date no square-wave adsorptive cathodic stripping voltammetric method is reported in the literature for determination of gatiloxacin.
So, the aim of the present work was to develop a fully validated stability-indicating square-wave adsorptive cathodic stripping voltammetic method for determination of gatiloxacin in pharmaceutical formulation and human blood without extraction prior to the analysis and without signiicant interferences from inorganic and organic species.
Experimental
Instruments
Computer-controlled Electrochemical Analyzers
Models 263A and 394-PAR (Princeton Applied Research,
Oak Ridge, TN, USA) with the software package 270/250-PAR were used for the voltammetric measurements. An electrode assembly (303A-PAR) incorporated with a micro-electrochemical cell and a three-electrode system comprising of a hanging mercury drop electrode (HMDE) as a working electrode (surface area = 0.026 cm2), an
Ag/AgCl/KCls reference electrode and a platinum wire auxiliary electrode, was used. A magnetic stirrer (305-PAR) and a stirring bar were used to provide the convective transport during the accumulation step.
Materials and solutions
(i) A stock standard solution of 1.0 × 10⁻³ mol L–1 bulk
gatiloxacin (Bristol-Myers Squibb Company, New York-Cairo) was prepared in ethanol (Merck), and then stored at 4 oC. Working solutions of gatiloxacin (1.0 × 10⁻⁶ to
1.0 × 10⁻⁴ mol L-1) were prepared daily by appropriate
dilution with ethanol just before use. (ii) Ten tequin® tablets
(Bristol-Myers Squibb Company, New York-Cairo) labeled to contain 400 mg gatiloxacin per tablet were quantitatively weighed and the average mass per tablet was determined. The tablets were then grounded in a mortar to a homogeneous fine powder. A quantity of this powder equivalent to the weight of one tablet was accurately transferred into a 100.0 mL volume calibrated flask containing 70 mL ethanol (Merck). The content of the lask was
sonicated for about 10 min and then illed up with ethanol. The solution was then iltered through a 0.45 µm Milli-pore ilter (Gelman, Germany). The desired concentrations of the gatiloxacin were obtained by accurate dilution with ethanol. (iii) Serum sample of a healthy volunteer was stored frozen until assay. A 1.0 mL volume of the human serum was transferred to each of 10 centrifugation tubes (3.0 mL volume polypropylene micro-centrifuge tubes), containing a certain concentration of gatiloxacin (1.0 × 10⁻⁶
to 1.0 ×10⁻⁴ mol L-1), and, then, mixed well with 1.0 mL of
ethanol to denature and precipitate proteins. The solutions were centrifuged (using an Eppendorf centrifuge 5417C, Hamburg, Germany) for 3 min at 14000 rpm to separate out the precipitated proteins. The clear supernatant layers of the solutions were ilteredthrough 0.45 µm Milli-pore ilters to produce protein-free human serum samples spiked with various concentrations of gatiloxacin (1.0 ×10⁻⁶ to
1.0 ×10⁻⁴ mol L-1). (iv) A series of Britton-Robinson (B-R)
universal buffers of pH 2.0 to 11.5 as supporting electrolytes was prepared. A pH-meter (Crison, Barcelona, Spain) was used for the pH measurements. Deionized water was supplied from a Purite-Still Plus de-ionizer connected to an AquaMatic double-distillation water system (Hamilton Laboratory Glass LTD, Kent, UK). All the chemicals used were of analytical-grade reagents.
Induced degradation of gatiloxacin
10.0 mL of HCl solution (5.0 mol L-1) or 10.0 mL of
NaOH solution (5.0 mol L-1) were mixed with 10.0 mL
of ethanolic gatiloxacin solution (2.5 × 10⁻³ mol L-1), and
then subjected to forced degradation by reluxing in the dark in two-necked round-bottomed lask (50 mL volume) for 8 h. At adequate time intervals, certain volume of each of the reluxed solutions was withdrawn with micro-pipette to a glass tube and immediately cooled in ice path then diluted with ethanol to give a inal concentration of 1.0 × 10⁻⁴ mol L-1 gatifloxacin. A known volume
(50.0 µL) of each of these solutions was introduced into a 10.0 mL volume calibrated lask then illed up with a B-R universal buffer of pH 7 to give a inal concentration of 5.0 × 10⁻⁷ mol L-1 gatiloxacin (Final pH was adjusted
to pH 7 with 0.01 mol L-1 NaOH or 0.01 mol L-1 HCl).
Recoveries based on three replicate measurements of gatiloxacin in each treated sample were estimated by means of the described SW-AdCS voltammetric method.
Pharmacokinetic studies
their written informed consent prior to anticipating in the study at RamadanSpecializedHospital (Tanta City, Egypt). They were caffeine and alcohol free and avoided all medication for at least 24 h before and during study. Each volunteer received an oral single dose of tequin® tablet (400 mg gatiloxacin). A venous blood sample (1.0 mL each) was obtained immediately before drug administration to serve as a blank (baseline) and then the sampling was continued at 0.5, 1, 1.5, 2, 3, 4, 6, 8, 12 and 24 h after the administration of the oral dose. The blood samples were centrifuged immediately at 2000 rpm for 10 min and the plasma fractions were rapidly separated and stored in coded polypropylene tubes at –20 °C until assayed. Following precipitation of proteins by ethanol and then separation by centrifugation, the plasma samples were analyzed using the described voltammetric method.
Results and Discussion
Cyclic voltammetric studies
Cyclic voltammograms of 1.0 ×10⁻⁴ mol L-1 gatiloxacin
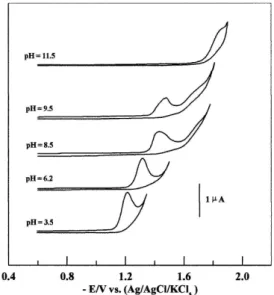
recorded at the HMDE in the Britton-Robinson (B-R) universal buffer of pH values 3.5 to 8 exhibited a single 2-electron irreversible cathodic peak. Its peak current decreased gradually upon the increase of pH of the medium until its disappearence at pH > 10, while a second ill-deined cathodic peak appeared at more negative potentials, in solutions of pH values ≥ 8.5, Figure 1. This behavior may be attributed to the reduction of the C=O double bond of reactant species in the acidic and basic solutions. No peaks were observed in the anodic scan; pointing to the irreversible nature of the reduction process. The 2nd cathodic
peak (pH ≥ 8.5) was ill-deined due to its overlapping with
that of the supporting electrolyte; therefore it can not be used for any subsequent studies.
As shown in Figure 1, the ip versus pH plot of the 1st peak
(pH < 9) is a Z-shaped curve (recalls a dissociation curve) indicating the presence of an acid-base equilibrium in the reduction of gatiloxacin.22 The pH value corresponding to the
half- height of the ipversus pH plot or to the peak of δip / δpH versus pH plot of the 1st peak (Figure 2) was found to be 6.2. This value (pH = pKa = 6.2) agrees well with those reported in the literature for pKa1 of gatiloxacin and different luoroquinolones (6.19 and 6.03)22,31 which is due to dissociation of their carboxylic
group. On the other hand, the peak potential Ep of the 1st
peak shifted to more negative values with the increase of pH, denoting that protons are involved in the electrode reaction process and the proton-transfer reaction precedes the electron transfer process.42 As shown in Figure 3, E
p versus pH plot
of the 1st peak (pH < 9) exhibited two segments intersected
at pH 6.2 which can be considered again to equal the irst equilibrium constantof gatiloxacin.22,31
Figure 1. Cyclic voltammograms of 1.0×10⁻⁴ mol L-1 gatiloxacin solution
in B-R universal buffer of different pH at a scan rate of 100 mVs-1.
Figure 2. Plots of ipversus pH (curve a) and δip / δpH versus pH(curve b) of 1.0×10⁻⁴ mol L-1 gatiloxacin in B-R universal buffer of various pH
values at a scan rate of 100 mVs-1.
Figure 3. Epversus pH of the medium for 1.0×10⁻⁴ mol L-1 gatiloxacin
Effect of the scan rate ν (20 to 500 mV s–1) on either
the peak potential (Ep) and peak current (ip) of the 1st peak
was examined at different pH values (pH < 9). The peak potentials (Ep) were linearly shifted to more negative values with the increase of scan rate (ν) conirming the irreversible nature of the reduction processes of gatiloxacin at HMDE.43
Linear Ep versus log ν plots44 of slope values of 52 to 66 mV
were obtained; from which values of αna (product of transfer coeficient α and number of electrons na transferred in the rate-determining step) were estimated and found to equal 1.14 to 0.89. Since, the number of electrons na, transferred in the rate-determining step of the electroreduction of the C=O double bond of the analyte equals 2 (na = 2)42 the transfer
coeficient α should be 0.57 to 0.45.
Linear Randles-Sevcik plots (ipversus ν) were obtained for the 1st peak at different pH values < 9 with slope values
5.9 to 6.5 µA V–1 s (r = 0.998 ± 0.002 and n = 5) indicating
that the reduction process of gatiloxacin at the HMDE is controlled by adsorption.45,46 This inding was conirmed by
the linear plots of log ip versus log ν, obtained for the 1st
peaks (pH < 9) with slope values of 0.78 to 0.92 µA mV–1 s;
( r = 0.999 ± 0.001, n = 5) which are close to the theoretical values of 1.0 expected for the electrode reaction of surface species.47
The interfacial adsorptive character of gatifloxacin onto the HMDE was identified by means of cyclic voltammetry in the B-R universal buffer. Figure 3 shows the cyclic voltammograms of 5.0 × 10⁻⁷ mol L-1 bulk
gatiloxacin recorded in a B-R universal buffer of pH 7 following preconcentration onto the HMDE by adsorptive accumulation at open circuit conditions (curve a), and then at –0.7 V for 60 s (1st cycle b and 2nd cycle c). A better
enhanced peak current magnitude was achieved following preconcentration of gatiloxacin by adsorptive accumulation onto the electrode surface (Figure 4, 1st cycle b) whereas the
2nd cycle exhibited a lower peak current magnitude (Figure 4,
2nd cycle c). This behavior indicated the interfacial adsorptive
character of gatiloxacin onto the mercury electrode surface. The electrode surface coverage Γ0 (amount of reactant adsorbed onto the mercury electrode surface, mol cm-2)
was calculated using the relation: Γ0 = Q / nFA, where Q is the amount of charge consumed by the surface process as calculated by the integration of the area under the peak of the cyclic voltammogram corrected for residual current, n is the total number of electrons consumed in the reduction process (n = 2) and A is the mercury electrode surface area (0.026 cm2). On dividing the
number of coulombs transferred 1.23 µC by the conversion factor nFA (5017.30 × 106 µC), a surface coverage of
2.45 × 10⁻¹⁰ mol cm-2 was estimated. Thus, each adsorbed
gatiloxacin molecule occupies an area of 0.68 nm2.
Stripping voltammetric studies
S q u a r e - wave a d s o r p t ive c a t h o d i c s t r i p p i n g voltammograms of 5.0 ×10⁻⁷ mol L-1 gatiloxacin recorded
following its preconcentration by adsorptive accumulation onto the HMDE at –0.5 V for 30 s exhibited a single irreversible cathodic peak in the B-R universal buffer of pH values < 8.5; a better developed and sharper peak was obtained at pH 7. Therefore a B-R universal buffer of pH 7 was used as a supporting electrolyte in the rest of the present analytical study. Effect of square-wave pulse parameters (frequency f (10 to 100 Hz), scan increment ∆Es (2 to 10 mV) and pulse-amplitude a (10 to 50 mV)) on the peak current magnitude of 5.0 ×10⁻⁷ mol L-1 gatiloxacin in a B-R
universal buffer of pH 7 following its preconcentration by adsorptive accumulation onto the HMDE at Eacc. = –0.5 V for 30 s was studied. A better developed peak current
magnitude was achieved at f = 80 Hz, ∆Es = 10 mV and
a = 25 mV.
On the other side, effect of accumulation potential (Eacc.) on the SW-AdCS voltammetric peak current magnitude of 5.0×10⁻⁷ mol L-1 gatiloxacin in a B-R universal buffer of
pH 7 was examined over the range 0.0 to – 1.1 V (vs. Ag/ AgCl/KCls) following its preconcentration by adsorptive accumulation onto the HMDE for 30 s. A better enhanced peak current magnitude was achieved over the potential range –0.5 to –0.9 V; hence, an accumulation potential of –0.7 V was chosen throughout the present study. Effect of preconcentration time (tacc.) at –0.7 V on the peak current magnitude for various concentrations of bulk gatiloxacin (5.0 ×10⁻⁷, 1.0 ×10⁻⁷ and 1.0 ×10⁻⁸ mol L-1) in a B-R universal
buffer of pH 7 was also evaluated. As shown in Figure 5, for 5.0 ×10⁻⁷, 1.0 ×10⁻⁷ and 1.0 ×10⁻⁸ mol L-1 gatiloxacin the Figure 4. Cyclic voltammograms of 5.0×10⁻⁷ mol L-1 bulk gatiloxacin
in a B-R universal buffer of pH 7.0 at a scan rate of 100 mVs-1 recorded
following preconcentration by adsorptive accumulation onto the HMDE at open circuit conditions (a) and then at Eacc. = – 0.7 V for 60 s (1st cycle
response was linear up to 40, 100 and 120 s, respectively. This means that the lower the concentration of the analyte, the longer of the accumulation duration is. Thus, the accumulation duration of choice will be dictated by the sensitivity needed. So, accumulation times of 100, 60 and 30 s were applied in the present work (Table 1).
To allow formation of a uniform distribution of the accumulated analyte onto the mercury surface, rest time was employed between the preconcentration and stripping steps. The inluence of the rest time of 5.0 and 10.0 s on reproducibility of the peak current was studied and a rest time period of 5.0 s was chosen for the present analytical study, since at which sharp and better enhanced peak current was obtained.
Accordingly, the optimum operational conditions of the described stripping voltammetric method for assay of gatiloxacin were: Eacc = –0.7 V, tacc≤ 120 s, f = 80 Hz, ∆Es = 10 mV, a = 25 mV and a B-R universal buffer of pH 7 as a supporting electrolyte.
Validation of the method
Validation of the described stripping voltammetric method for assay of bulk gatiloxacin was examined via evaluation of the linear dynamic range, limit of detection (LOD), limit of quantitation (LOQ), repeatability, reproducibility, precision, robustness and intermediate precision. Linear calibration plots over various concentration ranges of bulk gatiloxacin, at various accumulation durationswereobtained and the characteristics of these plots are reported in Table 1. Values of LOD and LOQ were estimated using the expression: k S.D./ b,48 where k = 3 for LOD and 10 for LOQ, S.D. is
the standard deviation of the blank (or theintercept of the calibration plot)and b is the slope of the calibration plot. The results reported in Table (1), indicated the reliability of the described SW-AdCS voltammetric method for the trace assay of bulk gatiloxacin.
The repeatability, reproducibility, precision and accuracy49 of analysis using the described stripping
voltammetric method were identified by performing four replicate measurements for each of 5.0 × 10⁻⁸ and
1.0 × 10⁻⁷ mol L-1 bulk gatifloxacin (t
acc. = 100 s and
Eacc. = –0.7 V) over one day (Intra- day assay) and for three successive days (Inter- day assay). Satisfactory mean percentage recoveries (%R) for intra- and inter-day precisions and accuracy were achieved (Table 2).
Table 1. Characteristics of the calibration curves of SW-AdCS voltammetric determination of bulk gatiloxacin in a B-R universal buffer of pH 7;
Eacc. = –0.7 V, f = 80 Hz, ∆Es = 10 mV and a = 25 mV, at 25 oC
tacc /s Linearity range / (mol L-1)
Regression equation ip (µA) = bC (µmol L-1) + a
(r) LOD /
(mol L-1)
LOQ / (mol L-1)
30 60 100
3.0×10⁻⁸− 7.0×10⁻⁷
1.0×10⁻⁸− 4.0×10⁻⁷
5.0×10⁻⁹− 3.0×10⁻⁷
ip = 2.260 C + 0.151 ip = 3.506 C + 0.155 ip = 4.256 C + 0.175
0.996 0.993 0.999
9.0×10⁻⁹
3.0×10⁻⁹
1.5×10⁻⁹
3.0×10⁻⁸
1.0×10⁻⁸
5.0×10⁻⁹
Table 2. Analytical precision and accuracy of bulk gatiloxacin determination by the described SW-AdCSvoltammetric method (n = 4) in a B-R universal buffer of pH 7; tacc = 100 s
CTaken / (mol L-1) C
Found / (mol L
-1) % R S.D. Accuracy (RE%) Precision (RSD%)
Intra-day
5.0 × 10⁻⁸
1.0 × 10⁻⁷
5.01 ×10⁻⁸
9.97 ×10⁻⁶
100.20 99.70
0.017 0.005
0.20 – 0.30
0.34 0.50
Inter-day
5.0 × 10⁻⁸
1.0 × 10⁻⁷
5.02 ×10⁻⁸
9.82 ×10⁻⁶
100.40 98.20
0.014 0.006
0.40 – 1.80
0.28 0.61
Figure 5. Effect of accumulation time (tacc.) on the SW-AdCS voltammetric peak current magnitude for: (a) 5.0×10⁻⁷ mol L-1, (b) 1.0 ×10⁻⁷ mol L-1
and (c) 1.0×10⁻⁸ mol L-1 gatiloxacin in a B-R universal buffer of pH 7;
No signiicant differences were observed between the amounts taken and found of gatiloxacin which indicated thereproducibility, precision andaccuracy of the described voltammetric method for assay of gatiloxacin.
For the study of the interference from excipients usually present in gatiloxacin formulation, 1.0 × 10⁻⁷ mol L-1
standard bulk gatiloxacin solution and then a standard solution of tequin® tablets containing 1.0 ×10⁻⁷ mol L-1
gatiloxacin were analyzed following preconcentration by adsorptive accumulation onto the HMDE at –0.7 V for 100 s in both cases. No signiicant differences in percentage recoveries or the relative standard deviations achieved in the absence (99.88 ± 0.94) and in the presence (99.59 ± 1.06) of excipients. Thus, no signiicant interference from the excipients to the assay of gatiloxacin was observed by the described electroanalytical method.
Since the robustness49 of results of an analytical
method is the ability to remain unaffected with some limited changes of the operational conditions, analysis of 1.0 × 10⁻⁷ mol L-1 bulk gatifloxacin by means of the
described method was carried out under various conditions (pH 7 to 7.5, accumulation potential = –0.5 to –0.7 V, and accumulation duration = 90 to 100 s). The obtained mean percentage recoveries (99.88 ± 0.94 to 98.45 ± 0.88) were insignificantly affected within the studied conditions, and consequently the described SW-AdCS voltammetric method was reliable for assay of bulk gatiloxacin and it could be considered robust.49
The inter-laboratory precision of the measurements using the described method was examined by assay of 1.0 × 10⁻⁷ mol L–1 gatiloxacin using two PAR- Potentiostats-
Models 263A, Lab. (1) and 394, Lab. (2) under the same operational conditions at different elapsed times by two different analysts. The mean percentage recoveries obtained due to Lab. 1 (99.88 ± 0.94) to Lab. 2 (98.50 ± 0.88) and even day to day (99.10 ± 0.25 to 98.42 ± 0.65) were found reproducible, since there is no signiicant difference between the recoveries or relative standard deviations.
Acid- induced degradation studies
Stability testing has emerged in the field of pharmaceuticals as being very important to maintain the eficacy of a drug, as it provides measurements of the storage capacity of a drug, as well as demonstrates the safety of the drug products. Also, stability testing is a requirement for the regulatory approval during product marketing, and is a vital component of the overall quality control program. The International
Conference on Harmonization (ICH) guideline entitled50
‘Stability testing of new drug substances and products’
requires that stress testing be carried out to elucidate the inherent stability characteristics of the active substance. Susceptibility hydrolysis of analyte under acidic or basic conditions is one of the most required tests. An ideal stability-indicating method is one that quantiies the standard drug alone and also resolves its degradation products. Therefore, it was thought necessary to develop a simple and accurate stability-indicating method for the determination of gatiloxacin in the presence of its degradation products.
SW-AdCS voltammogram of 5.0 × 10⁻⁷ mol L-1 of the
gatiloxacin solution treated for different time intervals with 2.5 mol L-1 HCl for 8 h (as described in the experimental
section), recorded at the HMDE in a B-R universal buffer of pH 7 showed a new less intense cathodic peak at less negative potential (Ep = –1.20 V) in addition to the mean cathodic peak of gatiloxacin (Ep = –1.45 V), Figure 6. The peak current magnitude of the mean cathodic peak (2nd peak) showed a gradual decrease with time (t)
of degradation, while that of the new peak(1st peak)
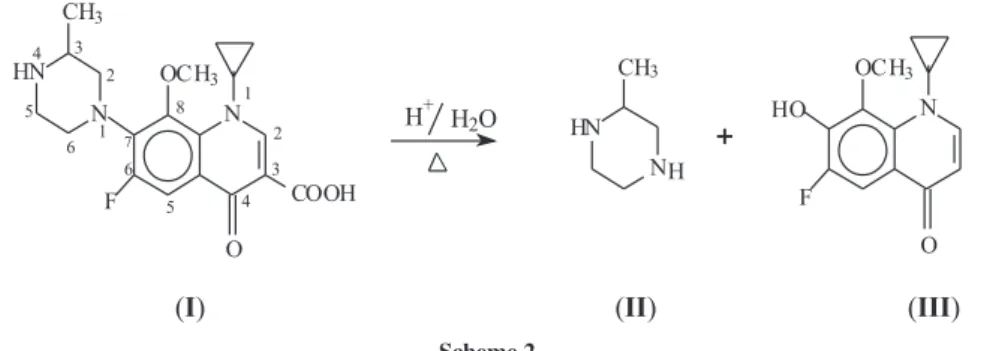
increased in the same direction. This behavior indicated that gatiloxacin undergoes signiicant degradation under forced acidic conditions. A suggested degradation reaction is shown in Scheme 2 which is based on the hydrolysis of gatiloxacin through the cleavage of the C7-N1 bond51 and
decarboxylation at C3-COOH bond52 that resulted in two
products of degradation (II and III).
The suggested sites of degradation were conirmed by the AM1 semi-empirical molecular orbital calculations of the bond orders throughout gatiloxacin molecule. The calculations revealed that the weakest bond orders within the gatiloxacin molecule are C7-N1 (0.9941) and
C3-COOH(0.9777). The suggested product
2-methyl-Figure 6. SW-AdCS voltammograms of 5.0 ×10⁻⁷ mol L-1 gatiloxacin
during induced degradation in 2.5 mol L-1 HCl for different time intervals
piperazine (II) is electro-inactive at the mercury electrode, while product (III), 6-luoro-7-hydroxy-8-methoxy-1-cyclopropyl-4-oxo-quinoline, is electro-active. The reduction along the 1st peak (E
p = –1.20 V)
and 2nd peak (E
p = –1.45 V) corresponds to reduction of
the C=O double bond of the degraded product (III) and
that of gatiloxacin (I), respectively. The C=O double bond of the degraded product (III) is more susceptible to reduction (Ep = –1.20 V) than that of gatiloxacin (I) (Ep = –1.45 V)which may be due to the steric hindrance on the latter. On the other side, voltammograms of gatiloxacin solution treated with 2.5 mol L-1 NaOH showed no
additional reduction peak indicating enough stability of gatiloxacin in alkaline medium. Mean percentage recoveries (%R) of gatiloxacin in its treated solutions with HCl were estimated by means of the described SW-AdCS voltammetric (Table 3).
Degradation kinetics
Concentrations of the unchanged gatifloxacin and consequently the percentage recoveries at different time intervals (t) of treatment with HCl were estimated by means of the described stripping voltammetric method using the calibration plot method (Table 3). The achieved recovery of gatiloxacin within the level of about 10% suggested a significant degradation of gatifloxacin during the forced treatment in the acid solution. Variation of concentration (Ct) of gatifloxacin with time (t) of degradation is exponential indicating irst-order kinetics. A linear-it relationship between ln (Co/Ct) and time t was obtained up to 360 min (Figure 6, Insert), which means that degradation process of gatiloxacin follows pseudo irst-order kinetics. From slope value of ln (Co/Ct) versus
time t plot, the apparent degradation rate constant (k) and half-life (t1/2) were estimated and found to be 6.3×10⁻³ min–1
and 115.5 min, respectively.
Applications
Assay of gatiloxacin in presence of its degradation products Stability indicating property of the described SW-AdCS voltammetric method was studied. Figure 7 illustrates
SW-AdCS voltammograms of 5.0 × 10⁻⁷ mol L-1
gatiloxacin solution after forced acid degradation for 480 min (curve a) and that of the same degraded solution to which 5.0 × 10⁻⁸ mol L-1 standard gatiloxacin solution
was added (curve b). As shown in Figure 7, the cathodic peak of standard gatiloxacin and that of its degradation product are well-resolved. Moreover, the percentage recovery of the added standard gatiloxacin was found to be 102.18 ± 0.98 indicating the successful assay of gatiloxacin without interference from its acid-induced degradation products Therefore, the method could be used successfully as a stability-indicating method for assay of gatiloxacin.
Assay of tequin® tablets
The described SW-AdCS voltammetric method was successfully applied to assay of gatiloxacin in tequin® tablets
solution, using the calibration plot method, without the necessity for samples pretreatment and /or time-consuming extraction steps prior to analysis (Table 4). The validity of the described method was further assessed by applying the standard addition method53 for three different standard
gatiloxacin solutions added to pre-analyzed tablet solutions. The analysis exhibited also satisfactory results, which were statistically compared with those, obtained by a reported
Scheme 2
Table 3. Main percentage recovery (% R) of 5.0×10⁻⁷mol L-1 gatiloxacin solution, at different time (t) intervals of forced degradation by reluxing with
2.5 mol L-1 HCl solution, using the described SW-AdCSvoltammetric method; B-R universal buffer of pH 7; t
acc = 30 s (n = 3)
Relux time t / min 0 30 90 180 360 480
CFound / (mol L-1) 5.08×10⁻⁷ 4.40×10⁻⁷ 3.23×10⁻⁷ 2.22×10⁻⁷ 0.53×10⁻⁷ 0.52×10⁻⁷
spectrophotometric method.28 Since thecalculated F-value
did not exceed the theoretical one (Table 4), there was no signiicant difference between the described and reported methods with respect to reproducibility.54 Also, no signiicant
difference was noticed between the two methods regarding accuracy and precision as revealed by t -test value,54 Table 4.
Assay of spiked serum samples
A quantitative assay of gatiloxacin spiked in human serum was carried out by the described SW-AdCS voltammetric method without the necessity for samples pretreatment and /or time-consuming extraction steps prior to the analysis. Representative SW-AdCS voltammograms of various concentrations of gatiloxacin spiked in human serum are shown in Figure 8. As can be seen in Figure 8 (curve a); no interfering peaks were observed in the blank human serum within the studied potential range. LOD of 2.2 × 10⁻⁹ mol L-1 and LOQ of 7.3 ×10⁻⁹ mol L-1 gatiloxacin
in the spiked serum samples were achieved by the described method. Mean percentage recovery of 101.06 ± 1.21 was achieved by four replicate measurements.
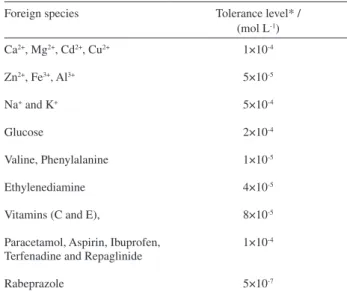
Effect of potential interferences
Interferences from some foreign species such as Ca2+,
Mg2+, Zn2+, Al3+, Cd2+, Fe3+, Cu2+, Na+ , K+, glucose, valine,
phenylalanine and ethylenediamine (as a metabolite of gatiloxacin) on analysis of 2.0 × 10⁻⁷ mol L-1 gatiloxacin
spiked in human serum were identiied by means of the described SW-AdCS voltammetric method (Table 5). Moreover, the interferences from some typical co-administered drugs such as vitamins (C and E), paracetamol, aspirin, ibuprofen, terfenadine, repaglinide and rabeprazole were also studied (Table 5). Results of the Tolerance levels of each of the investigated species reported in Table 5 indicated that none of these substances was found to interfere with analysis of gatiloxacin. This may be due to that some of the foreign species are electro-inactive or they did not generate any voltammetric signal within the applied range of potential under the operational experimental conditions. Besides, the cathodic peaks of the electroactive species appeared at much less negative potentials (e.g. Zn2+: E
p = –0.85 V, and
rabeprazole: Ep = –1.03 V vs. Ag/AgCl/KCls) than that of gatiloxacin (Ep = –1.45 V). Therefore, the described SW-AdCS voltammetric method can be successfully applied to assay of gatiloxacin in biological luids without interferences from foreign organic and inorganic species.
Pharmacokinetic studies
A pharmacokinetic study was performed on the plasma samples of two healthy volunteers (about 40-years old)
Figure 7. SW-AdCS voltammograms of 5.0 ×10⁻⁷ mol L-1 gatiloxacin
recorded following induced degradation in 2.5 mol L-1 HCl for 480 min
(curve a) and for the same solution in presence of 5.0 ×10⁻⁸ mol L-1 standard
gatiloxacin solution (curve b); pH = 7 and tacc = 30 s. Figure 8. SW-AdCS voltammograms for various concentrations of gatiloxacin spiked in human serum in a B-R universal buffer of pH 7: (a) Background, (b) 1.0 ×10⁻⁸, (c) 3.0 ×10⁻⁸, (d) 5.0 ×10⁻⁸, (e) 7.0 ×10⁻⁸ ,
(f) 1.0 ×10⁻⁷ , and(g) 2.0 ×10⁻⁷ mol L–1; E
acc. = – 0.7 V, tacc. = 100 s,
f = 80 Hz, ∆Es = 10 mV and a = 25 mV.
Table 4. Assay of Tequin® tablets (400 mg / tablet) by the described
SW-AdCS voltammetric method (tacc = 100 s,) and a reported UV-spectro-photometric method28
Recovery (%R ± R.S.D) by the described method
(Calibration curve method) 99.59 ± 1.06
Recovery (%R ± R.S.D) by the described method
(Standard addition method) 100.83 ± 0.29
Recovery (%R ± R.S.D) by the reported method28
(Standard addition method) 101.03 ± 0.40
F-value 1.90
t-test 1.99
by the described stripping voltammetry method following an oral administration of a single dose of tequin® tablet
(400 mg gatiloxacin). No interfering voltammetric peak was observed with that of gatiloxacin during the assay of the plasma samples. The obtained plasma concentration-time profiles of the two subjects are shown in Figure 9. The pharmacokinetic parameters: the area under the plasma concentration-time proile from time zero to the last measurable sample time (AUC0 to 24) and to ininity (AUC0 to ∞); the maximum plasma concentration (Cmax); time of the maximum plasma concentration (tmax); terminal rate constant (Kel) and terminal half-life time (t1/2) were estimated. Cmax and tmax were estimated directly from the concentration-time proile. The area under the plasma concentration-concentration-time proile from time zero (pre-dose) to time of last quantiiable
concentration (AUC0 to 24) was estimated using the linear trapezoidal method. The terminal rate constant (Kel) was estimated by applying a log – linear regression analysis to at least the last three time points. The terminal half-life time (t1/2) was estimated as [ln 2 / Kel]. The area under the plasma concentration-time proile from time zero to ininity (AUC0 to ∞) was estimated as [AUC0 to 24 + (C24 / Kel)], Table 6. The obtained plasma concentration-time proiles and the estimated pharmacokinetic parameters were favorably compared with those reported in literature2-4 conirming the
reliability of the described SW-AdCS voltammetric method for assay of gatiloxacin in human plasma.
Conclusions
A validated, simple, sensitive, precise and selective stability-indicating square-wave adsorptive cathodic stripping voltammetric method was described for the trace quantiication of gatiloxacin in bulk form, pharmaceutical formulation, and human blood without interferences from excipients present in tablets,endogenous substances present in human blood or its degradation products. The method could be recommended for analysis of the drug in quality control analysis and clinical laboratories.
Acknowledgments
The author express her gratitude to Ramadan Specialized Hospital’s staff, (Tanta City, Egypt), for the kind care of
the two volunteers and for providing the great facilities for collecting and treatments of the plasma samples required for the pharmacokinetic studies.
References
1. Blondeau, J. M.; Laskowski, R.; Bjarnason, J.; Stewart, C.; Int. J. Antimicrob. Agents2000, 14, 45.
Table 6. Estimated plasma pharmacokinetic parameters of two subjects following an oral administration of a single dose (Tequin® tablet, 400 mg
gatiloxacin)
Parameter / Unit Estimated values*
Subject (1) Subject (2)
Cmax / (µg mL-1) 4.47 4.03
tmax / h 1.50 2.00
AUC0 to 24 / (µg h mL-1) 42.91 37.69
AUC0 to ∞ / (µg h mL-1) 50.28 42.52
Kel / h–1 0.075 0.079
t1/2 / h 9.28 8.75
*Average of two measurements.
Figure 9. Mean plasma concentration- time proiles for two subjects following an oral administration of a single dose of Tequin® tablet (400 mg
gatiloxacin).
Table 5. Interferences from foreign species on analysis of 2×10⁻⁷ mol L-1
gatloxacin by the described SW-AdCS voltammetric method
Foreign species Tolerance level* /
(mol L-1)
Ca2+, Mg2+, Cd2+, Cu2+
Zn2+, Fe3+, Al3+
Na+ and K+
Glucose
Valine, Phenylalanine
Ethylenediamine
Vitamins (C and E),
Paracetamol, Aspirin, Ibuprofen, Terfenadine and Repaglinide
Rabeprazole
1×10⁻⁴
5×10⁻⁵
5×10⁻⁴
2×10⁻⁴
1×10⁻⁵
4×10⁻⁵
8×10⁻⁵
1×10⁻⁴
5×10⁻⁷
2. Clinical pharmacology, www.rxlist.com/cgi/generic3/gatiloxacin. htm, accessed in January 13, 2005.
3. Nakashima, M.; Uematsu, T.; Kosuge, K.; Kusajima, H.; Ooie, T.; Masuda, Y.; Ishida, R.; Uchida, H.; Antimicrob. Agents Chemother.
1995, 39, 2635.
4. Hosaka, M.; Yasue, T.; Fukuda, H.; Tomizawa, H.; Aoyama, H.; Hirai, K.; Antimicrob. Agents Chemother. 1992, 36, 2108. 5. Mirza, S.;Rabindra, N.;Hassan D. M.; Huda, N.; Shaikh, F.; Chin.
J. Chromatogr. 2008, 26, 358.
6. Salazar-Cavazos, M. L.; Gonzalez, L. Y. C.; De Lerma, G. G.; De Torres, N. W.; Chromatographia2006, 63, 605.
7. Salgado, W. R. N.; Lopes, C. C. G. O.; J. AOAC Int. 2006, 89, 642. 8. Al-Dgither, S.; Alvi, S. N.; Hammami, M. A.; J. Pharm. Biomed.
Anal. 2006, 41, 251.
9. Santoro, M. I. R. M.; Kassab, N. M.; Singh, A. K.; Kedor-Hackmam, E. R. M.; J. Pharm. Biomed Anal. 2006, 40, 179.
10. Shirke, T. R.; Pai, N.; Asian J. Chem. 2004, 16, 546.
11. Overholser, B. R.; Kays, M. B.; Sowinski, K. M.; J. Chromatogr., B 2003, 798, 167.
12. Liang, H. R.; Kays, M. B.; Sowinski, K. M.; J. Chromatogr., B 2002,
772, 53.
13. Borner, K.; Hartwig, H.; Lode, H.; Chromatographia 2000, 52, S105. 14. Sowmiya, G.;Gandhimathi, M.; Ravi, T. K.; Sireesaa, K. R.; Indian
J. Pharm. Sci. 2007, 69, 301.
15. Suhagia, B. N.; Shah, S. A.; Rathod, I. S.; Patel, H. M.; Shah, D. R.; Marolia, B. P.; Anal. Sci. 2006, 22, 743.
16. Motwani, S. K.; Khar, R. K.; Ahmed, F. J.; Chopra, S.; Kohli, K.; Talegaonkar, S.; Iqbal, Z.; Anal. Chim. Acta2006, 576, 253. 17. Vishwanathan, K.; Bartlett, M. G.; Stewart, J. T.; Rapid Commun.
Mass Spectrom. 2001, 15, 915.
18. Nguyen, H. A.; Grellet, J.; Ba, B. B.; Quentin, C.; Saux, M. C.;
J. Chromatogr., B2004, 810, 77.
19. Zhu, X. S.; Gong, A. Q.; Yu, S. H.; Spectrochim. Acta, Part A2008,
69, 478.
20. Razek, T. M. A.; El-Baqary, R. I.; Ramadan, A. E.; Anal. Lett.
2008,41, 417.
21. Colunga-Gonzalez, L. Y.; De Lerma, M. G. G.; De Torres, N. W.; Salazar-Cavazos, M. D. L.;Anal. Lett. 2005,38, 2355.
22. Ocana, J. A.; Barragan, F. J.; Callejon, M.; J. Pharm. Biomed. Anal.
2005,37, 327.
23. Guo, C. C.; Dong, P.; Chu, Z. J.; Wang, L.; Jiang, W.; Luminescence
2008,23, 7.
24. Gouda, A. A. F.; El-Sheikh, R.; Amin, A. S.; Chem. Pharm. Bull.
2008,56,34.
25. Gao-wa, A.; Yu-long, T.; Hai-yan, F.; Spectrosc. Spect. Anal.2007,
27, 1615.
26. Amin, A. S.; Gouda, A. A. F.; El-Shiekh, R.; Zahran F.; Spectrochim. Acta, Part A 2007,67, 1306.
27. Salgado, H. R. N.; Oliveira, C. L. C. G.; Pharmazie 2005,60, 263. 28. Venugopal, K.; Saha, R. N.; Il Farmaco2005,60, 906.
29. Faria, A. F.; De Souza, M. V. N.; De Oliveira, M. A. L.; J. Braz Chem. Soc.2008,19,389.
30. Sun, H. W.; He, P.; Lv, Y. k; Liang S. X.; J. Chromatogr., B 2007,
852, 145.
31. Faria, A. F.; De Souza, M. V. N.; De Almeida, M. V.; De Oliveira, M. A. L.; Anal. Chim. Acta2006,579, 185.
32. Sane, R. T.; Menon, S.; Pathak, A. R.; Deshpande, A. Y.; Mahale, M.; Chromatographia 2005,61, 303.
33. Xie, X.; Shao, X.; Yue, Q.; Huang, C.; Song Z.; Anal. Lett.2007,
40,1951.
34. Lian, N.; Zhao, H. C.; Sun, C. Y.; Jin, L. P.; Zhang, Z. L.; Zheng, Y. Z.; Chem. J. Chin. Univ.-Chin. 2002, 23, 564.
35. Reddy, T. M.; Balaji, K.; Reddy, S. J.; J. Anal. Chem. 2007, 62,168 36. Abdel Ghani, N. T.; El Ries, M. A.; El-Shall, M. A.; Anal. Sci. 2007,
23, 1053.
37. Guo, M.; Yu, Q. S.; Anal. Sci. 2006, 22, 685.
38. El Ries, M. A.; Wassel, A. A.; Abdel Ghani, N. T.; El-Shall, M. A.;
Anal. Sci. 2005, 21, 1249.
39. Han-Ying, Z.; Mei-Zhen, N.; Zhi-Qi, Z.; Li-Ping, K.; At. Spectrosc.
2008, 29,32.
40. Al-Ghannam, S. M.;Spectrochim. Acta, Part A 2008, 69,1188.
41. Ragab, G. H.; Amin, A. S.; Spectrochim. Acta, Part A2004, 60, 973. 42. Zuman, P.; The Elucidation of Organic Electrode Process,
Academic Press: New York, 1969.
43. Bond, A. M.; Modern Polarographic Methods in Analytical Chemistry, Dekker Marcel: New York, 1980.
44. Laviron, E.; J. Electroanal. Chem.1974, 52, 355.
45. Bard, A. J.; Faulkner, L. R.; Electrochemical Methods: Fundamentals and Applications, John Wiley & Sons: New York, 1980.
46. Monk, P.; Fundamentals of Electroanalytical Chemistry, Wiley: New York, 2001.
47. Laviron, E.; Roullier, L.; Degrand, C.; J. Electroanal. Chem. 1980,
112, 11.
48. Miller, J. C.; Miller, J. N.; Statistics for Analytical Chemistry, 4th ed.,
Ellis-Howood: New York, 1984.
49. The USA Pharmacopoeia; The National Formulary, USP 26, Convention Inc. 2003.
50. ICH, Proceedings of the International Conference on Harmonization, ICH Q1A, Stability Testing of New Drug Substances and Products, Geneva, 1993.
51. Ojha, T.; Bakshi, M.; Chakraborti, A. K.; Singh, S.; J. Pharm. Biomed. Anal. 2003, 31, 775.
52. El-Gindy, A.; J. Pharm. Biomed. Anal.2000, 22, 215.
53. Ewing, G. W.; Instrumental Methods of Chemical Analysis, 5th ed.,
Lippincott-Raven: Philadelphia, 1995.
54. Christian, G. D.; Analytical Chemistry, 5th ed., John Wiley Sons Inc.:
USA, 1994.
Received: November 19, 2008