1395
The Reach of Radio: Ending Civil Conflict
through Rebel Demobilization
†By Alex Armand, Paul Atwell, and Joseph F. Gomes* We examine the role of FM radio in mitigating violent conflict. We collect original data on radio broadcasts encouraging defections during the Lord’s Resistance Army (LRA) insurgency. This con-stitutes the first quantitative evaluation of an active counterinsur-gency policy that encourages defections through radio messages. Exploiting random topography-driven variation in radio coverage along with panel variation at the grid-cell level, we identify the causal effect of messaging on violence. Broadcasting defection messages increases defections and reduces fatalities, violence against civil-ians, and clashes with security forces. Income shocks have oppos-ing effects on both the conflict and the effectiveness of messagoppos-ing. (JEL D74, L82, O17)
Ending entrenched insurgencies remains a fundamental challenge for policy actors. We provide evidence that rebels can be effectively encouraged to defect by sending messages over radio. Following a number of ineffectual peace agreements in the early 1990s, key policy actors began to go beyond macro-level solutions and address individual incentives to participate in violence. Significant resources and attention have been focused on Disarmament, Demobilization, and Reintegration (DDR) programs as a means to draw combatants out of militarized structures and put them on a path to civilian life. Yet, few formal activities within such programs work to address the issues that might prevent combatants from leaving conflict and entering DDR programs, particularly in the absence of a stable ceasefire. Defection * Armand: Nova School of Business and Economics, Universidade NOVA de Lisboa, NOVAFRICA, Navarra Center for International Development, and Institute for Fiscal Studies ( email: [email protected]); Atwell: Department of Political Science, University of Michigan, and Ford School of Public Policy ( email: patwell@umich. edu); Gomes: IRES/LIDAM, UCLouvain, and CEPR ( email: [email protected]). Stefano DellaVigna was the coeditor for this article. We would like to thank four anonymous referees for careful reading, and construc-tive suggestions. In addition, we would like to thank Carles Boix, Pedro Carneiro, Caitriona Dowd, James Fenske, Patricia Justino, Macartan Humphreys, Luigi Minale, Maria Petrova, Marta Reynal-Querol, Andrea Tesei, Pedro Vicente, Ulrich Wagner, David Yanagizawa-Drott and conference/seminar participants at University of Barcelona, University of Bergen, University Carlos III Madrid, University of Rovira i Virgili, Universitat Pompeu Fabra, University of Southampton, Nova SBE, UCLouvain, University of Exeter, ENS Lyon, IIM Bangalore, ASSA 2019, NBER SI 2018 Economics of National Security, WGAPE 2017, NEUDC 2017, SAEe 2017, CSAE 2018, RES 2018, PacDev 2018, ACEGD 2017 ISI Delhi, and ACCID 2017 Jadavpur University for helpful comments. We are grateful to Innovative Hub for Research in Africa/Marakuja Research Kivu, and Gaplink for the implementation of the data collection. We gratefully acknowledge financial support from the Ramón Areces Foundation (grant Radio Messaging and Armed Group Behavior). Ethics approval was secured from University of Navarra (application 2018.017). The paper was previously circulated as “The Reach of Radio: Defection Messaging and Armed Group Behavior.”
† Go to https://doi.org/10.1257/aer.20181135 to visit the article page for additional materials and author
messaging is one such initiative that has gained support and prominence in recent years ( UN-DDR 2014).
Defection messaging aims to mitigate and end conflict by providing active com-batants with information on the logistics of surrender, immunity offers and judi-cial processes, and the willingness of their families and communities to reintegrate them. Since print and digital media have limited reach in remote areas where armed groups often operate, several policy actors have opted to use FM radios to broadcast defection messages. This strategy has played a notable role in multiple conflicts around the globe.1 While the previous literature has highlighted cases of radio being
used as a propaganda tool for inciting violence ( Yanagizawa-Drott 2014), politi-cal mobilization (Adena et al. 2015), and ethnic hatred (DellaVigna et al. 2014), we examine its effectiveness as an instrument for peace. Focusing on the Lord’s Resistance Army (LRA) insurgency in central Africa, we provide the first quanti-tative evaluation of a defection messaging program aimed at ending an active civil conflict. In addition to examining the effectiveness of defection messaging in reduc-ing violence, we provide novel insights into armed group behavior and how eco-nomic incentives to fight interact with counterinsurgency policies.
The LRA conflict started in northern Uganda in 1988 and has since devastated local populations across the region, expanding into the Democratic Republic of Congo (DRC), South Sudan, and Central African Republic (CAR) as it evolved. The insurgency was made infamous by the LRA’s brutal tactics and a notable reliance on abducted child soldiers. Over the course of the conflict the group has caused an estimated 100,000 deaths and displaced 2.5 million civilians (UN Security Council 2013a). While its forces have now been reduced to 200 fighters or fewer, in its prime the group had a stable membership of as many as 3,000. Beyond its direct effect on violence, the conflict has inflicted a massive blow to the economy, society, and politics of the region, the consequences of which will be felt for a long time to come (Blattman 2009; Blattman and Annan 2010; Rohner, Thoenig, and Zilibotti 2013).
FM defection messaging has been employed in the LRA conflict since the early 2000s and has expanded dramatically since 2008. The programs have been largely modeled on the “Come Home” broadcasts pioneered by two stations in northern Uganda in the early 2000s. Programs include interviews with combatants who have surrendered, personal messages from family or community members, and logistical information on how to surrender safely. While we cannot directly observe combat-ants receiving FM radio broadcasts, a qualitative survey of ex-combatcombat-ants that we undertook in northern DRC shows that more than 95 percent of the respondents were exposed to these messages either directly or through other LRA members.2
1 For instance, during the Vietnam War (Daddis 2017); the Colombian conflict against the FARC (John Otis,
“Why Colombia’s Leftist Guerrillas Are Defecting,” Time, October 30, 2009, http://content.time.com/time/ world/article/0,8599,1931814,00.html); and the Boko Haram insurgency in Nigeria (Mary Kay Magistad, “How a Shortwave Radio Network Is Helping to Counter Boko Haram,” Public Radio International, May 19, 2017, https://www.pri.org/stories/2017-05-19/how-shortwave-radio-network-helping-counter-boko-haram). See online Appendix Section G for further examples.
2 Combatants could return following a wide range of pathways. Both formal and informal institutions
facili-tated forgiveness from local communities and reintegration into civilian life. Online Appendix Section F provides a detailed description of the institutions involved, the services offered, and the features that make forgiveness and reintegration possible.
To study the effectiveness of the programs, we construct a novel dataset combining primary and secondary sources of data. We design and conduct a survey of radio station operators to collate data on the annual expansion of defection messaging in the four countries affected by the conflict. Through the survey, we also collect data on radio station characteristics, allowing us to generate time-varying topography-corrected coverage estimates, which we leverage for identification. We combine this information with the previously underexploited LRA Crisis Tracker (LRACT) database. LRACT is a geo-coded database providing detailed information on events related to the LRA from 2008 to the present. We merge these with geographically disaggregated data on a range of variables pertinent to conflict, resulting in a grid-cell-level panel dataset.3
We focus on the 2008–2015 period, which is when the use of FM radios became a central counterinsurgency strategy. After a sustained military offensive in 2008 drove LRA forces into remote regions of DRC, South Sudan, and CAR, they started operating in small groups spread across vast expanses (Lancaster, Lacaille, and Cakaj 2011). Under these conditions, radio represented by far the most effective means to communicate with potential defectors, given the LRA was known to acquire radio receivers. The United Nations (UN) and other international NGOs began expanding capacity at small community radio stations, as well as working with communities to establish new stations (UN Security Council 2013b). The main expansion of defection messaging began around 2010, hence the relevant variation in the data is restricted to this period. Furthermore, the LRACT began a detailed cataloging of LRA activities in 2008. Focusing on the post-2008 period allows us to undertake an uncommonly rich analysis of the effects of radio messaging on conflict. We are able to go beyond just looking at the number of events or fatalities available from other conflict datasets. In addition to looking at actual returnees who willingly escape from armed group enrollment or captivity, we explore the behavior of the LRA when confronted by dwindling membership.
In total, 19 radio stations with 21 antennas were actively broadcasting defection messages during the study period, spanning an area of almost 300,000 square kilo-meters. The phased expansion of the messaging campaign and of radio coverage over time allows us to estimate the causal impact of messaging by exploiting three sources of plausibly exogenous variation. Firstly, we measure radio coverage corrected by the topography of the affected area (see, for instance, Olken 2009, Yanagizawa-Drott 2014). Secondly, we enhance the current literature by exploiting the panel dimen-sion of the dataset and controlling for time-invariant unobservable characteristics at a highly disaggregated level. Finally, we exploit the random overlapping of radio cover-age from different radios to build a measure of messcover-age intensity at the grid-cell level. Instead of using administrative units, which might be endogenous to conflict, we use 14 km × 14 km grid cells for the analysis, chosen based on the geography of point patterns (Boots and Getis 1988, see online Appendix Section B.3).
Defection messaging has a substantial impact on LRA-related conflict outcomes. A 1 standard deviation increase in the intensity of defection messaging (approxi-mately 20 minutes of daily messaging at full cell coverage) leads to a 2.7 percent decrease in fatalities, a 1 percent increase in the number of returnees, and a 1 percent
3 These data include information on natural resources such as cash crops and minerals, weather variables such as
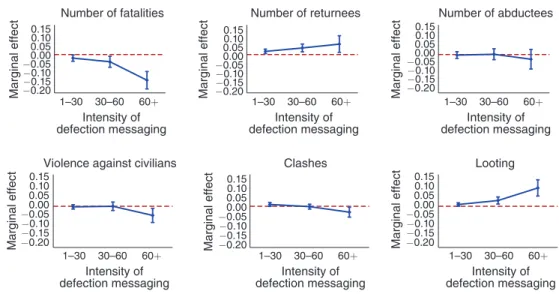
decrease in the number of attacks against civilians and clashes with security forces, but has no statistically significant effect on abduction rates. A higher intensity of defection messaging also leads to an increase in looting by the LRA. The increase in looting is primarily survival oriented. Allowing for nonlinear effects, we find that the effect of defection messaging increases significantly with its intensity for all outcome variables. While low levels of intensity have a negligible effect, more than an hour of messaging per day at full cell coverage leads to an almost 15 percent reduction in fatalities and a 6 percent increase in returnees. These effects correspond to a large aggregate impact. Counterfactual estimates based on LRACT data suggest that defection messaging led to 1,151 (27 percent) fewer deaths, and accounted for 297 (14 percent) of the 2,073 returnees observed in the data (Section IVB).
We interpret these findings by considering defection messaging as an instrument of persuasive communication affecting combatants’ behavior through one or both of two models (see DellaVigna and Gentzkow 2010 for a review of the literature). The first, a belief-based model, considers combatants as rational agents relying on Bayesian updating based on new information received from the messages. The second is a preference-based model, in which even if agents are not fully rational and messages are noninformative, communication affects fighters’ behaviors under two conditions. First, if they either implicitly value the act of going back to civilian life or being part of the LRA, and second, if defection messaging can influence these values.4
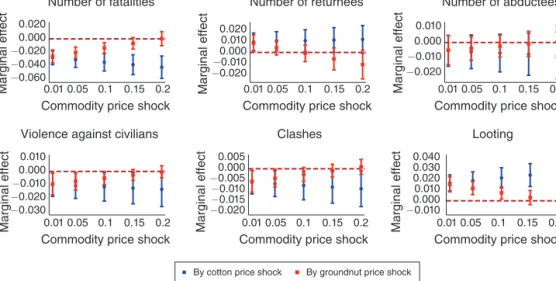
We also exploit detailed satellite-based data on the presence of commodities and natural resources to uncover evidence of heterogeneous effects of defection mes-saging by income shocks. A burgeoning literature highlights how positive shocks to labor-intensive sectors reduce conflict by increasing wages and reducing the supply of labor for conflict activities, i.e., the opportunity cost channel, while positive shocks to capital-intensive sectors increase the returns from predation, i.e., the rapacity chan-nel (Dal Bó and Dal Bó 2011, Dube and Vargas 2013). In the same vein, we provide novel evidence that both violence and the effectiveness of counterinsurgency policies respond to economic incentives. As is standard in the literature, we measure income shocks by combining the presence of commodities and natural resources with exog-enous changes in international prices (Dube and Vargas 2013, Bazzi and Blattman 2014, Berman et al. 2017). Using Lasso (least absolute shrinkage and selection opera-tor) regressions for covariate selection we identify cotton and groundnut price shocks as the two relevant shocks in the context of the LRA from a long list of commodities. These shocks have opposing effects on the conflict. Exogenous positive shocks to the price of cotton reduce the conflict and increase the effectiveness of defection mes-saging. A 1 standard deviation increase in the conflict-reducing cotton price shock enhances the effect of defection messaging on fatalities by 1 pp. Positive price shocks to the labor-intensive cotton sector arguably increase labor market opportunities and returns from working in the cotton sector, thereby reducing labor supply for the con-flict sector. Positive shocks to the price of groundnut have the opposite effect. A 1 standard deviation increase in the conflict-inducing groundnut price shock reduces
4 Since defection messages targeted both beliefs and preferences of fighters, both models could be relevant. This
is a feature of all defection messaging programs ( UN-DDR 2014). In the LRA setting, this is confirmed by both survey data about content and by text analysis of messages. See Section IVC and online Appendix Section B.19 for further discussion.
the effect of defection messaging on fatalities by 1 pp. Due to its easy appropriability, groundnut was being looted by the LRA (Section IVC). Hence, positive shocks to the groundnut sector correspond to higher incentives to fight.
This is not to say that ideology is not important in motivating combatants, espe-cially because indoctrination played a key role during the early stage of the conflict (Beber and Blattman 2013). However, if fighters are also driven by economic incen-tives, the relative trade-off between fighting or leaving the group influences the effec-tiveness of messaging. This is related to the broader literature on the participation problem which investigates how armed group leaders motivate individuals to soldier for their side (Blattman and Miguel 2010, Weinstein 2006, Wood 2003). Weinstein (2006) makes a distinction between opportunistic rebels attracted to groups with material resources and ideologically motivated rebels attracted by long-run rewards based on a particular set of ideals and the “pleasures of agency” (Wood 2003).5
We contribute to three distinct strands of literature. First, we contribute to the literature studying the effects of media on social and political outcomes.6 The recent
literature highlights the role of radio in inciting violence and hateful attitudes. Yanagizawa-Drott (2014) shows how propaganda broadcast over the radio incited violence during the Rwandan Genocide. Adena et al. (2015) shows how radio was instrumental in building public support for the Nazi party and its policies. DellaVigna et al. (2014) demonstrates how radio was effective in shaping hateful sentiments between ethnic groups in Croatia. While this literature convincingly establishes radio’s success in encouraging violence, it does not necessarily imply that radio will also be successful in the opposite direction. This is particularly relevant because recruitment for and defection from armed groups are separate processes (Gates and Nordås 2015, Gates 2017, Bénabou and Tirole 2011). Recruitment relates to a participation problem, in which individuals from outside the rebel group must be encouraged to join. Defection, on the other hand, relates to a retention problem, in which group leaders devise incentive schemes to ensure continued allegiance from members. Similarly, the path to peace is very different from the simple reversal of the path to conflict (Wolfsfeld 2004). Peace involves confronting the legal, social, and psychological penalties of having participated in the conflict. In contrast, convincing an individual to join a conflict is often ideologically motivated, with nebulous returns coming in a later period, or through the use of force.7 We provide novel evidence on
the effectiveness of radio in mitigating pernicious outcomes and reducing violent conflict.
Second, we contribute to the nascent quantitative literature examining counter-insurgency policies. While much of this literature concentrates on the causes and consequences of conflicts (Blattman and Miguel 2010), the restoration of peace
5 While moral outrage over government abuses led to conflict in El Salvador (Wood 2003), material incentives
directly affected conflicts in Mozambique, Sierra Leone, and Peru (Weinstein 2006).
6 Previous contributions focus on its effects on political accountability (Besley and Burgess 2002, Strömberg
2004), voting (DellaVigna and Kaplan 2007), crime (Dahl and DellaVigna 2009), social capital (Olken 2009), women’s agency (Jensen and Oster 2009; La Ferrara, Chong, and Duryea 2012), interethnic relations (Blouin and Mukand 2019), and social attitudes (Paluck and Green 2009).
7 See online Appendix H for further discussion on the asymmetric effects of media on violence and peace.
Furthermore, broadcasting defection messages could have possibly deterred defection if the LRA became more vigilant against potential defectors as the result of it.
once conflicts become entrenched remains underinvestigated.8 An emerging
litera-ture highlights the importance of civilian cooperation for the success of counterin-surgency (Berman, Shapiro, and Felter 2011; Berman, Felter, and Shapiro 2018).9
Berman, Shapiro, and Felter (2011) provides evidence about the effectiveness of mixing service provision with coercion to curry civilian support and gather informa-tion on insurgents during the Iraq War. For the same conflict, Shapiro and Weidmann (2015) highlights how mobile communications reduce insurgent violence through improved information sharing by civilians. While these studies focus on the role of civilians, the literature lacks evidence on policies directly targeting combatants. We fill this gap by providing the first evaluation of a counterinsurgency policy that tar-gets rebels through messages encouraging defections. Attempts at evaluating such media-based peace building policies are conspicuously absent from the literature despite their widespread use.10
Finally, we view this paper as a starting point for a new literature studying how DDR programs, peace agreements, and amnesties can be made to work. Despite the importance of these policies in recent history, rigorous quantitative evaluations are scarce. A total of 297 conflict amnesties were granted between 1946 and 2010 (Dancy 2018). From 1989 to 2010, 40 DDR programs were implemented, of which 14 were instituted during ongoing conflicts (Banholzer 2014). Furthermore, 80 out of the 216 peace agreements signed between 1975 and 2011 had provisions for DDR (Högbladh 2011). Defection messaging could potentially be effective in all these contexts as a means to get information across to rebels about possibilities of return. We provide evidence on the working of an existing amnesty/DDR policy in bringing rebels off the battlefield.
I. Background
The Lord’s Resistance Army was formed in 1988, when its leader Joseph Kony united remnants of several failed insurgent groups in northern Uganda. Those groups, and, by extension, the LRA, are rooted in long-standing ethnoregional divisions in Uganda. In 1986, President Yoweri Museveni successfully led a largely southern rebel force to power. While many northern elements supported change in Kampala, they violently rejected his southern rule. Despite their resolve, by 1988, most organized resistance to Museveni’s presidency had either surrendered or disbanded under heavy pressure from the Ugandan Army (UPDF). The few elements that remained joined the small, but growing, LRA, which held the ostensible goal of a democratic and spiritual restoration of the nation.11 Since then, the conflict has ravaged local communities.
This was due to episodes of open conflict between Ugandan government forces and the LRA, but even more common and costly was the targeting of noncombatants by both sides, including the torturing, maiming, and killing of individuals for noncooperation
8 One notable exception is Humphreys and Weinstein (2007), which investigates the determinants of successful
reintegration in the post-conflict phase.
9 This factor is important in information-scarce asymmetric conflicts, in which one of the two sides enjoys a
capability advantage and victory is determined by the accurate flow of information from civilians.
10 Online Appendix Section G discusses the generalizability of this paper’s findings with respect to this
liter-ature. There is a related separate strand of the literature on reducing crime and youth violence. See, for instance, Blattman, Jamison, and Sheridan (2017); Heller (2014); and Heller et al. (2017).
or suspected collaboration with enemy forces. Beyond these tactics, the LRA stood out for their reliance on the abduction and indoctrination of children as soldiers, which ultimately brought them international notoriety.
With the hope of ending years of relentless violent conflict, the Ugandan Amnesty Act of 2000 offered a blanket amnesty to LRA combatants who were willing to abandon violence. It is in this context that defection messaging has evolved from a modest innovation at two radio stations to become a central tool in reducing LRA numbers. Aware of the fear that LRA combatants and abducted individuals had of returning home despite the passing of the 2000 Amnesty Act, radio stations in Lira and Gulu (northern Uganda) began broadcasting programs encouraging LRA members to defect. Broadcasts featured family members, often parents, speaking to LRA combatants by name (many of whom were abductees coerced into violence) assuring them they would be welcome and forgiven should they return. In other instances, they featured former LRA members speaking out to assure active fighters of their good health and freedom, while also emphasizing the need to return. The following is an example transcript from a program featur-ing a former LRA member: “I ask you [name of LRA soldier] to take very good care of your soldiers so that they don’t commit any crimes, and lead them to the [Ugandan Army], or the UN or MONUC in Duru or Gilima. Just bring all your sol-diers there. There is nothing bad they do to people here. Just take your time with all your people and come out of the bush.” Online Appendix Section E provides additional examples.
Following years of harsh conflict, the Ugandan government and the LRA signed a fragile ceasefire through the 2006 Juba peace talks. These talks permanently broke down in 2008 when, as part of the US-supported Operation Lightning Thunder, the armed forces of Uganda, DRC, and South Sudan launched aerial attacks and raids on the LRA camps in northern DRC. This was soon met with brutal revenge by the LRA on local communities as it began its dispersion in northeastern DRC, eastern CAR, and western South Sudan. Following this de facto expulsion from Uganda in 2008, the FM radio messaging model was soon elevated as a policy tool to dimin-ish LRA forces in the isolated border regions. With the assistance of the American NGO Invisible Children and the United Nations Organization Stabilization Mission in Democratic Republic of Congo (MONUSCO), new radio stations were built and other community stations were expanded. One community station in the Central African Republic, Radio Zereda, went from operating with a car battery and an umbrella skeleton to an estimated broadcast radius of almost 200 km in 2011. Today, in affected areas, FM stations cover about 300,000 square km.
While we cannot directly observe combatants receiving defection messages through the FM radio broadcasts, qualitative evidence suggests high exposure to the messages. Results from our own independent survey of ex-combatants in north-ern DRC (see online Appendix Section D for details) show that 73 percent of the respondents were listening to the radio while with the LRA. Of this 73 percent, 89 percent had heard defection messages over the radio during their stint with the LRA (66 percent of the full sample). Furthermore, 94 percent of respondents had heard other members discussing these broadcasts. Combining direct and indirect exposure, 96 percent of the respondents were exposed to radio messages. Finally, 67 percent of respondents say that defection broadcasts influenced their decision to
return.12 In addition, Rigterink, Kenyi, and Schomerus (2016) finds that 65 percent
of households in the LRA-affected counties of Ezo and Tambura in South Sudan heard messages targeting the LRA in 2013, despite only 33 percent of interviewed households owning a radio, and only 27 percent being able to receive the radio signal. Another study finds 89 percent of returnees citing defection messaging as “influential in their decision to escape” (Invisible Children 2013).
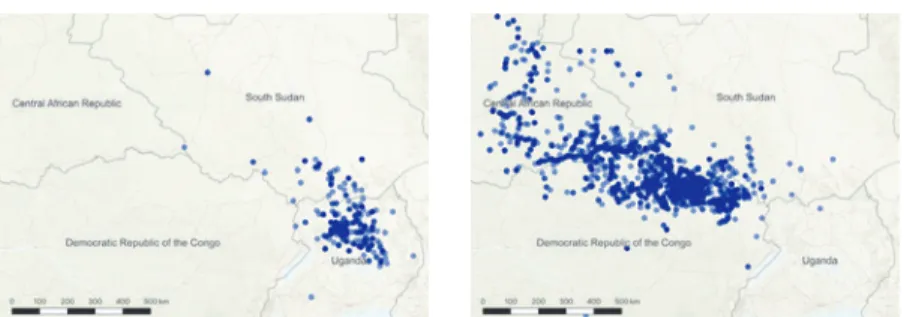
Figure 1 plots the geographic distribution of LRA-related events for the period 1989–2015, divided into pre-2008 and post-2008 periods. The geographic areas affected by the conflict differ markedly across the two periods. We focus on the expansion of the defection program in the border regions of Uganda, DRC, South Sudan, and CAR in the post-2008 period.
II. Data
The time-varying cell-level dataset collates data from a myriad of sources. In this section, we provide a detailed description of the main variables used in the paper.
A. FM Radio Stations and Coverage
The defection messaging data are based on an original survey of an exhaustive set of radio stations that have broadcast defection messaging content aimed at the LRA. We generated the universe of participating radio stations by cross-referencing policy reports and through direct exchanges with international actors and radio operators. We then designed and administered a questionnaire aimed at the radio station man-agers of the participating radio stations. Collating the data from the survey, we con-struct a panel dataset with information about each station’s LRA-related messaging, including content and frequency, as well as other station characteristics, such as
12 Since combatants who do not return are not observed, these numbers should be read as being conditional on
being a returnee.
Figure 1. Extent of LRA-Related Violent Events, 1989–2015
Notes: The geographical distribution of LRA-related violent events in the two periods: 1989–2007 (panel A) and 2008–2015 (panel B). The geographic extent of the figure is restricted to the study area.
Sources: UCDP dataset (which provides data for the whole period of 1989–2015). Basemap source: Esri (see online Appendix A for details and attributions).
normal ( nondefection) programming. We also collect time-varying information on the technical characteristics of each radio station, including their exact geographic location, antenna height, and transmitter power, from which we calculate the geo-graphical reach of each radio station.
We gather information on all radio stations that broadcast defection messaging during the 2008–2015 period (21 antennas belonging to 19 radio stations).13 During
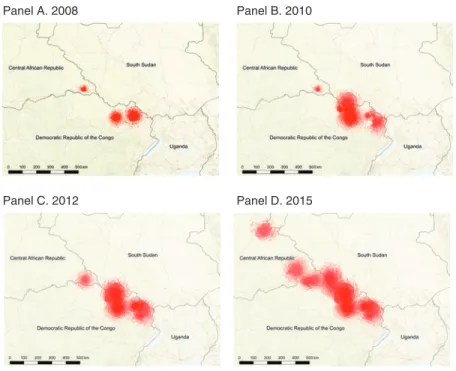
this period the broadcasting of defection messaging expanded over time in multiple dimensions. While some existing radio stations increased their coverage by upgrad-ing equipment, in other cases altogether new radio stations opened in other areas. Figure 2 shows the coverage of radio stations undertaking defection messaging in the LRA-affected area across four distinct years during the study period. During this period, while most radio stations broadcast defection messaging continuously once they started, two stations ceased broadcasting by the end of 2015 due to technical failures (one of which was due to a lightning strike).
13 Online Appendix Section C provides further details about the survey. We collected data on all 26 radio
sta-tions with 30 antennas that have broadcast defection messaging targeted at the LRA at any time. While we gathered information about the radio stations broadcasting defection messages during the pre-2008 period (including stations in Uganda), the data are unreliable (see discussion in online Appendix Section C).
Figure 2. The Expansion of Radio Stations Broadcasting Defection Messaging in LRA-Affected Areas
Notes: The figure plots the coverage of active radio stations in different years. We select all radio stations that broad-cast defection messages for at least one year during the 2008–2015 period. Coverage is corrected for topography using the technical specifications of the radio stations and applying the Longley-Rice/Irregular Terrain Model. See Figure 5 for a comparison with defection messaging intensity. The geographic extent of the figures is restricted to the study area.
Sources: Basemap: Esri (see online Appendix A for details and attributions); graph content produced by the authors.
Panel A. 2008 Panel B. 2010
While the expansion of radio messaging is possibly endogenous to conflict outcomes, as part of the identification strategy, we exploit the exogenous varia-tion in the exposure to radio signals arising from the randomness of topography (explained in detail in Section III). Following the previous literature, we construct topography-corrected radio coverage using the Longley-Rice/Irregular Terrain Model (Enikolopov, Petrova, and Zhuravskaya 2011; Yanagizawa-Drott 2014; Olken 2009; Adena et al. 2015; DellaVigna et al. 2014). The model takes in station parameters and topographic characteristics to determine which areas receive a sig-nal from the station and at what strength at a maximum of 90-meter resolution and a minimum of 30 meters.14 Online Appendix Section B.1 provides further details on
this procedure, including an example. Figure 2 shows the coverage of radio stations broadcasting defection messages incorporating this correction.
Table 1 presents the descriptive characteristics of the radio stations by using anten-nas as a unit of observation. Among the 21 radio antenanten-nas, 19 percent were based in CAR, 62 percent in DRC, 19 percent in South Sudan, and 81 percent were broadcast-ing defection messages in 2015. Durbroadcast-ing the period of 2008–2015, on average, radios were broadcasting approximately 76 minutes of defection content daily. Audible radio signals reached approximately 91 km, on average, from the radio towers.
B. Conflict Intensity
LRA-related conflict data are based on the LRA Crisis Tracker (LRACT) data-base (Resolve 2015). LRACT is an event-based data collection project that began in 2008 through the efforts of two policy NGOs: the Resolve LRA Crisis Initiative and Invisible Children. The goal of LRACT is to provide detailed and disaggregated data on LRA activities to better inform policy actors’ strategies and activities. It pro-vides geo-coded information about LRA-related events, including fatalities, defec-tions, abducdefec-tions, violence against civilians, clashes with security forces, and looting across space and time. Nearly all the events are located in the CAR, DRC, South Sudan, and Uganda. LRACT reports events at the maximum spatial resolution of the population center where the event occurred and at maximum temporal resolution of the day of the event. Online Appendix A provides additional information on the com-position, definition, and evolution of the conflict events over time.
We supplement the LRACT data with conflict data from the Uppsala Conflict Data Program (UCDP) database (Sundberg and Melander 2013) and the Armed Conflict Location and Event Data Project (ACLED) database (Raleigh et al. 2010). Each of these datasets provides event-based information, supplying precise dates and geo-coded locations of events across the study area. Each of the three datasets draw on reports from news agencies, NGOs, and governments. However, beyond this, LRACT draws on a widespread network of field sources, some linked by high frequency (HF) radio. This allows LRACT verifiers to find corroborating accounts of events sourced from other channels, as well as to report events that alternative event-based datasets fail to capture. While all three of the datasets aim to measure
14 Kasampalis et al. (2013) shows that measurement error in the model is small, with raw correlation between
actual and predicted coverage in a specific geographic point being equal to 0.8. We expect measurement error to be even smaller here owing to cell-level averaging of coverage.
Table 1—Descriptive Statistics
Mean SD Min. Max. Observations
(1) (2) (3) (4) (5)
Panel A. Antenna-level characteristics Situation in 2015
Share of active antennas 0.90 0.30 0 1 21
Share broadcasting defection content 0.81 0.40 0 1 21
Location: Central African Republic 0.19 0.40 0 1 21
Location: DR Congo 0.62 0.50 0 1 21
Location: South Sudan 0.19 0.40 0 1 21
Average, 2008–2015
Hours on-air (when active) 11.82 4.10 6 24 21
Daily minutes of defection messaging 75.58 54.37 9 220 21
Daily minutes of sensitization content 59.29 44.33 6 173 21
Daily minutes of logistical content 16.29 12.27 0 47 21
Distance reached by signal (km) 91.41 22.11 48 123 21
Panel B. Cell-level characteristics, 2008–2015
Radio coverage
Cell covered by defection messaging 0.09 0.29 0 1 60,600
Intensity of messaging 3.46 18.91 0 371 60,600
Distance to closest antenna (km) 325.23 169.40 2 848 60,600
Median distance from active antennas (km) 489.14 184.38 6 1,012 60,600
Cell covered (circular coverage) 0.19 0.39 0 1 60,600
Conflict(LRACT database)
Total fatalities 0.05 1.74 0 184 60,600
Number of returnees 0.03 0.62 0 39 60,600
Number of abductees 0.11 2.16 0 207 60,600
Events: violence against civilians 0.01 0.10 0 3 60,600
Events: clashes 0.00 0.07 0 2 60,600
Events: looting 0.02 0.27 0 23 60,600
Conflict(ACLED database)
Number of events (LRA) 0.02 0.39 0 30 60,600
Number of events (LRA attacking) 0.01 0.35 0 29 60,600
Number of events (LRA attacked) 0.00 0.08 0 10 60,600
Total fatalities (LRA) 0.09 3.88 0 515 60,600
Number of events ( non-LRA) 0.07 1.05 0 85 60,600
Total fatalities ( non-LRA) 0.37 13.14 0 1,707 60,600
Conflict(UCDP database)
Number of events (LRA) 0.01 0.17 0 16 60,600
Number of events (LRA attacking) 0.01 0.13 0 10 60,600
Number of events (LRA attacked) 0.00 0.06 0 6 60,600
Total fatalities (LRA) 0.06 1.94 0 241 60,600
Number of events ( non-LRA) 0.01 0.27 0 28 60,600
Total fatalities ( non-LRA) 0.21 8.27 0 1,012 60,600
Other indicators
FM coverage (percent cell) 0.32 0.40 0 1 60,600
GSM coverage (percent cell) 0.18 0.37 0 1 60,600
Mean precipitation (mm/day) 3.69 1.00 1 7 60,600
Average temperature (°C) 26.29 2.79 19 37 60,600
Population (log) 7.56 1.59 3 12 60,600
Notes: This table presents descriptive statistics for all radio stations in the sample for the final year, 2015; the aver-age for the years 2008–2015; and cell-level descriptive statistics for cells at the 0.125 ° × 0.125 ° resolution (approx-imately 14 km × 14 km at the equator). Share of active antennas indicates the share of antennas that participated in the defection messaging effort and are still operating in 2015, independently from the content broadcast. Share
broadcasting defection content reports the share of radio stations that are actively broadcasting defection mes-sages. Distance reached by signal is computed as the seventy-fifth percentile of the distance reached by an antenna.
Distance to closest antenna is computed as minimum distance of the cell’s centroid to an active antenna. Population is the log of the population living within a cell. Intensity of messaging is the total number of minutes of daily defec-tion messaging broadcast in a cell, corrected by the share of the cell covered by radio signal (equation (1)). See online Appendix Section A for further information on the variables.
the same basic trends in conflict intensity, they use slightly different definitions. The LRACT logs any reported sighting or event plausibly involving the LRA. UCDP qualifies an event as an incident characterized by “armed force by an organized actor against another organized actor, or against civilians, resulting in at least 1 direct death” (Sundberg and Melander 2013, p. 524). ACLED codes all events identified as political violence in the developing world, focusing on civil and communal con-flicts, violence against civilians, rioting and protesting.
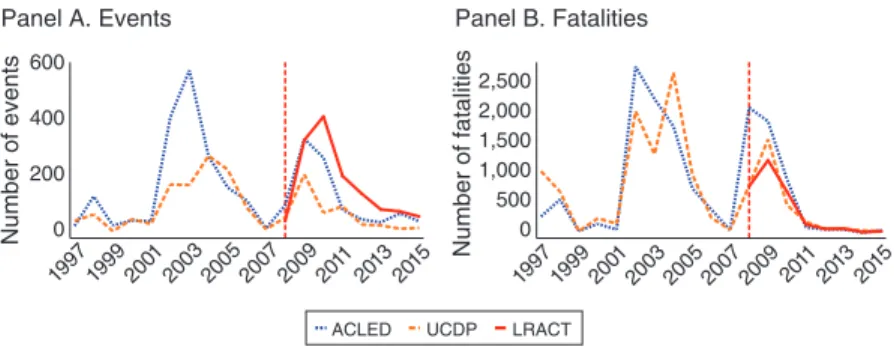
Figure 3 plots the evolution of LRA-related violence from the three different datasets for the years 1997 to 2015 (the LRACT database is available only from the year 2008). Panel A presents the number of events and panel B shows the num-ber of LRA-related fatalities. While the LRA Crisis Tracker’s broader definition of events is apparent, events from the three datasets follow similar trends. Online Appendix Section B.20 discusses potential issues deriving from differences across data sources, and the robustness of the main results with respect to these.
C. Grid-Cell Construction
To construct the units of observation, we superimpose a grid of equally sized cells over the territory affected by the LRA and hold this stable over the entire period of analysis. This approach avoids the potential endogeneity of political boundaries to violence and allows controlling for cell-specific, time-invariant, unobservable char-acteristics (Harari and La Ferrara 2018). This is particularly relevant in this context, since many conflict events are concentrated in the bordering regions of multiple countries. We replicate the analysis using district-level administrative boundaries, showing that conclusions are unaffected (see online Appendix Section B.13).
There are no clear precedents in the existing literature on the appropriate grid-cell resolution. We draw on geography literature and choose grid cells of 0.125 ° × 0.125 ° resolution (approximately 14 km × 14 km at the equator) based on the geography of point patterns (Boots and Getis 1988). Finally, we aggregate events at the cell-year level over the 2008–2015 period to generate the final dataset. Aggregating events reduces the possibility of measurement errors in the exact location and timing of
Figure 3. The Intensity of LRA-Related Conflict, 1997–2015
Notes: The time series of conflict intensity from the ACLED, UCDP, and LRACT databases. Panel A presents the number of events, while panel B focuses on the number of total fatalities. Vertical dotted lines represent the year in which LRACT data became available. See online Appendix A for further information on the variables.
0 200 400 600 Number of events Panel A. Events 0 500 1,000 1,500 2,000 2,500 Number of fatalities Panel B. Fatalities
ACLED UCDP LRACT
1997 1999 20012003 2005 2007 2009 201120132015 1997 1999 20012003 2005 2007 2009 201120132015
each event. Table 1 presents descriptive statistics of violent events occurring in a given cell, as well as descriptive statistics on radio coverage and characteristics of defection messaging content. The sample includes all cells for the whole period of analysis.15
D. Additional Data
We supplement the database with additional cell-level information on a wide range of variables. Firstly, we exploit satellite-image-based information on income shocks. Following a wide stream of papers, we measure income shocks by com-modity price shocks (Dube and Vargas 2013, Berman et al. 2017). We first select the main cash crops and extractive minerals for each of the four countries that form part of the study area from the CIA World Factbook (CIA 2019). See online Appendix Table B10 for a full list. We construct commodity price shocks by combining the geographical distribution of commodities with yearly commodity-specific price variations in international markets. Following Bazzi and Blattman (2014), we define the price shock for any commodity as the difference in their (log-)prices between times t and t − 1 . Since the area under consideration is not a world-leading producer in any of the considered commodities, international prices are exogenous to local production. To take into account the differences in the extent of crops cultivated within each cell, we multiply the price change with the percentage of the cell histori-cally farmed with each crop. Online Appendix Section B.10 provides further details. Secondly, we collect information on mobile phone coverage and general FM radio coverage. We build cell-level percentage coverage of the GSM (2G) network by using the Collins Mobile Coverage Explorer (GSMA 2012), which provides geo-located information on yearly mobile phone coverage. During the period under analysis, the area of interest is not covered by any of the other types of mobile phone network, such as 3G or 4G. We construct general FM radio coverage from FMLIST (UKW/ TV-Arbeitskreis 2018), an open-source database containing technical data about active FM radio stations from across the world.16 We select radio stations
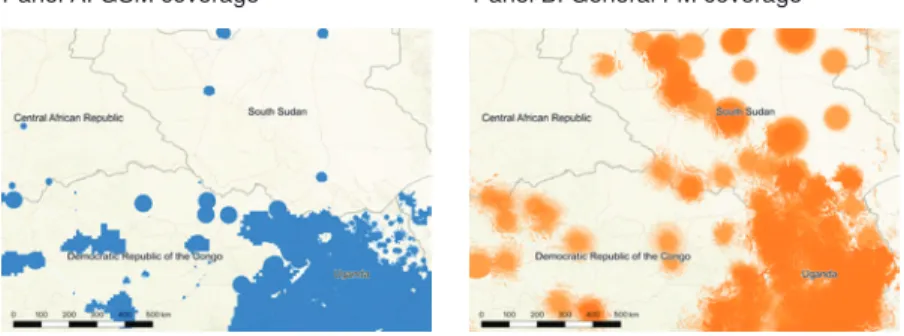
cov-ering the study area (corresponding to more than 500 stations) and use the Longley-Rice/Irregular Terrain Model to compute topography-corrected coverage at the cell level. Figure 4 presents GSM and general FM coverage in the study area. GSM network covers 18 percent of the study area, while alternative FM radios cover 32 percent of the study area. Most of the area experiencing high levels of LRA conflict during the 2008–2015 period is not covered by either GSM or other FM signals. GSM coverage is relatively stable during the period (online Appendix Figure B2).
Finally, we merge the grid dataset with time-varying weather data (rainfall, temperature, and the share of a year experiencing drought) and a number of socioeconomic and geographic indicators. This allows controlling for possible confounders of commodity price shocks and for additional factors potentially
15 We provide a more detailed discussion about the choice of the grid extent and robustness to alternative grid
extents in online Appendix Section B.2, and about the choice of cell resolution, including its effect on main esti-mates, and the modifiable areal unit problem (MAUP) in online Appendix Section B.3. See online Appendix Figure B5 for a graphical representation of the grid resolution.
16 These data are available for only one point in time, corresponding to the moment in which the database is
affecting violence. Online Appendix Section A provides detailed information on the sources and calculations of all variables.
III. Empirical Strategy
To identify the causal effects of radio defection messaging on the LRA con-flict, we rely on three sources of plausibly exogenous variation. First, we exploit local topographic variation as a random determinant of signal reception (see, for instance, Enikolopov, Petrova, and Zhuravskaya 2011; Yanagizawa-Drott 2014; Olken 2009; Adena et al. 2015; DellaVigna et al. 2014). The propaga-tion of FM radio signal depends primarily on the height of the antenna and the power of the transmitter. Without obstacles, the attenuation of the signal is proportional to the square of the distance from the antenna. In the presence of physical obstacles such as hills or mountains, the signal can be physically blocked, creating patterns in the local coverage of the radio signal which are exogenous to local political and socioeconomic conditions or conflict outcomes (see, for instance, online Appendix Figure B1).
Second, given the time-varying nature of the data, we are able to use cell-level fixed effects. This captures all unobserved characteristics of the cell that are invari-ant over time. Importinvari-antly, it eliminates the possibility that at any particular point in time certain cells experience violence either due to their topography or due to other characteristics that do not change over time.
Finally, we strengthen the identification strategy further by looking at the inten-sity of exposure to the messages rather than mere exposure. While exposure refers to the percentage of the cell covered by a radio signal adjusted by topography, intensity takes into account the actual number of minutes of messaging reaching each cell. Exploiting the random overlap of different radio signals, we construct a measure of
Figure 4. Mobile Phone and Alternative FM Radio Coverage
Notes: Panel A plots the coverage of the GSM mobile phone network. Panel B plots the coverage of general FM radio stations which broadcast general content unrelated to defection messaging. GSM network coverage is com-puted for the year 2015 from Coverage Data Collins Bartholomew Ltd. and GSMA 2017. FM coverage is comcom-puted for the year 2017 from the FMLIST database (UKW/ TV-Arbeitskreis 2018). FM coverage is corrected for topog-raphy by using the technical specifications of the radio stations and applying the Longley-Rice/Irregular Terrain Model. The geographic area is restricted to the study area. See online Appendix A for further information on the variables.
Sources: Basemap: Esri (see online Appendix A for details and attributions); graph content produced by the authors.
messaging intensity by summing up the daily exposure from each radio within each cell. We define intensity of messaging by
(1) d m it =
∑
j=1 J
c ijt h jt ,
where c ijt is the percentage of cell i covered by radio j (of a total of J possible radios) at time t , and h jt is the number of minutes of defection messaging broadcast daily by radio j at time t .17 Intensity takes the value 0 if either the cell is not covered by any
defection messaging at a certain point in time or if it is covered by a radio station that is not broadcasting any defection messaging. Figure 5 illustrates how, in the presence of multiple radio stations, topography can generate random differences in the total number of minutes of messaging to which each cell is exposed. Online Appendix Figure B2 plots the evolution of exposure or coverage (left panel) and the intensity (right panel) of defection messaging content over time. Section IVA shows that results are robust to alternative definitions.
To measure the effect of the intensity of defection messaging ( d m it ) on LRA-related conflict outcomes (denoted by y irt , in cell i being part of macro-region r at time t ), we estimate the following model as the benchmark specification:
(2) y irt = γ i + αd m it + 𝐗 ′ β + δ it t M r + u it ,
where 𝐗 it is a vector of cell-level, time-varying characteristics, γ i are cell fixed effects, and u it are idiosyncratic error terms. We rely on Lasso regressions to choose controls 𝐗 it .18 Lasso regressions select shocks to the prices of cotton and groundnut
as the relevant commodity price shocks, as well as rainfall and temperature devia-tions, and the fraction of a year characterized by drought as the other relevant vari-ables. We also include macro-region-specific time fixed effects by dividing the grid into eight macro-regions and introducing interaction terms between the time fixed effects, δ t , and macro-region indicators, M r . In all specifications, we standardize the main independent variable d m it , to ease the interpretation of the coefficient.
The parameter α captures the effect of an increase in the daily intensity of defec-tion messaging at full cell coverage. Since we measure signal coverage corrected for topography, defection messaging intensity is plausibly exogenous to conflict. One possible threat to identification could arise if antennas have been placed endoge-nously to the conflict. This would be the case if antennas have been placed in loca-tions where violence increased (or decreased) and the distance from the antennas hides unobserved determinants of violence. Following Yanagizawa-Drott (2014), we rule out the possibility of endogenous location of antennas by controlling for distance from active antennas and its square. In addition, since multiple antennas might cover a single cell, we also control for the median distance from all active antennas and its square. Since signal strength in a specific cell is also affected by ter-rain ruggedness, we also interact distances with this indicator. We refer to this set of
17 For some stations the frequency of messaging is not daily. In these cases, we computed h
jt by dividing the total broadcast time of defection messaging in a week by 7.
18 Lasso regressions provide objective criteria for covariate selection. Online Appendix Section B.10 provides
controls as the propagation controls. Results are robust to less flexible forms, such as controlling only for the minimum distance from active antennas. In Section IVD, we also discuss the possibility that each radio responded to an expected reduc-tion in violence with increased radio messaging. We do not find evidence of this possibility.19
19 We use Demographic and Health Surveys (DHS) data for DRC and CAR to test whether, in the study area,
preexistent household characteristics correlate with the future intensity of defection messaging in a village. We do not observe any significant effect of future intensity of messaging on preexistent wealth (unavailable for CAR), education, or fertility. This supports the exogeneity of messaging intensity. Due to the sampling strategy of the DHS and the remoteness of the study area, this analysis can be carried out only with a very small number of DHS clusters.
Figure 5. Geographic Distribution of Messaging Intensity
Notes: The geographic distribution of defection messaging intensity (total number of minutes of daily broadcast at full cell coverage) across years. Darker colors represent higher intensity, while lighter colors represent lower inten-sity (with transparent cells showing zero coverage). The cell resolution is 0.125 ° × 0.125 ° (see online Appendix Figure B6 for the grid extent).
Sources: Basemap: Esri (see online Appendix A for details and attributions); graph content produced by the authors.
2010 2011
2012 2013
When estimating equation (2), we are concerned not only about serial correlation of violence within each cell over time, but also about spatial correlation between adjacent cells. We therefore estimate standard errors using the correction outlined by Conley (1999, 2008) and Hsiang (2010).20 We allow for temporal correlation
over the full-time window of the dataset, and spatial correlation across cells within 100 kilometers. Results are robust to alternative cutoffs or assuming clustering at the cell or at the district level (online Appendix Section B.17).
A general drawback of conflict datasets is that events might be more likely to be reported in areas with high media coverage. At the same time, conflict tends to affect media coverage, as reporting from affected areas is more dangerous. Since we are directly interested in coverage, we acknowledge that estimates might contain errors, but we expect that these would only cause an underestimation of the importance of defection messaging (see online Appendix Section B.20 for a more detailed discussion on measurement error). Furthermore, since we cannot directly observe LRA members listening to radio messages, we can interpret estimates as an intention-to-treat effect of defection messaging. However, available qualitative evidence suggests widespread exposure to defection messaging, with the proportion of returnees citing defection messaging as being influential in their decision to return ranging from 67 percent to almost 90 percent (online Appendix Section D, Invisible Children 2013).
IV. Results
A. Effectiveness of Defection Messaging
We start by examining the effects of defection messaging on violent conflict as measured by the number of LRA-related fatalities from three alternative sources of data (Table 2). Columns 1 to 3 use data from the LRACT, ACLED, and UCDP databases (indicated by the column headings). Column 4 combines the three differ-ent sources together by using the mean number of fatalities from across the three datasets as the dependent variable. The results are robust to alternative ways of com-bining the three datasets (online Appendix Section B.20).
In panel A we use the log-transformed number of total fatalities (adding 1 to accommodate zero values) as the dependent variable. Row 1 presents estimates based on the benchmark specification, i.e., equation (2). As explained in Section III, this specification controls for cell and year fixed effects, propagation controls, other time-varying controls, and macro-region-specific time fixed effects. The benchmark estimates show that defection messaging reduces LRA-related fatalities significantly.
The estimate based on the LRACT database suggests that a 1 standard devia-tion increase in messaging intensity reduces the number of fatalities by 2.7 percent. This effect corresponds to 48 minutes of daily messaging at average cell coverage (roughly 40 percent of the cell) or 19 minutes of daily messaging when the cell is fully covered by the radio signal. The result is robust to using data on fatalities from either the ACLED, UCDP, or a combination of the three datasets (columns 2–4). The marginal effect is similar using the UCDP dataset, but somewhat smaller
Table 2—Effect of Defection Messaging on Fatalities
Dependent variable: Number of fatalities linked to LRA activity
Event dataset: LRACT ACLED UCDP Combined
(1) (2) (3) (4)
Panel A. Dependent variable in logs—log(y + 1)
1. Benchmark −0.027 −0.016 −0.025 −0.029
(0.005) (0.002) (0.004) (0.005)
A1. Alternative set of controls
2. Basic controls −0.029 −0.017 −0.026 −0.031
(0.005) (0.002) (0.004) (0.005)
3. Basic and additional controls −0.028 −0.017 −0.026 −0.030
(0.005) (0.002) (0.004) (0.005) 4. Benchmark + variable-specific trends −0.027 −0.016 −0.025 −0.028
(0.005) (0.003) (0.004) (0.005) 5. Benchmark + control for circular coverage −0.028 −0.016 −0.025 −0.029
(0.005) (0.002) (0.004) (0.005)
A2. Alternative measure for messaging
6. Average intensity of messaging −0.012 −0.009 −0.013 −0.014
(0.005) (0.002) (0.003) (0.004) 7. Percent cell covered by defection messaging −0.102 −0.071 −0.101 −0.121
(0.020) (0.013) (0.018) (0.021)
Panel B. Alternative dependent variable
8. log(y + 0.5) −0.034 −0.019 −0.031 −0.036 (0.007) (0.003) (0.005) (0.007) 9. Square root of y −0.044 −0.032 −0.041 −0.046 (0.008) (0.006) (0.007) (0.007) 10. Levels −0.275 −0.326 −0.273 −0.291 (0.068) (0.098) (0.058) (0.061) 11. Extensive margin −0.011 −0.004 −0.009 −0.013 (0.003) (0.001) (0.002) (0.003) Observations 60,600 60,600 60,600 60,600 Number of cells 7,575 7,575 7,575 7,575
Notes: The table reports marginal effects that are estimated using a fixed effects model. Standard errors in parenthe-ses are allowed to be correlated over time and space (Conley 1999, 2008; Hsiang 2010). Unless otherwise specified, the independent variable is always intensity of defection messaging, defined by equation (1), and is standardized. In panel A the dependent variable is the log number of total fatalities (adding 1 unit before taking logarithms to accom-modate zero values). Row 1 controls for cell and year fixed effects, propagation controls (including controls for dis-tance from active antennas in different forms), commodity price shocks, weather shocks, and macro-region-specific time fixed effects (see Section III). Row 2 controls only for cell and year fixed effects. Row 3 adds propagation controls to the controls from row 2. Row 4 reverts to the benchmark specification of row 1, but also includes con-trols for cell-level variable-specific trends for terrain ruggedness, ex ante income (proxied by nightlight), ex ante population, urban area indicators, and country indicators. Row 5 controls for predicted free-space circular cover-age. Rows 6 and 7 use alternative independent variables: average intensity calculated by dividing messaging inten-sity by the number of radio stations messaging in a particular cell (row 6); percentage of cell covered by defection messaging without considering frequency of messaging (row 7). Panel B replicates the benchmark specification from row 1 using alternative functional forms for the dependent variable, as indicated by the row names. Extensive margin refers to a binary 0–1 dependent variable indicating nonzero values of the outcome variable. Columns 1 to 3 use fatalities data from the LRACT, ACLED, and UCDP databases. Column 4 uses the mean number of fatalities from across the three datasets. The time period is restricted to 2008–2015. See online Appendix A for further infor-mation on the variables.
using the ACLED dataset. This possibly reflects the slightly different definitions of the conflict variable across the three datasets. While ACLED and UCDP provide less detailed information about LRA activity and use different definitions of violent events, they corroborate the main results based on the LRACT data.21
Results are robust to a wide range of robustness checks relative to the selection of control variables (panel A1). Row 2 in Table 2 uses a more basic set of controls that includes only cell and year fixed effects. Row 3 enhances this by including the prop-agation controls. Row 4 reverts to the benchmark specification, but also includes controls for variable-specific trends in addition to the controls from the benchmark specification. This specification allows controlling for differential trends associated with potential determinants of conflict, such as cell-level terrain ruggedness, ex ante income (proxied by nightlight), ex ante population, urban area indicators, and coun-try indicators (see online Appendix Section B.4 for more details). Row 5 adds a control for predicted free-space circular coverage of the radio stations undertaking defection messaging. Circular coverage is computed using a free-space propagation model, which captures the attenuation and maximum reach of an audible signal in the absence of obstacles on flat terrain. Adding it as a control allows us to isolate the effects solely due to idiosyncratic variation in topography (Olken 2009). The coeffi-cient on intensity of messaging is not affected by including this control, supporting the hypothesis that topography generates random variation in messaging coverage.
Results are also robust to alternative measures of defection messaging as the independent variable (panel A2). Row 6 uses average intensity, which is calculated by dividing d m it in equation (1) by the number of radio stations messaging in a par-ticular cell. Row 7 abstracts from a measure of intensity by using the percentage of cell covered by defection messaging, without incorporating the frequency (minutes) of messaging. This is similar to the variation exploited by Yanagizawa-Drott (2014). Results remain robust to these alternative definitions. Using the lagged value of intensity of defection messaging rather than the contemporaneous value leads to similar conclusions (online Appendix Section B.6).22
Panel B of Table 2 focuses on alternative functional forms of the dependent vari-able: an alternative log-transformation (adding 0.5 instead of 1 to accommodate zero values), the square root, the number in levels, and a binary variable indicating the presence of fatalities (the extensive margin). Defection messaging continues to reduce LRA-related fatalities significantly regardless of the functional form used to measure the dependent variable. Online Appendix Section B.15 establishes robust-ness of the results to nonlinear estimators, such as fixed effects negative binomial, fixed effects Poisson and fixed effects logistic regressions.23
Table 3 focuses on the effects of defection messaging on the composition and strategic behavior of the LRA. We examine five different outcomes from the LRACT
21 Online Appendix Section B.20 discusses potential sources of measurement error in the dependent variable
and undertakes additional robustness checks to alleviate those concerns.
22 When included together in the same specification, neither the lagged nor the contemporaneous variable stands
out as being more robust than the other. Hence, we continue using the contemporaneous variable as the preferred variable.
23 Results are robust to normalizing the dependent variable by population and area (online Appendix Section
B.5), alternative cell resolutions (online Appendix B.3), using administrative units instead of grid cells (online Appendix B.13). Online Appendix Figure B19 displays the marginal effects of individual radio stations and estab-lishes robustness to excluding one station at a time.
database: the number of returnees (column 1) and abductees (column 2), and the number of events characterized by violence against civilians (column 3), clashes with security forces (column 4), and looting (column 5). The rows follow the same sequence of Table 2. Panel A uses a logarithmic transformation of the dependent
Table 3—Effect of Defection Messaging on Additional Outcomes Related to LRA Violence Number of individuals … Number of events involving …
Returning abductedBeing
Violence against
civilians Clashes Looting
(1) (2) (3) (4) (5)
Panel A. Dependent variable in logs—log(y + 1)
1. Benchmark 0.009 −0.005 −0.010 −0.006 0.016
(0.004) (0.005) (0.004) (0.003) (0.004)
A1. Alternative set of controls
2. Basic controls 0.010 −0.006 −0.010 −0.006 0.017
(0.004) (0.005) (0.004) (0.003) (0.004)
3. Basic and additional controls 0.010 −0.006 −0.010 −0.006 0.016
(0.004) (0.005) (0.004) (0.003) (0.004) 4. Benchmark + variable-specific trends 0.009 −0.005 −0.009 −0.006 0.016
(0.004) (0.005) (0.004) (0.003) (0.004) 5. Benchmark + control for circular coverage 0.009 −0.005 −0.010 −0.006 0.016
(0.004) (0.005) (0.004) (0.003) (0.004)
A2. Alternative measure for messaging
6. Average intensity of messaging 0.007 −0.003 −0.001 0.001 0.008
(0.003) (0.004) (0.003) (0.002) (0.002) 7. Percent cell covered by defection messaging 0.050 −0.020 −0.025 −0.013 0.066
(0.018) (0.022) (0.015) (0.010) (0.016)
Panel B. Alternative dependent variable
8. log(y + 0.5) 0.013 −0.005 −0.013 −0.009 0.023 (0.005) (0.006) (0.006) (0.004) (0.005) 9. Square root of y 0.012 −0.016 −0.012 −0.008 0.021 (0.005) (0.008) (0.006) (0.004) (0.005) 10. Levels 0.026 −0.212 −0.031 −0.012 0.044 (0.015) (0.077) (0.014) (0.006) (0.009) 11. Extensive margin 0.006 0.002 −0.005 −0.006 0.012 (0.003) (0.003) (0.003) (0.003) (0.003) Observations 60,600 60,600 60,600 60,600 60,600 Number of cells 7,575 7,575 7,575 7,575 7,575
Notes: The table reports marginal effects that are estimated using a fixed effects model. Standard errors in parenthe-ses are allowed to be correlated over time and space (Conley 1999, 2008; Hsiang 2010). Unless otherwise specified, the independent variable is always intensity of defection messaging, defined by equation (1), and is standardized. The column headings indicate the dependent variables (based on data from the LRACT database). In panel A we use a logarithmic transformation of the dependent variable (adding 1 unit before taking logarithms to accommodate zero values). Row 1 controls for cell and year fixed effects, propagation controls (including controls for distance from active antennas in different forms, commodity price shocks, weather shocks, and macro-region-specific time fixed effects (see Section III). Row 2 controls only for cell and year fixed effects. Row 3 adds propagation controls to the controls from row 2. Row 4 reverts to the benchmark specification of row 1, but also includes controls for cell-level variable-specific trends for terrain ruggedness, ex ante income (proxied by nightlight), ex ante population, urban area indicators, and country indicators. Row 5 controls for predicted free-space circular coverage. Rows 6 and 7 use alternative independent variables: average intensity calculated by dividing messaging intensity by the number of radio stations messaging in a particular cell (row 6); percentage of cell covered by defection messaging with-out considering frequency of messaging (row 7). Panel B replicates the benchmark specification from row 1 using alternative functional forms for the dependent variable, as indicated by the row names. Extensive margin refers to a binary 0–1 dependent variable indicating non-zero values of the outcome variable. The time period is restricted to 2008–2015. See online Appendix A for further information on the variables.
variable (adding 1 to accommodate 0 values). Row 1 presents the benchmark esti-mates using equation (2). Row 2 restricts the control set to only cell and year fixed effects. Row 3 includes the propagation controls in addition to cell and year fixed effects. Row 4 reverts to the benchmark specification, but also includes controls for variable-specific trends. Row 5 controls for circular coverage of the radio stations. Rows 6 and 7 use alternative measures of exposure to defection messaging. Panel B uses alternative functional forms of the dependent variables. Like in the case of the number of fatalities, online Appendix Table B18 provides estimates using nonlinear estimators, for these outcomes.
A higher intensity of defection messaging leads to a significant increase in the total number of returnees (column 1 of Table 3). According to the benchmark specification, a 1 standard deviation increase in the intensity of defection messaging increases the number of returnees by approximately 1 percent. Defection messag-ing is thus effective in achievmessag-ing its direct objective of encouragmessag-ing LRA members to return to civil society. In online Appendix Section B.7, we undertake additional analysis to understand whether interdependencies between fighters in their decision to return drives the increase in the number of returnees. We do not find evidence of such interdependencies as defection messaging primarily increases events charac-terized by one or two individuals defecting at a time rather than defections involving groups of three or more individuals (online Appendix Table B6).
In contrast to the absence of interdependencies in fighters’ decisions to return, the survey of ex-combatants conducted in DRC provides evidence of interdependencies linked to information transmission (online Appendix D). While 66 percent of the survey respondents had heard defection messages directly themselves, more than 94 percent had been exposed to defection messages through other group members. Since we cannot observe the location and quantity of fighters, and because the LRA units tend to move with some frequency, we cannot empirically test the role of infor-mation spillover among LRA members. While the radio messages reach the individ-ual fighters either directly because they themselves listen to the radio or indirectly from fellow combatants who share the information they have heard on the radio, the final decision to defect is primarily an individual decision.24
Column 2 of Table 3 examines how defection messaging affects the number of abductions by the LRA. Abduction has been a central recruitment strategy through-out the LRA’s history. Estimates suggest that the LRA abducted around 60,000 to 80,000 youths for at least a day between 1995 and 2004. The majority of the vic-tims were adolescents, targeted due to the ease of indoctrinating children (Annan, Blattman, and Horton 2006; Beber and Blattman 2013). The LRA could have responded to the defection messaging-induced loss in manpower by increasing the number of abductions. We do not find evidence for this. If anything, defection mes-saging reduces the number of abductions by the LRA. However, this effect is not statistically significant except for the one specification using abductions in levels as the dependent variable.
24 Online Appendix Section B.7 provides a discussion on why despite receiving information from peers, rebels
still prefer to defect individually rather than in groups. While the detection of any defection plan bears the highest penalties, consuming and sharing defection information, while also proscribed, bears lower penalties. The sharing of information could even conceivably be part of establishing the LRA’s counter-narrative. We also investigate spa-tial spillover of defection messaging, but do not find strong evidence in favor of it (online Appendix Section B.12).