R E S E A R C H A R T I C L E
Open Access
Association between sodium excretion and
hydration status by Free Water Reserve:
a cross-sectional analysis in adolescents
Carla Gonçalves
1*, Sandra Abreu
2, Patrícia Padrão
1,3, Olívia Pinho
1,4, Pedro Graça
1,5, João Breda
6,
Rute Santos
2,7,8and Pedro Moreira
1,2Abstract
Background: Excessive sodium intake is excreted through urine and could affect hydration status. This study aims to describe hydration status in adolescents and to assess the association between hydration status by free water reserve (FWR) and urinary sodium excretion.
Methods: Two hundred participants (118 girls), aged 13–18 years completed the study. Median urinary sodium excretion was measured in one 24-hour collection and was used as a proxy for sodium intake. FWR (measured urine volume minus the obligatory urine volume) was used for characterization of hydration status, and linear regression models were used to evaluate the association between urinary sodium excretion and FWR, adjusted for water and energy intake in boys and carbohydrate, fiber, and water intake in girls.
Results: The participants median urinary sodium excretion was 3645.5 mg/d for boys and 2702.5 mg/d for girls (p < 0.001). Median FWR was positive in both sex groups; however, 40.2 % of boys and 31.4 % of girls (p = 0.195) were at risk of hypo-hydration status. Linear regression models showed that urinary sodium excretion was a significant predictor of FWR for both sexes (Crude Modelβ = 0.114, p = 0.003 for boys and β = 0.160, p < 0.001 for girls; Adjusted Modelβ = 0.120, p = 0.002 for boys and β = 0.142, p < 0.001 for girls).
Conclusions: Nearly one third of subjects were at risk of hypo-hydration. Higher sodium excretion was associated with a better hydration status obtained by FWR. However, as the majority of subjects consume sodium above recommendations, preventive measures to promote better hydration status should focus in increasing the level of total water intake.
Background
The preservation of an adequate hydration status (HS) in adolescents has been recognized as important and related to the ability to regulate body temperature and cognitive performance [1]. Although population-representative data on urine osmolality are scarce, existing data suggest that cell dehydration may be prevalent in healthy, free-living children at school [1, 2]. They could even be in a state of chronic voluntary dehydration [3]. Water intake could be suboptimal in some segments of the population such as adolescent boys and elderly [4].
HS can be accessed through subjective observations and by objective non-invasive measurements [5]. The subject-ive observations, such as skin turgor or thirst sensation, have been described as less reliable than objective labora-torial measurements due to the lack of consistency of measurements among measurers [5]. Current evidence suggest that urine indices are more sensitive than other methods; particularly osmolality as been recognized as one of the most accurate means to assess an individual’s hydration status [5, 6]. However, osmolality is a measure of concentration and a new and suitable quantitative measure of individual 24-hour euhydration status was developed, using the concept of free water reserve (FWR), which corresponds to the difference between the mea-sured urine volume and the ideal urine volume necessary to excrete the actual 24-hour urine solutes at the mean 2 * Correspondence:[email protected]
1
Faculty of Nutrition and Food Sciences, University of Porto, Rua Roberto Frias, 4200-465 Porto, Portugal
Full list of author information is available at the end of the article
© 2015 Gonçalves et al.Open AccessThis article is distributed under the terms of the Creative Commons Attribution 4.0 International License (http://creativecommons.org/licenses/by/4.0/), which permits unrestricted use, distribution, and reproduction in any medium, provided you give appropriate credit to the original author(s) and the source, provide a link to the Creative Commons license, and indicate if changes were made. The Creative Commons Public Domain Dedication waiver (http://creativecommons.org/publicdomain/zero/1.0/) applies to the data made available in this article, unless otherwise stated.
standard deviation value of maximum urine osmolality (Uosm) [6].
The identification of the determinants of HS is crucial. Unfortunately, data on this topic is scarce, particularly regarding the impact of other nutrients besides water intake on hydration physiology [7]. The HS is mainly in-fluenced by water [6], which may be obtained by drink-ing water and other beverages as well as from moisture content in food [8, 9]. To prevent dehydration, humans have a sensitive network of physiological controls to maintain body water and fluid intake by thirst [10], and this homeostatic mechanism is triggered by the ingestion of dietary salt [11, 12].
Salt intake (sodium chloride) is a major factor in con-trolling urinary volume, which is significantly related to urinary sodium excretion [13]. Where salt intake increases there is an increase in both plasma sodium concentration and plasma osmolality [14, 15]. Sodium accounts for more than 90 % of all osmotically-active extracellular fluid solutes and is the major determinant of plasma volume. Plasma volume variation stimulates extra-renal and intra-renal sensors that segregate antidiuretic hormone. This hormone regulates plasma volume by adjusting sodium and water excretion in urine in order to maintain normal concentrations of sodium [14].
Plasma osmolality variations also stimulate thirst, a subjective perception that provides the stimulus to drink fluids due to a neural mechanisms activated by cellular dehydration [11, 16]. The expressions of thirst have been characterized as a combination of sensations that in-crease with dehydration and dein-crease with rehydration (that is, restoration of fluid balance) [17]. Salt intake is a major factor in controlling urinary volume and therefore fluid intake [13].
High salt intake can result in renal excretion of water [18, 19], since the excretion of excess sodium requires excretion of water through urine [8] and could affect the hydration status of children and adolescents.
In fact, children have less surface area-to-mass ratio for evaporative cooling, are less inclined to replace fluids, and therefore are especially susceptible to dehydration. Few studies have evaluated the impact of sodium intake (assessed by urinary sodium excretion) on hydration sta-tus. Ute et al. aimed to answer this question with German adolescents and reported that the children’s hydration status was not affected by salt intake perhaps due to a compensatory increase in beverage consumption [8]. Our study was performed with adolescents from Portugal, a southern European country with Mediterranean climate, characterized by a temperate climate with a dry season in summer. Temperature was an important differentiating factor that could produce different results due to the warmer climate than was experienced by German adoles-cents. The Mediterranean climate could lead to water loss
by sweat and increased need for fluid intake to replenish hydration status.
Therefore, the aim of this study was (a) to describe the hydration status in a sample of healthy Portuguese adoles-cents and (b) to assess the association between urinary sodium excretion and hydration status by FWR in this sample.
Methods
Study design and sampling
Data from this cross-sectional study resulted from LabMed Physical Activity Study (Longitudinal Analysis of Bio-Markers and Environmental Determinants of Physical Activity).
For the present study we assessed a sub-sample of 250 adolescents who were willing to participate, aged between 13 and 18 years, from schools in Braga district, with uri-nary excretion data collected across two time blocks, September 2012–April 2013 and September 2013–April 2014, excluding the warmer months of the year.
Quality control was used by calculating 24-hour urinary creatinine excretion in relation to body weight according to age group [20] and incomplete urine collections were repeated; subjects that had felt ill, had reported renal problems or took drugs in the day of collection were also not included for the present analysis (rejected n = 50, 20 %). Therefore, the final sample comprised 200 adoles-cents (82 boys) with valid urine collection and corre-sponding dietary recall.
The study was conducted according to the guidelines laid down in the Declaration of Helsinki and all proce-dures involving human participants were approved by the Ethical Commission of University of Porto. Written informed consent was obtained from all participants and caregivers.
Urine sampling and hydration markers
Participants and caregivers received oral and written instructions on how to collect complete 24-hour urine samples. All participants were instructed to discard the first morning void and to collect all urine over the following 24-hour including the first void on the follow-ing mornfollow-ing, the time of the start and finish collection was asked to be recorded in a questionnaire. During the collection period, subjects were asked to store collected urine in a cool place. All samples were sent to a certified laboratory to be analyzed sodium and potassium by indirect ion-selective electrodes methodology (Siemens Advia 1800), creatinine by Jaffé reaction (Siemens Advia 1650) and osmolality by sum of solute particles (exoci-nase method and Siemens Advia 1650/1800 equipment). Urine samples were analyzed for urinary creatinine (mg/ day), and urinary sodium (mEq/day); sodium excretion was reported in mEq/day, however, for comparative
purposes, it was converted to mg/day by using the molecular weight of sodium. Estimated salt intake was calculated from analyzed (24 h urine) sodium excretion (1 g salt = 393 mg sodium).
Hydration status was assessed using urinary markers, namely 24-hour urinary volume (mL), 24-hour Uosm (mOsm/kg), and FWR (ml/24 h) as determined and described previously [21]. Since concentration ability decreases not until age of 20 [6, 22], 830 mosm/1000 g is the mean maximum urine osmolality used to establish FWR in adolescents [8]. Positive values of FWR indicate euhydration, negative values the risk of hypo-hydration [21]. Risk of hypo-hydration correspond to the Uosm mean - 2 SD of maximum Uosm, and euhydration to
Uosm between the mean−2 SD of maximum Uosm and
the mean + 2 SD of minimum Uosm [21].
Dietary survey
A 24 h dietary recall referring to the day of the urine collection was collected by trained interviewers using photo book and household measures to quantify portion sizes [23]. Energy and nutritional intake were estimated using an adapted Portuguese version of the nutritional analysis software Food Processor Plus (ESHA Research Inc., Salem, OR, USA). The nutrient content of basic food was taken from standard nutrient tables, whereas the content of commercial food, e.g. pizza, ready-to-eat-food was derived from labelled ingredients and nutri-ents. Water from solid and fluid foods (total water in g per day), recorded from the 24 h dietary recall, was calculated using data from the Food Processor Plus (ESHA Research Inc., Salem, OR, USA).
Anthropometric measures
Height was measured to the nearest millimeter in bare or stocking feet with the adolescents standing upright against a stadiometer (Crymych, Pembrokeshire, UK). Weight was measured to the nearest 0.10 kg, with ado-lescents lightly dressed using portable electronic weight scale (Tanita Inner Scan BC 532, Tokyo, Japan). Body mass index (BMI) was calculated as weight (kg) divided by square height (m2), and participants were classified according to World Health Organization (WHO) BMI reference values [24], in normal weight, overweight, and obesity. Underweight subject (n = 1) was combined with subjects in the normal weight category, due to the fact that represented a very small proportion of the sample.
Physical activity
Physical activity and participation in sports were mea-sured by means of a short self-report questionnaire that was administered individually [25]. The answers were coded from 1 to 3, 1 representing inactivity or very low activity, 2 moderately intensive or frequent activity, and 3
frequent or vigorous activity. The physical activity ques-tionnaire consisted of questions concerning frequency of physical activity, intensity of physical activity, frequency of vigorous physical activity, hours spent on vigorous phys-ical activity, average duration of a physphys-ical activity session, and participation in organized physical activity. After coding, a sum index of physical activity was calculated.
Socioeconomic status
As an indicator of the socioeconomic status of the house-hold, the Family Affluence Scale (FAS) was used (which ranged from 0 to 9 points, being higher socioeconomic status corresponding to highest score) [26]. The FAS is a four-item questionnaire that helps students report their family income objectively: It evaluates the sum of scores regarding whether the family owns a car, whether the student has his/her own bedroom, the number of family vacations during the past 12 months, and the number of computers the family owns. FAS was used as a continuous variable as well due by other authors in a number of analyses focusing on health gradients [26–28].
Statistical analysis
The Kolmogorov-Smirnov test was used to assess the assumption of normality. Independent samples T-test or Mann–Whitney U test were performed to compare continuous variables and the χ2 test was used for cat-egorical variables to assess differences between sample characteristics, dietary and nutritional data and urinary data stratified by sex.
Receiver operating characteristic (ROC) curves were used to analyse the potential diagnostic accuracy of so-dium excretion to identify adolescents with low hydration status and to find the best trade-off between sensitivity and specificity. The area under the ROC curve (AUC) represents the ability of the test to correctly classify the participants with euhydrated status and risk of hypo-hydration. AUC values range between 1 (a perfect test) and 0.5 (a inadequate test).
Spearman's rank correlation coefficient was performed to assess the relationship between sodium excretion (mg/d) and urinary volume (ml/d), Uosm (mosm/kg), and FWR (ml/d). Kruskal–Wallis one-way analysis of variance and Mann–Whitney U test were used to iden-tify differences for sodium excretion grouped by quartiles and by below or at above the upper limit recommendation (2000 mg/d), respectively.
Linear regression was used to estimate the association between the 24-hour urinary sodium excretion and the FWR. There were no interactions for sex x FWR (p-value for interaction = 0.420), however data from girls and boys were analyzed separately based on the existing sex differ-ences in Uosm [29]. The following variables were consid-ered as potential covariates of FWR: BMI, energy intake
(kcal/d), carbohydrate intake (% energy), fat intake (% energy), protein intake (% energy) and total water intake (g/d resulted from beverages and solid foods ingested), socio-economic status and physical activity. All variables were initially tested simultaneously, and after only those variables that significantly predicted the FWR (p < 0.05) and substantially modified the coefficient of sodium excre-tion (mg/d) by 10 % were included in the models. The crude model– Model 1, included FWR as dependent con-tinuous variable and sodium excretion as the independent variable. For boys the adjusted model– Model 2, included FWR as dependent variable and sodium excretion, energy, total water intake. For girls the adjusted model– Model 2 included FWR as dependent variable and sodium excre-tion, energy, fiber (g/1000 kcal), carbohydrate intake % energy and total water intake as independent variables.
Data were analysed using IBM Statistics for Windows, Version 21.0 (Armonk, NY: IBM Corp) and Med Calc software v.10.4.5 (MedCalc Software, Mariakerke, Belgium).
A p-value <0.05 was considered to indicate statistical sig-nificance. In this report, descriptive analysis is presented in terms of median and interquartile range, unless otherwise stated.
Sample size was calculated a priori for linear regression model considering 4 predictors. For a power sample≥ 80 %, a medium effect size (f2= 0.15) and α = 0.05 we had to enrol 85 subjects. Additionally since in boys the sample was lower than 85, we performed a post-hoc test to assess the power sample. According to the linear regression model results andα = 0.05 power sample was higher than 80 %. Results
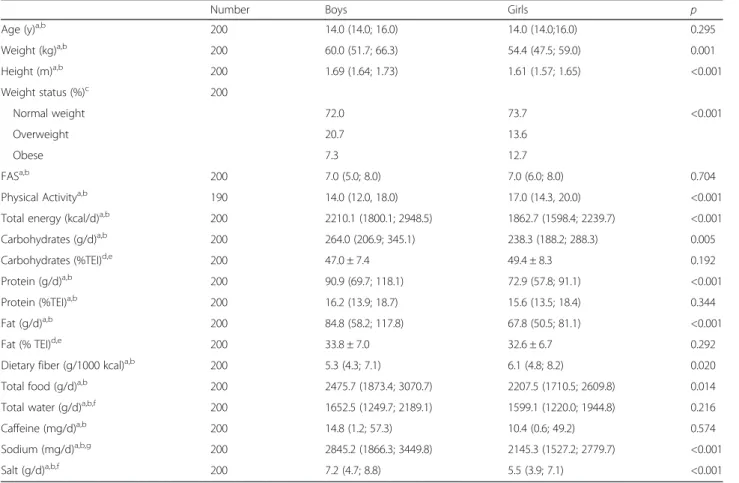
Descriptive and nutritional characteristics of the partici-pants based on dietary records are present in Table 1.
Table 2 shows data from urinary collection. Urinary volume and Uosm does not differ significantly between boys and girls. Median urinary sodium excretion was 3645.5 mg/d for boys and 2702.5 mg/d for girls (p < 0.001).
Table 1 Descriptive and nutritional characteristics of the participants by sex
Number Boys Girls p
Age (y)a,b 200 14.0 (14.0; 16.0) 14.0 (14.0;16.0) 0.295
Weight (kg)a,b 200 60.0 (51.7; 66.3) 54.4 (47.5; 59.0) 0.001 Height (m)a,b 200 1.69 (1.64; 1.73) 1.61 (1.57; 1.65) <0.001 Weight status (%)c 200 Normal weight 72.0 73.7 <0.001 Overweight 20.7 13.6 Obese 7.3 12.7 FASa,b 200 7.0 (5.0; 8.0) 7.0 (6.0; 8.0) 0.704
Physical Activitya,b 190 14.0 (12.0, 18.0) 17.0 (14.3, 20.0) <0.001
Total energy (kcal/d)a,b 200 2210.1 (1800.1; 2948.5) 1862.7 (1598.4; 2239.7) <0.001
Carbohydrates (g/d)a,b 200 264.0 (206.9; 345.1) 238.3 (188.2; 288.3) 0.005
Carbohydrates (%TEI)d,e 200 47.0 ± 7.4 49.4 ± 8.3 0.192
Protein (g/d)a,b 200 90.9 (69.7; 118.1) 72.9 (57.8; 91.1) <0.001
Protein (%TEI)a,b 200 16.2 (13.9; 18.7) 15.6 (13.5; 18.4) 0.344
Fat (g/d)a,b 200 84.8 (58.2; 117.8) 67.8 (50.5; 81.1) <0.001
Fat (% TEI)d,e 200 33.8 ± 7.0 32.6 ± 6.7 0.292
Dietary fiber (g/1000 kcal)a,b 200 5.3 (4.3; 7.1) 6.1 (4.8; 8.2) 0.020
Total food (g/d)a,b 200 2475.7 (1873.4; 3070.7) 2207.5 (1710.5; 2609.8) 0.014
Total water (g/d)a,b,f 200 1652.5 (1249.7; 2189.1) 1599.1 (1220.0; 1944.8) 0.216
Caffeine (mg/d)a,b 200 14.8 (1.2; 57.3) 10.4 (0.6; 49.2) 0.574
Sodium (mg/d)a,b,g 200 2845.2 (1866.3; 3449.8) 2145.3 (1527.2; 2779.7) <0.001
Salt (g/d)a,b,f 200 7.2 (4.7; 8.8) 5.5 (3.9; 7.1) <0.001
TEI Total Energy Intake, FAS Family Affluence Scale
a
Values are medians (P25; P75)
bBetween-sex analysis by Mann–Whitney U test c
Analysis byχ2 for categorical variables
d
Values are means ± SD
e
Analysis by Student t test for continuous variables
f
Water from foods, beverages and metabolic water
g
Median FWR was positive in both sex groups however, 40.2 % of boys and 31.4 % of girls was at risk of hypo-hydration status.
For the whole sample, ROC analysis showed that sodium excretion has a predictive ability to discriminate subjects at risk of hypo-hydration from euhydrated subjects (AUC = 0.65, 95 % CI: 0.582–0.718, p = 0.005; sensitivity = 50.6 % and specificity = 76.5 %) Corresponding values for girls and boys were: boys AUC = 0.73, 95 % CI: 0.617–0.819, p = 0.020 (sensitivity = 67.6 % and specificity = 75.0 %), and girls AUC = 0.65, 95 % CI = 0.554–0.733, p = 0.021 (sensi-tivity = 54.4 % and specificity = 76.9 %).
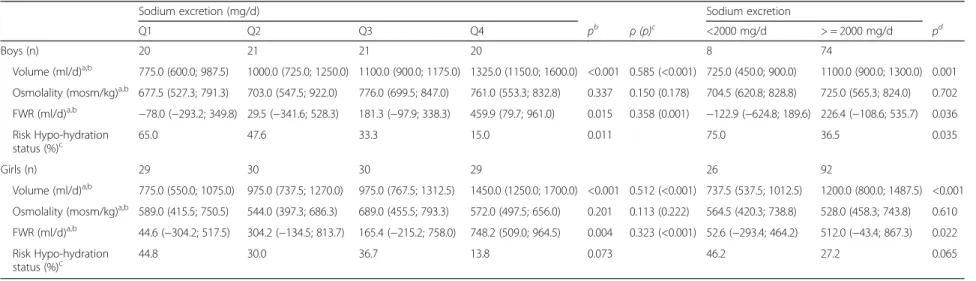
In Table 3 it can be seen that urinary volume and FWR were positively correlated with urinary sodium ex-cretion in both boys and girls respectively. Boys and girls in the category of sodium excretion above upper limit for sodium intake recommendations (78.0 % of girls and 90.2 % of boys) had higher mean values for urinary volume and FWR than the category with less 2000 mg/d of sodium excretion.
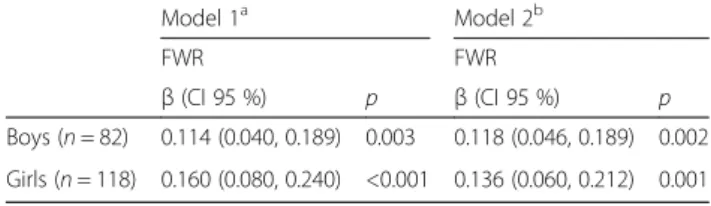
Two linear regression analysis models (crude and ad-justed) were used to describe the relationship between urinary sodium excretion and FWR for boys and girls (Table 4). Both models clearly showed a significant and positive association between urinary sodium excretion and FWR in boys (crude modelβ = 0.114, p = 0.003 and adjusted model β = 0.118, p = 0.002) and girls (crude modelβ = 0.160, p < 0.001 and adjusted model β = 0.129, p = 0.001).
Discussion
To our knowledge, this is the first study examining cross-sectional associations between urinary sodium excretion and FWR in adolescents from a southern European country. Our results show that about 40 % of boys and one third of girls were at risk of hypo-hydration status.
And, urinary sodium excretion was a significant inde-pendent predictor of FWR for both sexes. Suggesting that a high-sodium diet was associated with a better hydration status in adolescents, assuming that all sodium excreted through urine came from diet.
Data on 24-hour urinary sodium excretion in children and adolescents, the best marker for sodium intake, is scarce. Our results show that in this sample of adoles-cents, salt intake is high; median sodium intake was 3645.5 mg/d in boys and 2702.5 mg/d in girls (p < 0.001), thereby exceeding maximum daily intake recommenda-tions of 2300 mg/d [30] and WHO recommendarecommenda-tions of 2000 mg/d [31]. Our findings show that sample salt inges-tion (median salt intake 9.3 g/d in boys and 6.9 g/d in girls) of these adolescent’s was slightly higher than the values found in Portuguese children aged 10–12 years old, whose mean salt intake was 7.8 ± 2.5 g/d [32].
In our study, no significant sex differences were ob-served in urine Uosm (p = 0.247) and elevated Uosm defined as over 800 mmol/kg [33] was verified in 16.1 % of girls and 37.8 % of boys. In industrialized countries, a sex difference in Uosm is common, however, it is not a universal finding. Males have been commonly shown to have higher Uosm than females [6]. In the United States, adolescents have been found to display Uosm values simi-lar to ours (649 mosm/kg for boys and 540 mosm/kg for girls) but with significant sex differences [34]. A German study found higher Uosm in boys than girls, leading the authors to suggest that sex difference in Uosm could be caused by a higher water density of ingested food (ml/ kcal) and a lower insensible water loss (ml/kcal) in girls than boys [29].
We use FWR to categorize the hydration status of par-ticipants because it was been defined as a suitable quanti-tative measure of individual 24-hour euhydration [6]. Our results indicate that 40.2 % of boys and 31.4 % of girls
Table 2 Urinary data on sodium excretion and hydration status (13–18 years)a
Boys Girls p Creatinine (mg/d)a,b 1440.0 (1164.5; 1717.0) 1094.0 (978.0; 1238.5) <0.001 Volume (ml/d)a,b 1100.0 (837.5; 1300.0) 1025.0 (700.0; 1412.5) 0.923 Osmolality (mosm/kg)c,d 715.7 ± 172.3 597.42 ± 193.1 0.247 FWR (ml/d)a,b 173.2 (−137.5; 509.2) 373.2 (−105.7; 832.1) 0.059 Euhydration status (%)e 59.8 68.6 0.195
Risk of Hypohydration status (%)e 40.2 31.4
Sodium (mEq/d)a,b 158.5 (114.5; 197.8) 117.5 (95.5; 159.5) <0.001
Sodium (mg/d)a,b,f 3645.5 (2633.5; 4548.3) 2702.5 (2196.5; 3668.5) <0.001
Salt intake estimation (g/d)a,b,f 9.3 (6.7; 11.6) 6.9 (5.6; 9.3) <0.001
a
Values are medians (quartile 1 and quartile 3)
b
Analysis by Mann–Whitney U test
c
Values are means ± SD
d
Analysis by Student t test for continuous variables
e
Analysis byχ2 for categorical variables
f
Table 3 Hydration status indicators and its relation to sodium excretion divided in quartiles and according to upper limit recommendation (2000 mg/d) and by sexa
Sodium excretion (mg/d) Sodium excretion
Q1 Q2 Q3 Q4 pb ρ (p)c <2000 mg/d > = 2000 mg/d pd
Boys (n) 20 21 21 20 8 74
Volume (ml/d)a,b 775.0 (600.0; 987.5) 1000.0 (725.0; 1250.0) 1100.0 (900.0; 1175.0) 1325.0 (1150.0; 1600.0) <0.001 0.585 (<0.001) 725.0 (450.0; 900.0) 1100.0 (900.0; 1300.0) 0.001
Osmolality (mosm/kg)a,b 677.5 (527.3; 791.3) 703.0 (547.5; 922.0) 776.0 (699.5; 847.0) 761.0 (553.3; 832.8) 0.337 0.150 (0.178) 704.5 (620.8; 828.8) 725.0 (565.3; 824.0) 0.702
FWR (ml/d)a,b −78.0 (−293.2; 349.8) 29.5 (−341.6; 528.3) 181.3 (−97.9; 338.3) 459.9 (79.7; 961.0) 0.015 0.358 (0.001) −122.9 (−624.8; 189.6) 226.4 (−108.6; 535.7) 0.036 Risk Hypo-hydration status (%)c 65.0 47.6 33.3 15.0 0.011 75.0 36.5 0.035 Girls (n) 29 30 30 29 26 92 Volume (ml/d)a,b 775.0 (550.0; 1075.0) 975.0 (737.5; 1270.0) 975.0 (767.5; 1312.5) 1450.0 (1250.0; 1700.0) <0.001 0.512 (<0.001) 737.5 (537.5; 1012.5) 1200.0 (800.0; 1487.5) <0.001 Osmolality (mosm/kg)a,b 589.0 (415.5; 750.5) 544.0 (397.3; 686.3) 689.0 (455.5; 793.3) 572.0 (497.5; 656.0) 0.201 0.113 (0.222) 564.5 (420.3; 738.8) 528.0 (458.3; 743.8) 0.610 FWR (ml/d)a,b 44.6 (−304.2; 517.5) 304.2 (−134.5; 813.7) 165.4 (−215.2; 758.0) 748.2 (509.0; 964.5) 0.004 0.323 (<0.001) 52.6 (−293.4; 464.2) 512.0 (−43.4; 867.3) 0.022 Risk Hypo-hydration
status (%)c 44.8 30.0 36.7 13.8 0.073 46.2 27.2 0.065
a
Values are median (percentile 25; percentile 75)
b
Analysis by Kruskal Wallis
c
Spearman correlation test
d
Analysis by Mann–Whitney U test
et al. BMC Nutrition (2015) 1:17 Page 6 of 8
were at risk of hypo-hydration status and the median was positive in both sexes. Similar results were found in the DONALD Study, which found that FWR increased signifi-cantly with age in both boys and girls [8].
Our study indicates that 24-hour urinary sodium excre-tion positively affects hydraexcre-tion status measured by FWR in both sexes, suggesting that adolescents probably com-pensate the high sodium intake with greater fluid inges-tion. Alexy et al. [8], in a sample of healthy adolescents, showed a positive association between sodium excretion and FWR in girls, although hydration status was not significantly affected by salt intake in boys. Our results suggest that total body water was replaced faster than it was lost by adolescents. Ingestion of more salt seems to particularly stimulate regulatory mechanisms that main-tain plasma volume, provided that exogenous fluid intake increases proportionally to water lost.
The association between salt intake and hydration sta-tus is not observed across all age groups. In a study of Portuguese community-dwelling elderly people, higher sodium intake was associated with a poorer hydration status. This difference to our results may be explained by the lower ability of elderly people to compensate their higher sodium intake with increasing fluid intake [35].
In our study, the male euhydrated participants con-sumed more water (p = 0.009) and female euhydrated sub-jects consumed more hot beverages (p = 0.023) (data not shown). According to our knowledge of adolescents’ bev-erage intake across Europe, water is the largest contributor to fluid consumption followed by sugar-sweetened bever-ages [36]. He et al. [37] demonstrated that during child-hood, salt is a major determinant of fluid consumption including sugar-sweetened soft drinks; however, we did not found an association between salt intake and sugar-sweetened soft drinks consumption (data not shown).
According to Table 3, urinary sodium excretion is associated with the FWR and the subjects of the upper quartiles of sodium excretion have higher value of FWR. Such that, subjects that ingest salt above maximum daily intake recommendations had a better median hydration state, however, 25 % of subjects in this category have a negative value of FWR which means that they are at risk
of hypo-hydration. Thus, it seems that the total fluid intake was not sufficient to compensate water losses in these individuals. Therefore, total water intake should be promoted as a strategy to improve the hydration status concomitantly with reductions in sodium intake to minimize its negative impact on other health outcomes, such as hypertension [31].
Our findings should be interpreted taking into account the study’s limitations and strengths. A major strength of this study was the sample size and high quality of dietary record and urine collections. Indeed data on 24-hour urin-ary excretion in adolescents are scarce. Our rejection of 50 incomplete urinary collections (20 %) was similar to other studies [8, 38] and indicates good compliance.
One limitation of this study was that subjects were not randomly selected from the general population but were recruited from LabMed Study participants. Also, we collected one urine specimen per subject and therefore long-term extrapolation on hydration status cannot be draw. However, other studies have evaluated hydration by this method since water balance is regulated over 24-hour periods [30].
Conclusions
Over one-third of adolescents were at risk of hypo-hydration. Higher sodium excretion was associated with a better hydration status assessed by FWR in this sample of adolescents. Nevertheless, the majority of subjects con-sume sodium above recommendations, thus preventive measures to promote better hydration status should focus in increasing the level of total water intake.
Abbreviations
HS:Hydration status; FWR: Free Water Reserve; FAS: Family Affluence Scale; BMI: Body mass index; WHO: World Health Organization; Uosm: Urinary osmolality.
Competing interests
The authors declare that they have no competing interests.
Authors’ contributions
CG, SA, RS and PM were responsible for the conception and design of the study; CG, SA and RS were responsible for the collection of data; CG, SA, PP, OP, PG, JB, RS and PM were responsible for data interpretation; CG draft the manuscript and all the authors reviewed and approved the final version of the manuscript.
Acknowledgements
The participation of all adolescents, their parents and schools in LabMed Study is gratefully acknowledged.
Disclaimer
João Breda is a staff member of the World Health Organization. The authors are responsible for the content and writing of this paper, which does not necessarily represent the decisions, stated policy or views of the World Health Organization.
Financial support
This study was supported by WHO and FCT grants: PTDC/DES/116586/2010 and BPD/102381/2014. The Research Centre on Physical Activity Health and Leisure (CIAFEL) is supported by UID/DTP/00617/2013.
Table 4 Multivariate regression models predicting FWR (ml/day) by daily sodium excretion (mg/d) stratified by sex
Model 1a Model 2b FWR FWR β (CI 95 %) p β (CI 95 %) p Boys (n = 82) 0.114 (0.040, 0.189) 0.003 0.118 (0.046, 0.189) 0.002 Girls (n = 118) 0.160 (0.080, 0.240) <0.001 0.136 (0.060, 0.212) 0.001 a
Model 1– unadjusted model
b
Model 2– model 1 additionally adjusted for total water intake and energy intake (for boys) and carbohydrate intake (% energy), fiber (g/100 g energy) and total water intake (for girls)
Author details
1
Faculty of Nutrition and Food Sciences, University of Porto, Rua Roberto Frias, 4200-465 Porto, Portugal.2Research Centre in Physical Activity, Health and Leisure, Faculty of Sport, University of Porto, Porto, Portugal.3EPIUnit– Institute of Public Health, University of Porto, Porto, Portugal.4LAQV, REQUIMTE, Laboratory of Bromatology and Hydrology, Department of Chemistry, Faculty of Pharmacy, University of Porto, Porto, Portugal. 5
Directorate General of Health, Lisbon, Portugal.6Noncommunicable Diseases and Life-Course, World Health Organization Regional Office for Europe, UN City, Marmorvej 51, DK-2100 Copenhagen, Denmark.7Instituto Universitário da Maia, Maia, Portugal.8Early Start Research Institute, School of Education, Faculty of Social Sciences, University of Wollongong, Wollongong, Australia.
Received: 8 June 2015 Accepted: 14 August 2015
References
1. Edmonds CJ, Burford D. Should children drink more water?: the effects of drinking water on cognition in children. Appetite. 2009;52(3):776–9. 2. Assael BM, Cipolli M, Meneghelli I, Passiu M, Cordioli S, Tridello G, et al.
Italian Children Go to School with a Hydration Deficit. J Nutr Disord Ther. 2012;2(3):6.
3. Bar-David Y, Urkin J, Kozminsky E. The effect of voluntary dehydration on cognitive functions of elementary school children. Acta Paediatr. 2005;94(11):1667–73.
4. Padez C, Padrão P, Macedo A, Santos A, Gonçalves N. Caracterização do aporte hidrico dos portugueses. Nutrícias. 2009;9:24–7.
5. Shirreffs SM. Markers of hydration status. Eur J Clin Nutr. 2003;57(S2):S6–9. 6. Manz F, Wentz A. 24-h hydration status: parameters, epidemiology and
recommendations. Eur J Clin Nutr. 2003;57:S10–8.
7. Perrier E, Vergne S, Klein A, Poupin M, Rondeau P, Le Bellego L, et al. Hydration biomarkers in free-living adults with different levels of habitual fluid consumption. Br J Nutr. 2012;1(1):1–10.
8. Alexy U, Cheng G, Libuda L, Hilbig A, Kersting M. 24h-Sodium excretion and hydration status in children and adolescents - Results of the DONALD Study. J Clin Nutr. 2012;31(1):78–84.
9. Stahl A, Kroke A, Bolzenius K, Manz F. Relation between hydration status in children and their dietary profile–results from the DONALD study. Eur J Clin Nutr. 2007;61(12):1386–92.
10. Popkin BM, D'Anci KE, Rosenberg IH. Water, hydration, and health. Nutr Rev. 2010;68(8):439–58.
11. McKinley MJ, Johnson AK. The physiological regulation of thirst and fluid intake. News Physiol Sci. 2004;19:1–6.
12. Stachenfeld NS. Acute effects of sodium ingestion on thirst and cardiovascular function. Curr Sports Med Rep. 2008;7(4 Suppl):S7–13. 13. He FJ, Markandu ND, Sagnella GA, MacGregor GA. Effect of salt intake on
renal excretion of water in humans. Hypertension. 2001;38(3):317–20. 14. Candela L, Yucha C. Renal regulation of extracellular fluid volume and
osmolality. Nephrol Nurs J. 2003;31(4):397–404. 444; quiz 405–396. 15. Sirota JC, Berl T. Physiology of Water Balance and Pathophysiology of
Hyponatremia. In: Hyponatremia. edn. New York, United States: Springer; 2013. p. 23–49.
16. Stricker EM, Hoffmann ML. Presystemic signals in the control of thirst, salt appetite, and vasopressin secretion. Physiol Behav. 2007;91(4):404–12. 17. Kenney WL, Chiu P. Influence of age on thirst and fluid intake. Med Sci
Sports Exerc. 2001;33(9):1524–32.
18. Cowley Jr AW, Skelton MM, Merrill DC, Quillen Jr EW, Switzer SJ. Influence of daily sodium intake on vasopressin secretion and drinking in dogs. Am J Physiol. 1983;245(6):R860–872.
19. He FJ, MacGregor GA. A comprehensive review on salt and health and current experience of worldwide salt reduction programmes. J Hum Hypertens. 2009;23(6):363–84.
20. Remer T, Neubert A, Maser-Gluth C. Anthropometry-based reference values for 24-h urinary creatinine excretion during growth and their use in endocrine and nutritional research. Am J Clin Nutr. 2002;75(3):561–9. 21. Manz F, Wentz A, Sichert-Hellert W. The most essential nutrient: defining the
adequate intake of water. J Pediatr. 2002;141(4):587–92.
22. Manz F, Johner SA, Wentz A, Boeing H, Remer T. Water balance throughout the adult life span in a German population. Br J Nutr. 2012;107(11):1673–81.
23. Marques M, Pinho O, Almeida MDV. Manual de quantificação de alimentos. Porto: Rocha/artes gráficas, lda; 1996.
24. de Onis M, Habicht J-P. Anthropometric reference data for international use: recommendations from a World Health Organization Expert Committee. Am J Clin Nutr. 1996;64(4):650–8.
25. Telama R, Yang X, Viikari J, Välimäki I, Wanne O, Raitakari O. Physical activity from childhood to adulthood: a 21-year tracking study. Am J Prev Med. 2005;28(3):267–73.
26. Currie C, Molcho M, Boyce W, Holstein B, Torsheim T, Richter M. Researching health inequalities in adolescents: the development of the Health Behaviour in School-Aged Children (HBSC) family affluence scale. Soc Sci Med. 2008;66(6):1429–36.
27. Due P, Holstein BE, Lynch J, Diderichsen F, Gabhain SN, Scheidt P, et al. Bullying and symptoms among school-aged children: international comparative cross sectional study in 28 countries. Eur J Public Health. 2005;15(2):128–32.
28. Koller T, Morgan A, Guerreiro A, Currie C, Ziglio E. Addressing the socioeconomic determinants of adolescent health: experiences from the WHO/HBSC Forum 2007. Int J Public Health. 2009;54 Suppl 2:278–84. 29. Ebner A, Manz F. Sex difference of urinary osmolality in German children.
Am J Nephrol. 2002;22(4):352–5.
30. Institute of Medicine Food and Nutrition Board. Dietary Reference Intakes for Water, Potassium, Sodium Chloride, and Sulfate. Washington, DC: National Academies Press; 2005.
31. World Health Organization. Guideline: Sodium intake for adults and children. Geneva, Switzerland: World Health Organization; 2012. 32. Cotter J, Cotter MJ, Oliveira P, Cunha P, Polonia J. Salt intake in children
10–12 years old and its modification by active working practices in a school garden. J Hypertens. 2013;31(10):1966–71.
33. Stookey JD, Brass B, Holliday A, Arieff A. What is the cell hydration status of healthy children in the USA? Preliminary data on urine osmolality and water intake. Public Health Nutr. 2012;15(11):2148–56.
34. Kutz FW, Cook BT, Carter-Pokras OD, Brody D, Murphy RS. Selected pesticide residues and metabolites in urine from a survey of the U.S. general population. J Toxicol Environ Health. 1992;37(2):277–91.
35. Silva J, Padrão P, Gonçalves C, Esteves R, Carrapatoso S, Carvalho J, et al. Association between hydration status and sodium intake amongst community-dwelling elderly people. In: Aranceta J, editor. I International Hydration Congress, vol. 20. Granada: Revista Española de Nutrición Comunitaria; 2013. p. 63.
36. Duffey KJ, Huybrechts I, Mouratidou T, Libuda L, Kersting M, De Vriendt T, et al. Beverage consumption among European adolescents in the HELENA study. Eur J Clin Nutr. 2012;66(2):244–52.
37. He F, Marrero NM, MacGregor GA. Salt intake is related to soft drink consumption in children and adolescents. A link to obesity? Hypertension. 2008;51:629–34.
38. Andersen L, Rasmussen LB, Larsen EH, Jakobsen J. Intake of household salt in a Danish population. Eur J Clin Nutr. 2008;63(5):598–604.
Submit your next manuscript to BioMed Central and take full advantage of:
• Convenient online submission • Thorough peer review
• No space constraints or color figure charges • Immediate publication on acceptance
• Inclusion in PubMed, CAS, Scopus and Google Scholar • Research which is freely available for redistribution
Submit your manuscript at www.biomedcentral.com/submit