1 A Work Project presented as part of the requirements for the Award of a Master Degree in
Management from the NOVA – School of Business and Economics
Is Pfizer-Wyeth merger aligned with value creation in the pharmaceutical
industry?
Ilaria De Angelis – Student number 2915
A Project carried out on the Master in Management Program under the supervision of: Professor Doctor Duarte Pitta Ferraz
2
Abstract
Is Pfizer-Wyeth merger aligned with value creation in the pharmaceutical industry? This empirical research evaluates whether the Pfizer-Wyeth merger created value for
shareholders, trying to assess if the specific case study is in line with the principal pattern of the industry. In order to achieve these goals, a detailed value creation appraisal is
implemented through market reaction measurement at the announcement dates of acquisition. Afterward, a statistical regression has been performed determining which factors mainly affect enterprise’s performance. The conclusion suggests that the deal’s value creation is aligned with the pharmaceutical industry trend and that company performance is affected by financing structure, EPS and transaction size.
3
Introduction
Ever more attention is being paid at mergers and acquisitions by enterprises working in several sectors and, above all, by pharmaceutical firms. The rationale behind it is the
willingness to create a more competitive and cost efficient entity that is able to gain a higher market share. However, special attention should be devoted to the synergy’s creation which can take either the form of revenue enhancement or cost saving. Companies usually aim at reaching new market opportunities and industry visibility while achieving economies of scale and acquiring new technology. Looking in deeper detail, the examined sector shows a great number of completed takeovers over the considered period of time. It can be explained by the difficulty to commercialize new drugs in the market: it takes several years and has a high risk. As a matter of fact, there are low probabilities of finding new compounds and regulators requires always greater standard.
Strategic and research questions have been developed in order to build up a well-organized empirical project.
Strategic question Research Question
Did Pfizer-Wyeth merger create value for shareholders when compared to the
pharmaceutical sector?
To what extent do financing structure, EPS and transaction size impact M&A success
and thus company performance?
The paper is structured in the following way: the second section investigates the existing literature related to M&A issues. The third section discloses what type of data have been used and where they come from. The fourth section examines the methods used to carry out useful results. The fifth section explains results and try to make conclusions.
4
2. Literature Review
2.1. Mergers and Acquisitions: definitions and types
Merger and acquisition (hereafter M&A) is a widespread expression which refers to a company’s consolidation and involves numerous agreements such as mergers, acquisitions, purchase of assets and tender offers. As reported by Faulkner, Teerikangas and Joseph (2012) merger can be defined as the combination of two companies to create a new enterprise
whereas an acquisitions refers to the buying of one firm by another and it does not consider the foundation of any new business. Ross, Westerfield and Jaffe (2003) introduced a legal framework according to which M&A can be classified as mergers or consolidations,
acquisitions of stocks and acquisition of assets. In the former case, merger is the combination of two companies in which only one survives while the other goes out of existence (A+B=A) while consolidation is described as a transaction in which both the pre-existing entities are legally dissolved and they are going to join creating a new firm (A+B=C). In an acquisition of stocks, the acquiring enterprise’s management makes an offer to the target’s board of
directors for the target’s shares. It can either be friendly or hostile. In the latter case, the acquiring firm purchases all the target’s company assets.
However, M&A can also be sorted out in line with the financial analyst classification which considers horizontal, vertical and conglomerate mergers (Tremblay and Tremblay 2012). While horizontal and vertical mergers consider businesses that are related to each other, conglomerate combination occurs when two entities do not have any point of contact (Higgins and Schall 1975). Moreover, vertical merger takes place whether both acquiring and target enterprises compete in the same sector while vertical merger happens when two firms are at different stages of the same production process.
5 2.2. M&A Activity
Companies regularly engage in M&A in the expectation of improving their performance and their competitive position. Over time, the number of M&A activities has increased a lot reaching a new high in 2015 (Rhem and West 2015). Looking in deeper details, more than 7500 transactions had been announced, exceeding 2014 business combination volume by 8%. The deals majority occurred in US even though the Asian market had huge impact on the overall capacity. However, it is crucial to highlight the reasons that are prompting enterprises promoting M&A and how they gradually changed. While in the past deals were considered as tactics to boost industry consolidation and cost reduction, nowadays, managers are talking about diversification, cross selling and creation of new customer opportunities. It means that transactions are actually considered as strategic tool to raise revenues, promote growth and enable enterprises to expand themselves into more lucrative businesses. Nevertheless, it is important to keep in mind that the main objective of any deals is to create value for all firm’s stakeholders and principally for shareholders of the acquiring company. Truthfully, there is a debate among scholars related to the extent to which M&A transactions create value. As a matter of fact, there is not a unique frame of reference since there is a long history of failed deals. However, this great degree of collapse does not turn out in all sectors. This research paper is aimed at assessing whether the pharmaceutical industry is in line with this high M&A failure rate. Since 1980s, many pharmaceutical companies were involved into M&A
takeovers leading to the foundation of the so called Big-Pharma. Having this background, there are some factors that have an impact on the enterprise’s decision to initiate a business combination process such as growing claim for generic products, loss of earnings from patent expiration drugs and R&D turning down productivity.
6 2.3. Valuation: stand-alone entity and synergies
Companies implement several strategies in order to speed up their growth, become more profitable and support value creation. Among these tactics, M&A has always been an essential factor and firms continue to be engaged in such transactions because of the upside they could show such as synergistic gains, diversification and raised growth (Vulpiani 2014). However, several takeovers are actually destroying value but is seems that managers forget about possible downsides. Since this paper mainly focus on value creation, it is crucial to understand what this term actually means.
The company’s ultimate objective is to maximize value (Damodaran 2011) because it is a valuable benchmark of the firm accomplishments (Koeller, Goedhart and Wessel 2010). Substantially, it considers long term interest of all firm’s stakeholders and it enables to achieve greater degree of customer satisfaction. According to the literature, M&A transaction creates value and maximizes returns whether expected synergies plus stand-alone value of the target are higher than the price paid for the target.
Value creation = (Synergies + Stand-alone value of the target) > (2.1) (Acquisition Premium + Market Value of the target)
There are quite a few analysis that can be carried out in favor of a clear comprehension on whether M&A produces value, such as the semi-strong investigations. These event studies are going to assess abnormal returns in the period before and after any business combination announcement. There are two key results from these examinations:
- Acquiring firm stockholders gain zero or negative abnormal return yields from M&A. The main reason behind this statement is that market skeptical reaction is typically related to synergistic gains;
- Target stockholders gain positive abnormal return yields from friendly M&A. The principal idea that explains this declaration is that returns mainly depend on high
7 premiums earned by target shareholders;
The above mentioned propositions primarily lead to the finding that M&A usually do not create value for acquiring shareholders. Anyhow, further features should be taken into account such as financing structure, EPS impact and transaction size. In order to have a fair understanding, it is essential to test the existing relationship between M&A success and business performance using the following hypothesis:
Financing structure: form of payment can affect transaction success and thus returns for shareholders. In particular, deal value can either be paid in cash or in stock. According to Hazelkorn, Zenner and Shivdasani’s paper (2004), equity market’s reaction varies a lot depending on the method with which a takeover is funded: cash-financed acquisitions lead to positive returns for shareholders of the acquiring company compared to stock-financed agreements. There are several motives that justify this trend, such as the fact that cash-paid business combinations give positive signals to investors about the ability to restore the cash balance (Amihud, Lev and Travlos 1990) and the fact that stocks are usually used when shares are overvalued (Zhang 2001). However, Sehgal et al. (2012), proposed an opposite idea, according to which stock financed mergers are value creating while, on the other hand, cash financed deals seem to be value destroying in the BRICKS market. Nevertheless, this paper follows the suggestion of cash financed oriented takeovers.
Hypothesis 1: Ceteris paribus, cash financed transactions will improve company performance.
EPS impact: EPS is an essential element. Usually, firms are looking for non-dilutive to earnings business combinations because they are considered negatively by investors (Andrade 1999). However, there are some studies which do not consider it as a key factor. As a matter of fact, although accretive deals perform better than dilutive ones in both short and long run, the difference is small and not statistically significant (Hazelkorn, Zenner and Shivdasani
8 2004). According to this theory, much importance should not be assigned to EPS accretion in evaluating deal success because EPS will not impact acquirer returns in the way predicted by conventional wisdom and thus is not going to predict value creation.
Hypothesis 2: Ceteris paribus, EPS negatively impacts company performance.
Transaction size: there are some studies which suggest a kind of relationship between transaction size and short term success, finding a statistically significant connection among them. This phenomenon appears particularly important in cross-listed firms which use equity (Tolmunen and Torstila 2008). However, looking at long term success this correlation does not appear anymore (Hazelkorn, Zenner and Shivdasani 2004).
Hypothesis 3: Ceteris paribus, transaction size negatively impacts company performance.
3. Data and sample selection
This paper is based on data related to publicly listed companies operating worldwide even though their headquarters are mostly established in Europe or in the United States.
A sample of twenty completed transactions was determined by using Zephyr, one of the most extensive database of deal information. The representative includes organizations running their business in the pharmaceutical sector and it does not consider corporations operating in the financial industry. The reason behind this choice is motivated by both the regulatory nature of the financial service sector and the decision to assess how firms behave in the analyzed industry. The chosen sample includes mergers and acquisitions but does not
consider neither IPO, institutional buy-out, capital increase nor management buy-in/buy out. All the takeovers were announced between January 1, 2000 and January 1, 2016 and were of relevant size, meaning that their deal values were at least US$ 150 million. Furthermore, it considers either acquirer, target or vendor from all over the world and acquirers are listed in the US.
9 After having completed this first step, data related to the examined firms was downloaded from Bloomberg and it is now available for the empirical study. In order to perform the second step analysis, data related to enterprise’s performance measures were collected for each company from the DataStream for the 2015 financial year. In particular, information associated to financing structure, EPS impact and transaction size were taken. The impact of such characteristics was then evaluated through the use of data regression for each
enterprise’s stock market performance (proxied by Tobin’s q ratio). However, prior to conduct the second step analysis it is essential to determine whether the chosen sample is suitable for applying a multiple regression. Firstly, data are examined in order to check for the existence of several essential hypotheses that could grant trustworthy findings using SPSS Statistics. The Central Limit Theorem is valid which means that it can be possible to assume that the distribution of the estimates is close to a normal distribution. As a matter of fact, the linear regression assumption has been verified through the use of a scatterplot (the residuals fits the normal distribution line) which guarantees a linear relationship among dependent and independent variables. According to Phillips (1986), it is helpful to use Durbin Watson Statistic in order to guarantee variables’ independence. In particular, it assures that there is no correlation in the selected representative since its value is equal to 1.957. Furthermore, following what is suggested by Jarque and Bera (1980) all records have been subjected to homoscedasticity. Then, it has been checked that independent variables are not extremely correlated with each other through the use of the Variance Inflation Factor (VIF). Truthfully, in the examined case there is no multicollinearity because independent variables’ VIF value is between 1.057 and 1.227 which is not close to 10. According to the last assumption, it is necessary to take out meaningful outliers in order to increase model’s predictive precision. This hypothesis is checked through Mahalanobis Distance which should be lower that 16.27. Truly, the maximum value that appear in the chosen sample is 16.11 which is lower than the
10 above-mentioned critical value.
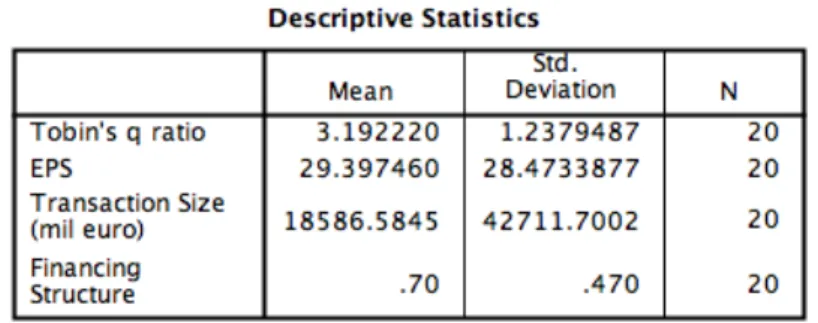
The dataset is composed by 20 observations taken from the sample over the examined period of time. Looking in deeper details, the following values were taken for each enterprise:
• Tobin’s q ratio: it is a measure of firm performance at the financial market level which takes the stock market into consideration. It is taken by Bloomberg even if it can be computed using the following formula: !"#$%& ()*+,% -).#,!"#$%& /00+ -).#, ;
• Financing structure: it refers to the transaction’s form of payment which can either be in cash or in stock. In the former case it takes a value 1, and 0 otherwise;
• EPS impact: it is the share of a firm’s earnings that is distributed to each share of common stock. It is an important factor in determining share’s price;
• Transaction size: it refers to M&A transaction value taken from Zephyr database (figures are in million of euro);
The following table (Table 1) is going to represent the summary statistics for the principal variables used in the regression analysis.
Table 1: Summary statistics
Source: SPSS Statistic
This research is performed by using computational and mathematical processes and therefore the candidate is hoping to obtain unbiased outcomes that can be generalized to a most
11
4. Empirical model
In order to test if the specific event study created value for shareholders of the acquiring firm, stock excess returns are measured considering distinct time horizons. Theoretically speaking, excess stock returns can be defined as the total stock’s actual return adjusted for general market wide movements, evaluating if the share reacted positively at the announcement date of acquisition and principally, if acquirer’s share exceeds its peers in the long period. In favor of a clear understanding, it is crucial to measure abnormal returns for the target acquisition and for each stock in the sample considering both short term and long term timelines
surrounding the announcement (Huang. Y.S. and Walking 1987). Starting from a short term investigation, two distinct timeframes are considered which are five-day window (it begins two-days prior the announcement and it finishes two-days after it) and 21-day window (it starts ten-days before the announcement and it finishes ten-days after it). The rationale behind the computation of 21-day window is that significant features are only openly revealed after a period of time.
However, this research paper is also going to analyze the stock market’s response to business combination over a longer period of time. As a matter of fact, an extended frame of reference enables to capture post-merger integration and execution aspects that otherwise are not considered. In particular, these features complement the work supporting the success of a transaction. Following the paper’s direction, excess returns are computed over one-year window (it begins right after the announcement date and it finishes one year later) and two-year window (it starts right after the announcement date up to two two-years after). Following there is an explanation of the method used to calculate them.
Bloomberg is the financial software used to download data related to target company and each enterprise included in the sample. At the beginning, both daily and weekly stock prices in US$ of Pfizer and each acquiring enterprise were considered. In particular, daily stock prices
12 refer to the short term investigation (five-day window and 21-day window) whereas weekly stock prices consider longer time frame (one-year window and two-year window). Then, MSCI World Index was chosen as a proxy for the market return needed to adjust abnormal returns for market movements, and US Government Bonds 10-years yield’s Index was picked out as the risk free asset used to measure excess returns (Bloomberg tickers are respectively: MXWO World Index and USGG10YR). There are two reasons that justify MSCI World Index’s selection: it is a measure of equity market performance of developed markets and all pharmaceutical companies selected in the sample have operations all over the world. The next step is to evaluate stock returns for each company, for risk free asset (USGG10YR) and for market proxy (MXWO World Index) starting from their prices. As a matter of fact, the return analysis enables a comparison among all variables. It is more convenient to compute log returns instead of raw returns because they have several benefits such as log-normality, approximate raw-log equality, time-additivity and numerical stability (Berk and De Marzo 2014). Moving forward, excess returns are measured for each enterprise as the
difference between stock’s returns and return on the risk free asset in order to estimate if the specific yield exceeds the benchmark (USGG10YR). Afterward, market excess returns are evaluated as the variation of USGG10YR yields from the MSCI World Index returns. Once all these calculations have been performed, Pfizer’s beta is computed according to the Capital Asset Pricing Model. It means that Pfizer’s returns are regressed against returns on the market index (MSCI World Index) over a reasonable time period preceding deal’s
announcement date. Actually, there is not a unique time period used to estimate betas: depending on the industry it can be set between three and ten years. Surely, higher is the number of observations in the regression, greater is the relevance level when beta is calculated. Specifically, 5-years time frame is usually chosen for firms that have been restructured, divested or acquired. Following the paper’s direction, both alpha and beta are
13 assessed (Fama and French 2004), leading to the evaluation of Pfizer’s expected returns (Damodaran 1999). In particular, one-day expected return is equal to:
Expected Returns= α + β * (Market excess returns) (4.1) Then, one-day abnormal returns are computed as shown in the equation below:
Abnormal Returns= Actual Returns – Expected Returns (4.2) Once one-day abnormal returns are measured for the specified period of time, it is reasonable to consider total abnormal returns. It is computed for each enterprise included in the sample as the sum of all abnormal returns over the examined horizon.
As soon as short term analysis is concluded, it is rational to pass through long term horizon appraisal. The extended length of time leads to discuss further beneficial consideration such as post-acquisition synergies, integration practices and execution policies. All of them are crucial for the success of any specific transaction as well as for value creation related to business combination. The majority of scholars who have researched M&A success rate believe that most of them did not produce any gain for shareholders and that they are actually destroying value. Looking at firms reports, more than half failures may be ascribed to
organization concerns including leadership clash, loss of key talent, lack of management commitment, poor communication, misaligned structured and lack of shared vision. In order to avoid any kind of problems during post-merger phase and ensure the greatest possible coordination among companies involved in the takeovers, the M&A team should carefully schedule all activities subsequent to the alliance.
According to the chosen methodology, there are other two time intervals that should be investigated: one-year horizon and two-year horizon. While the first one begins
immediately after the announcement date and finishes one year later, the second one starts in the same moment as the former and spreads out up to two years after the pronouncement. The long-term approach is exactly the same as the one above described for the short term horizon
14 except for one aspect: abnormal returns are measured using both market indices, MSCI Health Index (Bloomberg ticker: MXWOOHC Index) and MSCI World Index. In particular, the first one is used to relate Pfizer’s stock return to its peers within the pharmaceutical sector, while the second one is orientated to evaluate stock market response to Pfizer announcement in the long run.
Looking at the regression analysis, its main objective is to assess whether three factors (financing structure, EPS impact and transaction size) have an impact on company stock market performance (Tobin’s q ratio) in periods surrounding the announcement of the deal so that they can affect M&A success. Tobin’s q ratio was taken to evaluate firm performance in the chosen sample. At the beginning, some tests were implemented through a correlation analysis in order to estimate the existing link among variables. Then, a multiple regression model was performed to evaluate the extent to which the examined independent variables affect the dependent one. It is explained by the following equation:
Yit = β0 + β1 FINSTRUC- β2 EPS - β3 TRANSIZE +
ε
it (4.3)(i=1,…,n; t=1,…m)
According to what already has been argued in the literature review section, below there are the hypothesized findings that have been checked through the regression analysis.
Hypothesis 1: financing structure has a positive impact on company stock market performance and thus on M&A success;
Hypothesis 2: EPS has a negative impact on company stock market performance and thus on M&A success;
Hypothesis 3: transaction size has a negative impact on company stock market performance and thus on M&A success;
15 The regression model results are shown in Table 2.
Table 2: Regression variable estimates
Source: SPSS Statistic
5. Results and Interpretation
5.1. First step analysis: does M&A create value?
After having performed all the above calculations, it is rational to briefly discuss the main results related to both the Pfizer case study and the pharmaceutical industry. Starting from the Pfizer’s analysis, it created value for the company’s shareholders. Looking at the Table 3, even though abnormal returns related to the 5-day window were negative they changed into positive during the next ten days.
Table 3: Pfizer’s Abnormal Returns for Short-term and Long-term Horizons
SHORT TERM
HORIZON LONG TERM HORIZON (MSCI World Index)
LONG TERM HORIZON (MSCI Health index) Time intervals 5-Day Window 21-Day window 1-Year Window 2-Year Window 1-Year Window 2-Year Window Total abnormal returns -13,20% 9,61% 33,08% 22,65% 47,00% 51,59%
Source: Calculated using data taken from Bloomberg database
Usually, M&A announcements have negative impacts on stock price considering short period of time surrounding the announcement. To reinforce this theory, Figure 1 shows Pfizer’s cumulative excess returns in the short horizon. As a matter of fact, the graph has a negative slope both before and after the announcement.
16 Figure 1: Average Cumulative Excess Acquiror Stock Returns Relative to Announcement Date of M&A Transactions
Source: Calculated using data taken from Bloomberg database
There are several reasons that justify the negative short-term excess returns in the 5-day window after the announcement of the deal (Bradley, Desai and Han 1983): some of them depend on sceptical market reactions, while others are based on cultural, operational and financial explanations (De Noble, Gustafson and Hergert 1988). Firstly, some factors lead to lower abnormal returns such as the fear of a possible cultural conflict that could arise because of different company structures, the Wyeth CEO’s lay-off and the plan to integrate the
Wyeth’s expertise into the new Pfizer organization, the fact that both enterprises mainly operated in US and the reduced reliance on Pfizer’s primary care medicines. Further key issues are based on the contraction of diluted EPS (because of litigation-related matters), the decreased proportion of Pfizer’s revenues that comes from primary care product and the foreign exchange which shrinkage firms’ revenue. As soon as Pfizer was able to manage these difficulties, returns became positive increasing in the long run. As a matter of fact, the deal meaningfully advanced business’s strategic priorities which include the enhancement of patent protected portfolio in essential disease fields becoming a top player in the related
17 industry (Kronimus, Nowotnik, Roos and Stange 2001). Furthermore, it accelerated the
enterprise’s growth in emerging markets, leading to the creation of new opportunities in these businesses and enabling the investment in complementary sectors with lower cost base (Bruner 2004). Geographically speaking, the enterprise’s combined footprint is unequalled, being present in the US, Europe, Asia, Brazil and Russia. In addition, the takeover extended the firm’s global healthcare leadership. In fact, Pfizer established itself as a leader in animal, human and consumer health, promoting bio-therapeutics and vaccines innovation and being the top player in primary care and the number two enterprise in specialty care worldwide. This success was achieved thanks to the combination of a well diversified giant like Pfizer with the speedy and agility of the smaller Wyeth: they were able to connect discipline, accountability and strong commitment. It was done through the establishment of business units, each one having a clearly defined leader and focused on one customer segment. It benefits from fixed costs of research, manufacturing and commercialization that promote investment and maintain financial flexibility at the same time. The result is a company with relevant resources and scale and a great competitive advantage over its rivals. It has a broader portfolio composed by innovative products and occasion for growth.
Summing up, Pfizer-Wyeth takeover seems to be the right transaction, at the right time, with the right firms and for the right reasons. Even though total abnormal returns were negative 5-days after the announcement date, they turned into positive ones because of synergies related to the transaction: these come from R&D and manufacturing, which include the
implementation of a global procurement structure, support functions, economies in back-office operations, sales and manufacturing and the establishment of a global network of plants. It means that the business combination created value not only for the shareholders of the acquiring company, but also for customers and patients today, patients tomorrow and patients everywhere.
18 By joining together, “we created the world’s premier biopharmaceutical company whose distinct blend of diversification, flexibility and scale proportion” (Pfizer 2009).
5.2. Conclusion on Pfizer-Wyeth deal and M&A in the Pharmaceutical sector
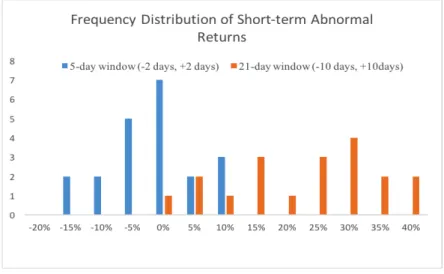
Looking again at Table 1, it is possible to highlight that MSCI Health Index achieved greater results in both 1-year window and 2-year window compared to MSCI World Index. It means that Pfizer accomplished better outcomes than the thorough pattern of its peers within the pharmaceutical industry. In order to evaluate whether pharmaceutical sector produces value, two frequency distribution charts are drawn representing abnormal returns’ allocation for shareholders of the acquiring firms. Figure 2 exhibits frequency distribution of short-term abnormal returns, while Figure 3 shows long term frequency distribution.
Figure 2: Frequency distribution of Short-term Abnormal Returns
Source: Calculated using data taken from Bloomberg database
Let us go through the graph explanation. The vertical axis represents frequency for specific range of values, while horizontal axis stands for short-term abnormal returns. In the graph, both day window and 21-day window are displayed using different colours (blue bar for 5-day window data and orange bar for 21-5-day window data). The histogram suggests that
19 usually 5-day excess returns are close to zero or negative: only few transactions show positive returns, whereof the greatest value is 10%. As above described it can be justified by several reasons such as cultural, operational and financial fears. The crucial aspect is that total abnormal returns turn into positive after a period of time. As the chart exhibits, already 10 days after the announcement returns increased: in the chosen sample there is only one out of twenty negative excess return related to the 21-day window.
However, there are some factors that positively impact a takeover’s success such as the form of payment and earning growth determinants, as well as if the target company is domestic or foreign and whether the business combination is focused or diversified. Following, further details are provided. The transaction was mainly financed by cash and the target company was a mature enterprise. As a matter of fact, buyers achieve higher industry-adjusted returns when the objective company’s projected earning-growth rate is low because they are able to increase shareholders value through operational synergies. In addition, also the target firm status matter. There are some rationales behind it: private company and acquisition of asset or business units are narrower in scope compared to public and whole enterprise acquisitions and thus less predisposed to integration difficulties. Furthermore, they are usually paid in cash rather than through stock (as above described, cash financed transactions are more prone to add value than stock financed business combination). Moreover, other two aspects should be considered: foreign target firms versus domestic ones and focused versus diversified business combinations. Regarding the former, foreign firms earn greater returns because they are able to reach broader geographic scope for their enterprise’s products while, in the latter, focused business achieves better results because of synergies in costs and revenues and because of cultural and social similarities.
Turning the attention to the long run horizon, it is crucial to highlight that MSCI Health Index values are always greater than the ones related to MSCI World Index. It means that business
20 combination involving pharmaceutical companies do not only create value for shareholders of the acquiring firms but also for the entire market.
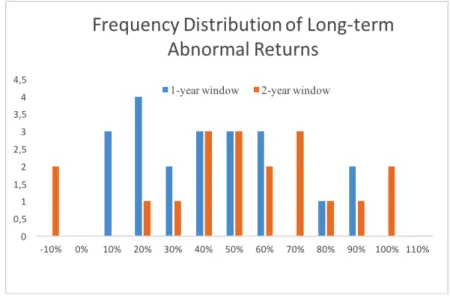
Looking at Figure 3, it is possible to assess frequency distribution related to long-term excess returns. It refers to MSCI Health Index, meaning that it evaluates abnormal returns for the specific industry (Loughran and Vijh 1997).
Figure 3: Frequency distribution of Long-term Abnormal Returns using MSCI Health Index
Source: Calculated using data taken from Bloomberg database
Analysing the histogram, we can infer that almost all deals tend to have positive long term abnormal returns. It means that almost all business combinations performed within the pharmaceutical industry create value for shareholders of the acquiring companies in the long run.
21 5.3. Second step analysis: regression model results
In this analysis a hierarchical ordinary least square regression is performed in order to assess the impact of three independent variables on company performance. As already discussed, firm performance is proxied by Tobin’s q ratio which is considered as the dependent variable for the model. This study considers twenty pharmaceutical deals which are evaluated over 2015 financial year.
Looking at the regression analysis, it is important to conclude that stock market performance improves if the transaction is financed by cash rather than stock. This finding reinforces the above postulated hypothesis 1. Furthermore, greater are EPS and transaction size greater is the negative impact company performance. Therefore, regression results support both hypothesis 2 and hypothesis 3.
Table 4 shows the results of the regression study whose aimed at predicting company performance. Surely, observations are well described by the model because the Adjusted R-Square is equal to 0.851 which is close to 1.
Table 4: Model summary
22
Conclusion
The main conclusions of this empirical research are based on quantitative analysis and are the following:
- 5-days abnormal returns related to the Pfizer-Wyeth case study are negative; - 21-days abnormal returns related to the Pfizer Wyeth case study are positive;
- 5-days abnormal returns related to the pharmaceutical sector are usually close to zero or negative, displaying few positive values whereof the greatest is 10%;
- 21-days abnormal returns related to the pharmaceutical sector are positive, showing only one exception;
- MSCI Health Index reaches higher values in both 1-year and 2-year windows compared to MSCI World Index;
- 1-year and 2-year abnormal returns related to the MSCI Health Index are positive; - Financing structure positively impacts company performance and thus M&A success; - EPS negatively impacts company performance and thus M&A success;
- Transaction size negatively impacts company performance and thus M&A success;
As overall conclusion, it seems that the Pfizer-Wyeth deal created value for shareholders of the acquiring company, being aligned to the pharmaceutical industry trend. In fact, the rationale behind M&A operations comes from both acquirer and target companies: Big-Pharma are usually able to obtain better funding than small or biotech firms. On the other hand, the latter enterprises are distinguished by an entrepreneurial spirit which encourages R&D investment leading to new drug mass production.
Finally, it should be underlined that the results are representative of the pharmaceutical sector, and thus their validity and conclusion might not be extended to all other industries.
23
References
Amihud, Y., Lev, B., Travlos N.G., 1990. Corporate Control and the Choice of Investment Financing: The case of Corporate Acquisitions. The Journal of Finance, 45 (2), 603-616. Andrade, G., 1999. Do appearance matter? The impact of EPS accretion and diluition on stock prices. Harvard Business School – Finance Unit.
Berk, J. and De Marzo, J., 2014. Corporate Finance. 3rd edition. Boston: Pearson. Bradley, M., Desai, A. and Han Kim, E., 1983. The Rationale behind Interfirm Tender Offers. Journal of Financial Economics, 183-206.
Bruner, R., 2004. Applied Mergers and Acquisitions. Hoboken, (New Jersey): John Wiley & Sons, Inc.
Bureau Van Dijk. Zephyr Annual M&A Report. Available via: Zephyr [Accessed 15 February 2016].
Damodaran, A., 1999. Estimating Risk Parameters (e-book type), available at: Archive.nyu.edu.
Damodaran, A., 2001. Applied Corporate Finance. 3rd Edition. Hoboken, (New Jersey): John Wiley & Sons, Inc.
De Noble, A. F., Gustafson, L. T., Hergert, M., 1988. Planning for post-merger integration-eight lessons for merger success. Elsevier, 21 (4), 82-85.
Fama E.F., French K. R., 2004. The Capital Asset Pricing Model: Theory and Evidence. Journal of Economic Perspective, 18 (3), 25-46.
Faulkner, D., Teerikangas, S., and Joseph, R.J., 2012. The Handbook of Mergers and Acquisitions. Oxford: Oxford Scholarship Online.
Hazelkorn T., Zenner M., and Shivdasani A., 2004. Creating Value with Mergers and Acquisitions. Journal of Applied Corporate Finance, 81-90.
24 of Finance, 93-113.
Huang. Y.S., and Walking R., 1987. Target Abnormal Returns Associated with Acquisition Announcements. Journal of Financial Economics, 329-349.
Jarque, C.M., Bera, A.K., 1980. Efficient test for normality, homoscedasticity and serial independence of regression residuals. Economics Letter, 6 (3), 255-259.
Koeller, T., Goedhart, M., and Wessels, D., 2010. Valuation measuring and managing the value of companies. 5th Edition. Hoboken, (New Jersey): John Wiley & Sons, Inc.
Kronimus, Nowotnik P., Roos A., and Stange S., 2001. Pharmaceuticals: Using M&A as a cure. Boston Consulting Group.
Le Bars, M., 2015. IMAP industry report: “Global M&A Report, Pharma/Biotech 2015” (online). Available via:
http://www.kurmannpartners.com/fileadmin/user_upload/import2015/MR-Pharma_Biotech/2015_Pharma__Biotech_MandA_report.pdf.
Loughran T. and Vijh A. M., 1997. Do Long Term Shareholders Benefit from Corporate Acquisitions? Journal of Finance, 1765-1790.
Pfizer, 2009. Pfizer to acquire Wyeth, Creating the World’s Premier Biopharmaceutical Company [online]. New York & Madison, NJ. Available at http://press.pfizer.com/press-release/pfizer-acquire-wyeth-creating-worlds-premier-biopharmaceutical-company. [Accessed 20 April 2016].
Phillips, P.C.B., 1986. Understanding spurious regressions in econometrics. Journal of Econometrics, 33 (3), 311-340.
Rhem, W., West, A., 2015. M&A 2015: New highs, and a new tone. McKinsey & Company paper, available via: https://www.mckinsey.it/idee/m-a-2015-new-highs-and-a-new-tone. Ross, Westerfield and Jaffe., 2002. Corporate Finance. 6th Edition. New York: the McGraw-Hill Companies.
25 Sehgal, Sanjay, Banerjee et al., 2012. The impact of M&A Announcement and Financing Strategy on stock returns: Evidence from BRICKS markets. International Journal of economics and finance, 4 (11), 76-90.
Suri, N., Joshi, B., 2011. KPMG whitepaper on Post Merger People Integration. Available via:
https://www.kpmg.com/IN/en/IssuesAndInsights/ArticlesPublications/Documents/Post%20M erger%20People%20Integration.pdf.
Tolmunen, P., Torstila, S., 2008. Cross listing and M&A activity: transatlantic evidence. Financial Management. 34 (1), 5-179.
Tremblay, V., Tremblay C.H., 2012. Horizontal, Vertical and Conglomerate Mergers. Springer Texts in Business and Economics, 521-566.
Vulpiani M. (2014). Special cases of Business Valuation. New York: the McGraw-Hill Companies.
Zhang, P., 2001. What really determines the payments methods in M&A deals. University of Manchester – Manchester Business School.