Study and Application of Propofol Pharmacokinetic Modeling to
Target Controlled Anesthesia in Veterinary Medicine
Tese de Doutoramento em Ciências Veterinárias
Sónia Patrícia Seabra Campos
Orientadores:
Professor Doutor Luis Miguel Marques Antunes
Doutora Maria Paula do Amaral Alegria Guedes de Pinho
Professor Doutor Joaquim António Faria Monteiro
iii
Study and Application of Propofol Pharmacokinetic Modeling to
Target Controlled Anesthesia in Veterinary Medicine
Tese de Doutoramento em Ciências Veterinárias
Sónia Patrícia Seabra Campos
Orientadores:
Professor Luis Miguel Marques Antunes
Maria Paula do Amaral Alegria Guedes de Pinho
Professor Joaquim António Faria Monteiro
Composição do Júri:
Professora Doutora Catarina Falcão Trigoso Lavrador
Professora Doutora Belén Valenzuela Jiménez
Professora Doutora Paula Alexandra Martins Oliveira
Professor Doutor José Eduardo Teixeira Pereira
v
The research described in this Thesis was financially supported by the Portuguese Foundation for Science and Technology (FCT) under the personal grant: SFRH/BD/72360/2010 and the project PTDC/CVT/099022/2008.
vii
To my Family and Friends
‘We keep moving forward, opening new doors, and doing new things, because we are curious and curiosity keeps leading us down new paths.’
ix
Douro and Fundação para a Ciência e Tecnologia (FCT), Portugal, for accepting me as a PhD student and for turning possible the development of this Thesis work.
I also want to thank to UCIBIO@REQUIMTE, Laboratório de Toxicologia, Departamento de Ciências Biológicas from Faculdade de Farmácia da Universidade do Porto also for receiving me as student and for allowing the performance of an important part of this work.
In addition, I would like to thank the following people and institutions:
Professor Luis Antunes, for being my supervisor from the first beginning and for the continued guidance and patience.
Doctor Paula Guedes de Pinho, for receiving me once again at UCIBIO@REQUIMTE, Laboratório de Toxicologia, for being my supervisor and for the constant support and availability.
Professor Joaquim Monteiro, for being my supervisor, for his incredible guidance, inspiration and patience. Thanks for the good advices, constant geniality and friendship.
Professor Paula Fresco, although not officially my supervisor, thanks for assuming that role and for helping me in the correction of this Thesis. More important, thanks for the endless friendship and kindness in every important moments.
Professor Maria de Lurdes Pinto for all the lab work, scientific support and endless sweetness. A special thanks to Gabriela Gomes and Lígia Lourenço from Laboratório de Histologia of Universidade de Trás-os-Montes e Alto Douro (UTAD).
Professor Carlos Venâncio from UTAD for the unquestionable help during the second experimental study execution.
Professor Luísa Ferreira and to Professor Paula Branco from LAQV-REQUIMTE, Departamento de Química da Faculdade de Ciências da Universidade Nova de Lisboa, for producing the synthetic propofol metabolites.
Professor Franklim Marques and Dr. Laura Pereira from Laboratório de Análises Clínicas do Departamento de Biologia da Faculdade de Farmácia de Universidade do Porto, for the blood biochemistry analysis.
x
experimental designs used on this Thesis and for all the knowledge shared regarding the Science in laboratory animals.
To my Family with all my love, for their patience and care.
To my close Friends. Thanks for being there and for all the support.
xi
in a rabbit model, elucidating potential strategies for Target Controlled Infusion (TCI) use and improving propofol anesthesia safety in clinical and research settings in Veterinary Anesthesia. Therefore, to achieve these main goals this Thesis was divided in four studies.
The first study (Chapter III) comprised the development and validation of an analytical method for the simultaneous quantification of propofol and its non-conjugated metabolites, using Gas Chromatography/ Ion Trap – Mass Spectrometry technique (GC/IT-MS), in plasma and organs (liver, heart, kidney and lung). The proof of applicability of this methodology tested the measurement of propofol and its non-conjugated metabolites in plasma and solid tissues from seven New Zealand White rabbits that were submitted to a long-term anesthesia protocol with a continuous infusion of propofol ranging from 20 to 60 mg.kg-1.h-1. The second study
(Chapter IV) explored the pharmacokinetic behavior of propofol during short and prolonged propofol infusions in order to develop a PK model for propofol in the rabbit. For this purpose, two different rabbit populations were used. Population 1 (P1) was formed by seven New Zealand rabbits and was used to characterize the pharmacokinetic profile of propofol during short infusions. Animals were anesthetized with an intravenous 20 mg.kg-1 bolus (propofol 1%)
followed by an infusion rate of 50 mg.kg-1.h-1, which was maintained for thirty minutes. Then,
Population 2 (P2, n=7) was sedated according to reflexes responses and Index of Consciousness values (IoC), for 20 consecutive hours using propofol 2%, allowing the characterization of propofol behavior during long-term infusions. Blood samples were withdrawn at specific time-points and propofol plasma concentrations were determined by GC/IT-MS technique previously validated. The NONMEM VII software was used to evaluate the relationships between time and plasma concentrations. The third study (Chapter V) analyzed the enzymatic expression of CYP1A1, CYP1A2 as well as the amount of propofol and its non-conjugated metabolites in the liver and kidney of rabbits, elucidating the metabolic pathways involved in propofol biotransformation. The fourth study (Chapter VI) allowed to evaluate the effects of prolonged administration of propofol in liver mitochondrial bioenergetics of rabbits. In studies three and four, the experimental design used was the same for both. Twenty-one New Zealand rabbits were randomly allocated in three groups that were continuously treated for 20 hours. Each group of seven animals received: NaCl 0.9% (saline), SMOFlipid® (vehicle) and Lipuro® 2% (propofol). A propofol bolus of 20 mg.kg-1 was given to
the propofol group to allow blind orotracheal intubation and mechanical ventilation with 100% O2. Sedation was maintained using infusion rates of: 10, 20, 30, 40, 50 and 60 mg.kg-1.h.-1,
xii
groups were collected for histopathology, immunohistochemistry and plasma used for quantification of propofol and its non-conjugated metabolites whereas in the fourth study, mitochondria were isolated from livers by standard differential centrifugation for mitochondrial respiration, membrane potential, swelling and oxidative stress analysis (at the end of the 20h). Data were statistically treated using χ2-test or One-way ANOVA with Tukey or Kruskal–Wallis
analysis of variance (p<0.05).
As results from Chapter III, GC/IT-MS method was developed and validated in agreement with the international guidelines for analytical methods and propofol and its non-conjugated metabolites were successfully quantified in plasma and solid tissues (liver, heart, lung and kidney) from sedated rabbits. This method allowed the development a PK model to be used at short and prolonged infusions, as propofol pharmacokinetics changes with the infusion time. From Chapter IV, a two-compartment model with different central compartment volume and plasma clearance (separately modeled in the two populations) was the one that best described propofol concentrations. The time course curve of propofol plasma concentrations was well characterized by the PK model developed, which simultaneously accounts for propofol short and long infusions and can be used to optimize future PK studies in rabbits. In Chapter V, regarding propofol metabolism, the expression of CYP1A1 was more prominent than CYP1A2 in the liver and the kidney also seems to be involved in the extra-hepatic metabolism. Propofol may act as selective inhibitor of CYP1A1 and an inducer of CYP1A2 expression in different regions of the liver and its presence on a lipid emulsion evidences a protective effect on liver parenchyma, comparatively to the emulsion alone. Finally, in Chapter VI it was also shown that lipid vehicles (as SMOFlipid) can be involved in the regulation of different pathways that ultimately lead to a decrease of state 3 mitochondrial respiration rate and also that the presence of propofol during prolonged infusions seems to have a protective effect (antioxidant activity) regarding mitochondrial function. These results provided important new information and tools to improve the propofol use in Veterinary Anesthesia with respect to TCI and with possible interest for translational application to humans, by elucidating the potential toxicological effects of propofol, as Propofol Infusion Syndrome (PRIS).
Key-words: Propofol; Total Intravenous Anesthesia (TIVA); propofol pharmacokinetics (PK); Target-Controlled Infusion (TCI); Gas Chromatography – Ion Trap/ Mass spectrometry (GC/IT-MS); Adverse effects of propofol; Propofol Infusion Syndrome (PRIS)
xiii
adversos do propofol, usando o coelho como modelo animal, de forma a elucidar potenciais estratégias para aplicação e uso da Infusão Alvo-Controlada (IAC) e melhorar a segurança anestésica do propofol em meio clínico e de investigação. Deste modo, para atingir este objetivo principal, a presente Tese foi dividida em quatro estudos.
O primeiro estudo (Capítulo III) incluiu o desenvolvimento e a validação de um método analítico para a quantificação simultânea de propofol e dos seus metabolitos não-conjugados, usando a Cromatografia Gasosa com Espectrometria de Massa (GC-EM), em plasma e órgãos (fígado, coração, rim e pulmão). A prova de aplicabilidade desta metodologia testou a quantificação do propofol e os seus metabolitos não-conjugados no plasma e órgãos recolhidos de sete coelhos brancos Neozelandeses que foram submetidos a um protocolo de anestesia prolongado com uma infusão contínua de propofol que variou entre os 20 e os 60 mg.kg-1.h-1. O segundo estudo (Capítulo IV) teve como objetivo explorar o comportamento
farmacocinético (PK) do propofol durante infusões curtas e infusões longas, de forma a desenvolver um modelo PK com propofol para o coelho. Para tal, foram usadas duas populações de coelhos diferentes. A População 1 (P1), constituída por sete coelhos neozelandeses foi usada para caracterizar o perfil farmacocinético do propofol em infusões curtas. Os animais foram anestesiados com um bólus de 20 mg.kg-1 intravenoso seguido de
uma taxa de infusão de 50 mg.kg-1.h-1 (propofol 1%), que foi mantida durante trinta minutos.
Uma segunda população (População 2 (P2), n=7) foi sedada de acordo com as respostas dos principais reflexos e com o Index de Consciência (IoC), durante 20 horas consecutivas, usando propofol a 2%, o que permitiu uma caracterização do comportamento do propofol durante infusões longas. Amostras de sangue foram colhidas em tempos específicos e as concentrações plasmáticas de propofol foram quantificadas através da técnica de GC/IT-MS previamente validada. O programa NONMEM VII foi usado para avaliar as relações entre o tempo e as concentrações plasmáticas. O terceiro estudo (Capítulo V) avaliou a expressão enzimática da CYP1A1, CYP1A2 e a quantidade de propofol e seus metabolitos não-conjugados no fígado e rim de coelho, de forma a elucidar as vias metabólicas envolvidas na biotransformação do propofol. O quarto estudo (Capítulo VI) permitiu avaliar os efeitos da administração prolongada de propofol na bioenergética mitocondrial hepática de coelhos. Nestes dois últimos estudos, o delineamento experimental utilizado para ambos foi o mesmo. Vinte e um coelhos neozelandeses foram aleatoriamente alocados em três grupos e tratados continuamente durante 20 horas. Cada grupo de sete animais recebeu: NaCl 0,9% (soro fisiológico), SMOFlipid ® (veículo) e Lipuro ® 2% (propofol). Um bólus de 20 mg.kg-1 foi
xiv
20, 30, 40, 50 e 60 mg.kg .h , de acordo com a escala clínica de profundidade da anestesia e os valores do IoC, de forma a avaliar o nível de sedação durante 20 horas consecutivas. O veículo e o grupo salino receberam as mesmas taxas de infusão que o grupo propofol. No terceiro estudo, foram recolhidas amostras de fígado e rim de todos os grupos para histopatologia, imuno-histoquímica e de plasma, que foi utilizado para quantificação de propofol e os seus metabolitos não-conjugados. No quarto estudo, as mitocôndrias do fígado (colhido às 20h) foram isoladas por centrifugação diferencial e processadas para análise da respiração mitocondrial, stress oxidativo, swelling e potencial de membrana. Os dados foram tratados estatisticamente usando o teste χ2 ou análise de variância (ANOVA) seguido do teste
de Tukey ou o teste de Kruskal-Wallis seguido do teste de Dunn’s, de acordo com a normalidade dos mesmos (p<0.05).
Do Capítulo III resultou uma técnica analítica baseada na Cromatografia Gasosa com Espectrometria de Massa (CG-EM) que foi desenvolvida e validada de acordo com os requisitos internacionais para métodos analíticos, tendo sido o propofol e os seus metabolitos não-conjugados quantificados com êxito no plasma e em órgãos de coelhos. Este método permitiu o desenvolvimento um modelo PK para infusões curtas e prolongadas, uma vez que se verificaram alterações de farmacocinética propofol ao longo do tempo de infusão. Do Capítulo IV obteve-se um modelo bi-compartimental com diferente volume do compartimento central e clearance plasmática (modeladas separadamente nas duas populações) foi o que melhor descreveu as concentrações de propofol. A curva de concentração de propofol-tempo foi bem caracterizada pelo modelo PK desenvolvido, que simultaneamente contempla infusões curtas e longas de propofol, podendo ser usado para otimizar estudos e futuras técnicas PK em coelhos. No Capítulo V, relativamente ao metabolismo de propofol, a expressão da CYP1A1 foi mais intensa do que a CYP1A2 no fígado e o rim também parece estar envolvido no metabolismo extra-hepático do propofol. O propofol pode também atuar como inibidor seletivo da CYP1A1 e indutor da expressão da CYP1A2 nas diferentes regiões do fígado pelo que, a presença de propofol numa emulsão lipídica evidencia um efeito protetor no parênquima hepático, comparativamente à emulsão sozinha. Por último, no Capítulo VI foi também demonstrado que veículos lipídicos (como SMOFlipid) podem estar envolvidos na regulação de diferentes vias que conduzem a uma diminuição da taxa de respiração mitocondrial do estado 3 e que a presença de propofol durante infusões prolongadas também evidenciou efeito protetor (atividade antioxidante) na função mitocondrial. Os resultados obtidos neste trabalho fornecem novas informações e importantes ferramentas com respeito à (IAC) que visa melhorar o uso do propofol na Anestesia Veterinária e com interesse de
xv
Palavras-chave: Propofol; Anestesia Total Intravenosa (ATIV); farmacocinética (PK); Infusão Alvo-Controlada (IAC); Cromatografia Gasosa com Espectrometria de Massa (CG-EM); Efeitos adversos do propofol; Síndrome de Infusão do Propofol (SIP).
xvii
Abstract... xi
Resumo ... xiii
Table of Contents ... xvii
Index of Tables ... xxi
Index of Figures ... xxiii
List of abbreviations and acronyms ... xxv
Chapter I – General Introduction ... 1
ANESTHESIA ...1 1. Propofol ...1 1.1 Physicochemical characteristics ...1 1.2 Mechanism of action ...3 1.3 Pharmacokinetic properties ...3 1.3.1 Distribution ...6
1.3.1.1 Plasma Protein Binding ...6
1.3.2 Elimination ...6
1.3.2.1 Metabolism ...7
1.3.2.2 Excretion ...8
1.3.3 Population PK models ...8
1.4 Pharmacodynamics of propofol ...10
1.5 Adverse effects of propofol ...12
2. Total Intravenous Anesthesia and Target-Controlled Infusion...12
3. Propofol in Veterinary Anesthesia ...14
3.1 The rabbit as an animal and translational model of propofol studies ...15
4. Propofol Infusion Syndrome (PRIS) ...15
5. Analytical methods for the quantification of propofol ...17
6. Aims of the Thesis ...18
Chapter II – General Materials and Methods... 19
1. Animals ...19
2. Anesthesia and monitoring ...21
3. Samples acquisition ...24
xviii
in several biological matrices using Gas Chromatography/ Ion Trap –
Mass Spectrometry method ... 27
ABSTRACT...27
1. Introduction ...28
2.1 Drugs and reagents ...29
2.2 Equipment and software ...29
2.3 Stock and working solutions ...30
2.4 Standard solutions, quality controls and blank samples ...30
2.5 Chromatographic conditions ...31
2.6 Extraction procedure in plasma and organ tissues ...31
2.7 Bioanalytical method validation ...32
2.7.1 GC/IT-MS method validation ...32
2.7.2 Extraction procedure validation ...33
2.8 Method applicability ...33
2.8.1 Experimental protocol...34
3. Results ...34
3.1 Bioanalytical validation ...34
3.1.1 GC/IT-MS method validation ...34
3.1.2 Extraction validation ...41
4. Discussion ...41
5. Proof method applicability ...44
Chapter IV - Evidence of different propofol pharmacokinetics under short and prolonged infusion times in rabbits ... 47
ABSTRACT...47
1. Introduction ...48
2. Material and Methods ...49
2.1 Animals ...49
2.2 Propofol protocol administration ...49
2.3 Propofol blood sampling ...50
2.4 Anesthetic monitoring and data recording ...51
2.5 Propofol quantification in arterial blood samples ...52
xix
3.2 Propofol pharmacokinetic model ...58
4. Discussion ...62
Chapter V - Expression of CYP1A1 and CYP1A2 in the liver and kidney of rabbits after prolonged infusion of propofol ... 69
ABSTRACT...69
1. Introduction ...70
2. Methods ...71
2.1 Animals ...71
2.2 In vivo study: anesthesia and monitoring ...72
2.3 Blood biochemistry analysis ...73
2.4 Propofol and its non-conjugated metabolites quantification in plasma, liver and kidney. ...74
2.5 Organ sampling for histology ...74
2.5.1 Histology and immunohistochemistry ...74
3. Statistical analysis ...75
4. Results ...75
4.1 Clinical signs, blood biochemistry and concentrations analysis ...75
4.2 Macroscopic examination and histology ...78
4.3 CYP1A1 and CYP1A2 immunostaining ...79
5. Discussion ...82
Chapter VI - In vivo study of hepatic oxidative stress and mitochondrial function after propofol prolonged infusion ... 87
ABSTRACT...87
1. Introduction ...88
2. Materials and Methods ...89
2.1 Animals ...89
2.2 Anesthesia and monitoring ...89
2.3 Blood and organ samples ...90
2.4 Propofol quantification in plasma and liver ...91
2.5 Mitochondria isolation ...91
xx
2.9 Mitochondrial respiratory chain complex activities ...93
2.10 Hepatic oxidative stress assay ...94
3. Statistical analysis ...94
4. Results ...95
4.1 Clinical parameters and propofol concentration ...95
4.2 Histopathological report ...97
4.3 Effects on mitochondria respiratory chain function and mitochondrial coupling………. ...98
4.4 Effects on mitochondria respiratory chain complexes activities ... 100
4.5 Effects of propofol on oxidative stress ... 100
5. Discussion ... 103
Chapter VII – General conclusions and further considerations ... 109
References ... 113
Appendix A ... 127
Supplementary Data from Chapter VI ... 127
Appendix B ... 129
xxi
Table 1.1 – Main pharmacokinetic parameters estimates in different species based on the most relevant studies from humans and other species……….5 Table 1.2 – Main pharmacokinetic models with covariates in different species based on the most relevant studies from humans and other species………..…..10
Chapter II – General Materials and Methods
Table 2.1 – Summary of all experiments performed………..20
Chapter III - Simultaneous quantification of propofol and its non-conjugated metabolites in several biological matrices using Gas Chromatography/ Ion Trap – Mass Spectrometry method
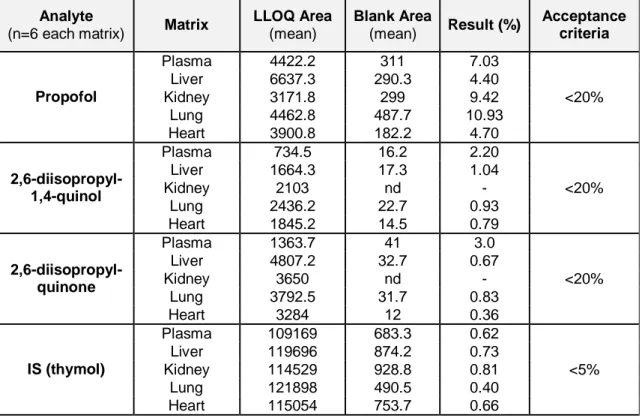
Table 3.1 - Selectivity validation of propofol, 2,6-diisopropyl-1,4-quinone and
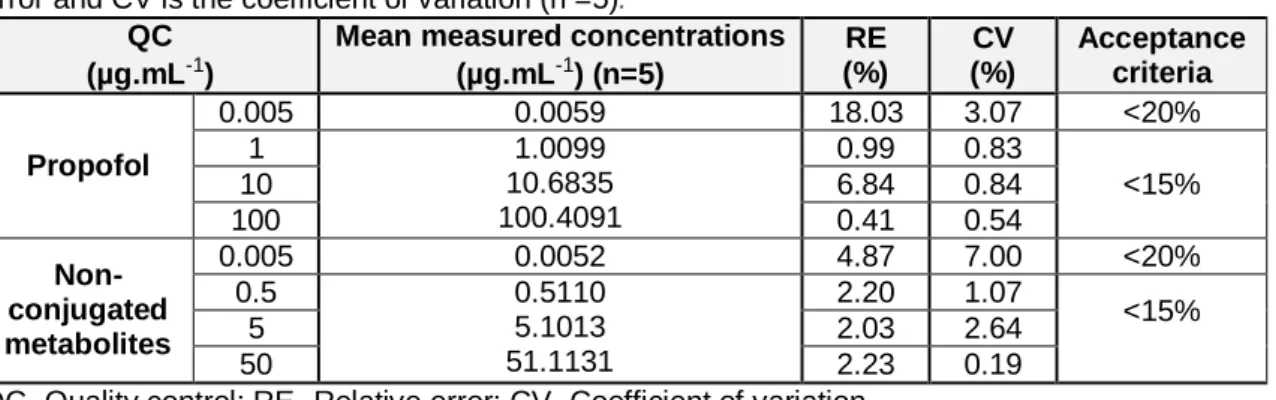
2,6-diisopropyl-1,4-quinol in different matrices (plasma, liver, kidney, lung and heart)……….36 Table 3.2 - Carry-over and matrix effect validation of propofol, 2,6-diisopropyl-1,4-quinone and 2,6-diisopropyl-1,4-quinol………...37 Table 3.3 - Back-calculated concentration of standard solution using calibration equation for propofol and non-conjugated metabolites………..…………39 Table 3.4 - Within-run accuracy and within-run precision data……….40 Table 3.5 - Between-run accuracy and between-run precision data...……….40 Table 3.6 - Results from stability studies of propofol and its non-conjugated
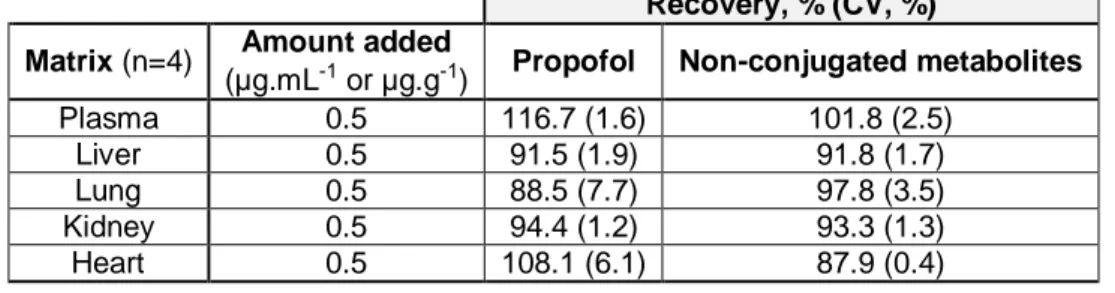
metabolites on stock solutions and ethyl acetate/ chloroform organic phase..………...41 Table 3.7 - Propofol and its non-conjugated metabolites recovered from each matrix
(plasma, liver, lung, kidney and heart) supplemented at 0.5 µg.mL-1 or 0.5 µg.g-1………..41
Chapter IV - Evidence of different propofol pharmacokinetics under short and prolonged infusion times in rabbits
Table 4.1 – Animals characteristics recorded before and during the short (P1) and long- term (P2) infusions……….………..56 Table 4.2 – Summary of model development protocol………...58 Table 4.3 – Final model PK population estimates, interindividual and residual variability of propofol and estimates from the bootstrap evaluation in 1000 replicates………59 Table 4.4 - Population and individual prediction errors of the final PK model. Population and individual predicted concentration errors after simulations of Cockshott and
xxii
Chapter V - Expression of CYP1A1 and CYP1A2 in the liver and kidney of rabbits after prolonged infusion of propofol
Table 5.1- Clinical data recorded in the anesthetized animals (propofol group) during the 20h of anesthesia………..………..76 Table 5.2 - Blood biochemistry measurements in saline, vehicle and propofol groups at the specific time-points (T0, T6, T12, T18 and T20)...…...77 Table 5.3 – CYP1A1 immunostaining scores in the liver of the animals from the groups under study……….………..81 Table 5.4 – CYP1A2 immunostaining scores in the liver of the animals from the groups under study……….………..82
Chapter VI - In vivo study of hepatic oxidative stress and mitochondrial function after propofol prolonged infusion
Table 6.1- Clinical data from anesthetized animals (propofol group) during the 20h
of anesthesia………...……….95 Table 6.2- Blood biochemistry results obtained in the different study groups (saline,
vehicle and propofol group) among 12 and the 20h of drug infusion……….…………..…97 Table 6.3 – Results from respiratory chain activity when different substrates obtained from different mitochondrial preparations for each experimental group energized with
pyruvate-malate or succinate……….………...……….99 Table 6.4 – Propofol effects on liver mitochondrial respiratory chain activities after the
20h infusion in the 3 groups………..100
Appendix A
Supplementary Data from Chapter VI:
Table S1- Blood biochemistry measurements (Mean ± SD, n=7) in saline, vehicle and propofol group during the 20h of drug infusion………..127
xxiii
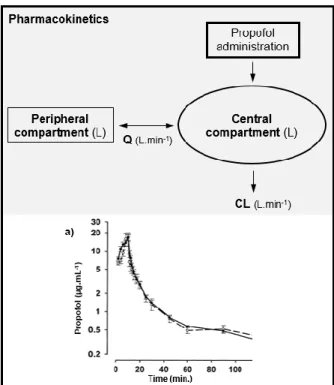
Figure 1.1 - Schematic illustration of propofol pharmacokinetics described by a
representative two-compartment model……….………4 Figure 1.2 - Schematic illustration of propofol pharmacokinetics and pharmacodynamics described by a representative two-compartment model with the additional effect-
site compartment……….11
Chapter II – General Materials and Methods
Figure 2.1 - Experimental studies implemented to attain each objective of
this Thesis……….………23
Chapter III - Simultaneous quantification of propofol and its non-conjugated metabolites in several biological matrices using Gas Chromatography/ Ion Trap – Mass Spectrometry method
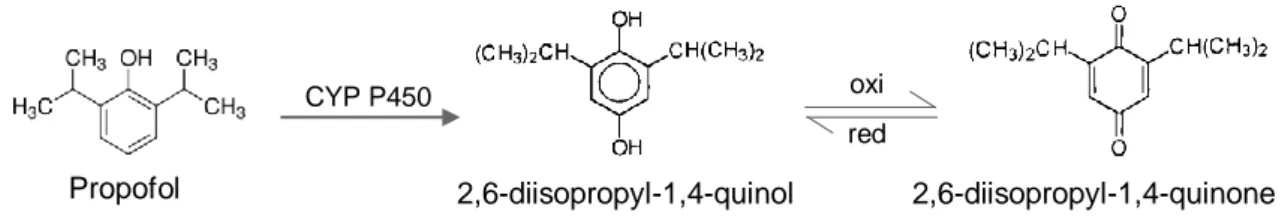
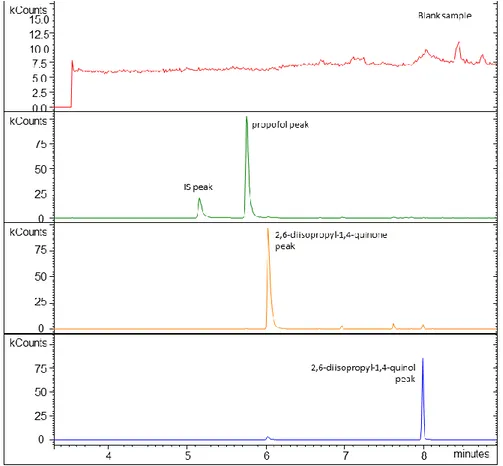
Figure 3.1 – Molecular structure of propofol (2,6-diisopropylphenol), 2,6-diisopropyl-1,4- quinol and 2,6-diisopropyl-1,4-quinone………29 Figure 3.2 - Representative fullscan chromatograms showing a blank sample and
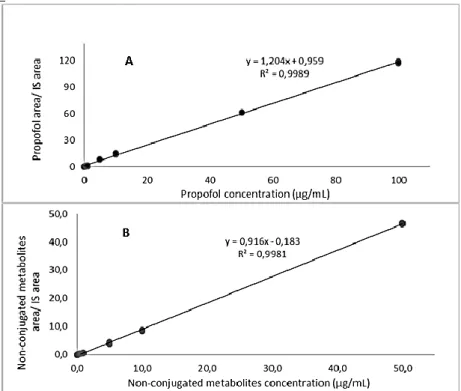
the separation of the analytes from the matrix………...35 Figure 3.3 – A) Calibration curve obtained with propofol standard solutions. B)
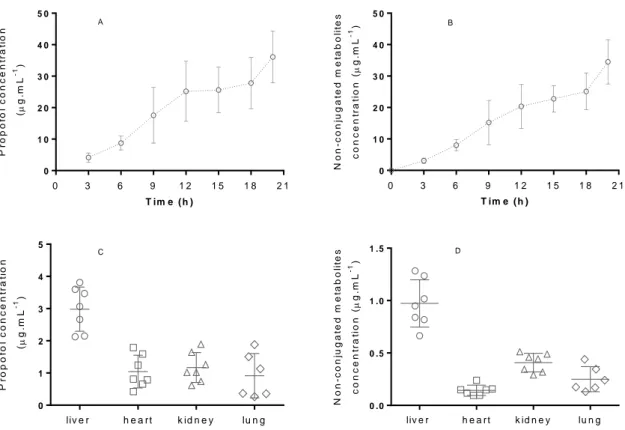
Calibration curve obtained with non-conjugated metabolites of propofol standard solutions…38 Figure 3.4 - Plasma concentrations of propofol and its non-conjugated metabolites along the 20h of continuous anesthesia in the six animals. Propofol and non-conjugated metabolites concentrations obtained in each animal, in different tissues (liver, heart, kidney and lung).….45
Chapter IV - Evidence of different propofol pharmacokinetics under short and prolonged infusion times in rabbits
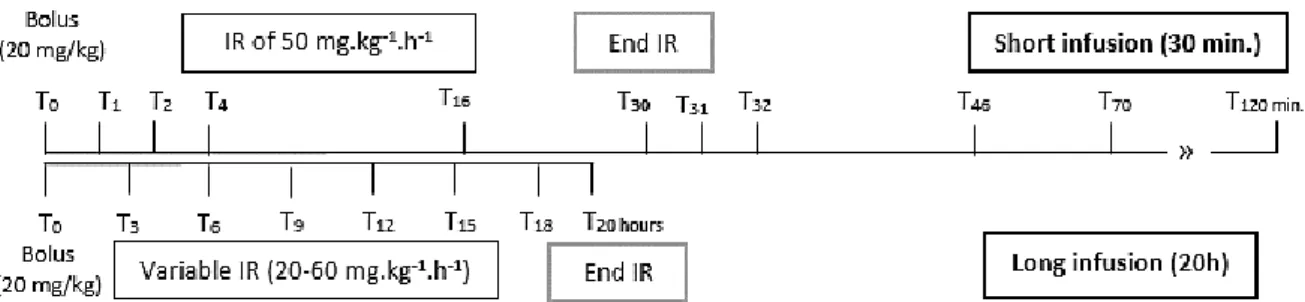
Figure 4.1 – Illustrative representation of the implemented protocol………….………..51 Figure 4.2 – Time course of the measured propofol concentrations in all animals during the two different regimens of propofol………..……….57 Figure 4.3 – PK model used to describe propofol in rabbits: two-compartment model……....59 Figure 4.4 – Goodness-of-fit plots of the population pharmacokinetic model
xxiv
predictive check...62
Chapter V - Expression of CYP1A1 and CYP1A2 in the liver and kidney of rabbits after prolonged infusion of propofol
Figure 5.1 – Propofol biotransformation pathways via CYP 450 and UGT enzymes……….…70 Figure 5.2 – Propofol (plot A) and its non-conjugated metabolites (plot B) concentrations measured in plasma, liver and kidney of the rabbits subjected to 20 hours
of anesthesia………78 Figure 5.3 – Representative sections of liver stained with H&E (A to C) and red oil
(D to F) from the groups under study…...……….………79 Figure 5.4 – Immunostaining for CYP1A1 (A to F) and CYP1A2 (G to I) in the liver
samples from the groups under study….………..………...80 Figure 5.5 – Immunostaining for CYP1A1 (A to C) and CYP1A2 (D to F) in the kidney
samples from the groups under study …..………81
Chapter VI - In vivo study of hepatic oxidative stress and mitochondrial function after propofol prolonged infusion
Figure 6.1 - Microscopic images (H&E) of liver from animals of each study group: S
(saline), V (vehicle) and P (propofol) at the end of the 20 hours of treatment……….….98 Figure 6.2 - Mitochondrial swelling results observed in all three groups (propofol, vehicle and saline)……….……99 Figure 6.3 - Effects of propofol and vehicle on the activities of enzymatic and non-enzymatic antioxidants obtained from different mitochondrial preparations for each
xxv ALT - alanine aminotransferase
ALP - alkaline phosphatase
AST - aspartate aminotransferase BW – body weight
BSA - bovine serum albumin Bpm – beats per minute Ca2+ - calcium ion
CAT – catalase
CNS – central nervous system CL – clearance CLB – body clearance Cl- - chloride CI95 – confidence interval 95% CV – coefficient of variation CK - creatine kinase
GC-EM - Cromatografia Gasosa com Espectrometria de Massa cHCO3- - concentration of bicarbonate ion
cAIC – corrected Akaike information criteria CYP – cytochrome
DGAV - Direção Geral de Alimentação e Veterinária DABP - diastolic arterial blood pressure
df – degrees of freedom
DNPH - 2,4-dinitrophenylhydrazine DCPIP - 6,6-dichlorophenolindophenol DL – detection limit
DoA - depth of anesthesia
xxvi EMA - European Medicines Agency
ESI - electrospray ionization ETCO2 - end-tidal carbon dioxide
FDA - Food and Drug Administration
FELASA – Federation of European Laboratory Animals Science Associations FCCP - carbonylcyanide p-trifluoromethoxyphenylhydrazone
GABAA - gama amino butyric acid – subtype A
GABAB - gama amino butyric acid – subtype B
GC/MS - gas chromatography/mass spectrometry
GC/IT-MS - gas chromatography/ ion trap – mass spectrometry GSH – glutathione
GSSG – oxidized glutathione GPx – glutathione peroxidase H&E – haematoxylin and eosin HR - heart rate
HPLC – high liquid performance chromatography h – hour
IAC – infusão alvo controlada ICU – intensive care unit
ICI – Imperial Chemical Industries
ICH - International Conference Harmonization IS – internal standard
IoC - Index of Consciousness IR – infusion rate
IV – intravenous k - constant
ke0 - elimination constant of propofol from the effect compartment
xxvii LDH - lactate dehydrogenase
LC - liquid chromatography LCTs - long chain triglycerides LPO – lipid peroxidation
LLOQ – lower limit of quantification
NC3Rs – National Center for the Replacement, Refinement & Reduction of Animals in Research
MABP - mean arterial blood pressure MCTs - medium chain triglycerides Mg2+ - magnesium ion
Min. – minutes
mmHg – millimeters of mercury
MOFV – minimum objective function value Na+ - sodium ion
NaCl – sodium chloride NMDA - N-methyl-D-aspartate
NADH – nicotinamide adenine dinucleotide NBT – nitrobluetetrazolium
OFV - objective function value OPA - ortho-phthalaldehyde PD - pharmacodynamic PK – pharmacokinetic
PaO2 - partial pressure of oxygen
PONV - post-operative anesthetic nausea PRIS – propofol infusion syndrome P1 – population 1
P2 – population 2
xxviii
Q+OH – non-conjugated metabolites sum (quinol and 2,6-diispropyl-1,4-quinone)
QSQEM - quadratic square of quadratic error mean QSQE - quadratic square of quadratic error
RSS – residual sum of squares R2 - correlation coefficient
RE – relative error
REM – relative error mean RCR – respiratory control ratio RR – respiratory rate
ROS – reactive oxygen species
SABP - systolic arterial blood pressure SpO2 - arterial blood oxygen saturation
SIP – síndrome de infusão do propofol SBV - shed-blood volume
SOD – superoxide dismutase TIVA – total intravenous anesthesia TCI – target controlled infusion T - temperature
TB – total bilirrubin TP - total proteins
TBARS - thiobarbituric acid reactive substance Vc – volume of central compartment
VP - volume of peripheral compartment
VPC – visual predictive check
MVOF - minimum objective function value variation ΔΨ – mitochondrial transmembrane potential
1
Chapter I – General Introduction
ANESTHESIA
Among all the great discoveries in Medicine, the implementation of anesthesia by the control of hypnosis and the absence of pain remains one of the very few techniques that has revolutionized surgeries and positively affected the quality and extent of human and animal lives. It was in 1846, in the hands of Thomas Morton, that one of mankind's greatest fears, aware painful surgery, was abolished [1]. General anesthesia has started.
A few years later, in the 1850s, G. H. Dadd, a physician turned veterinarian, prompted the use of general anesthesia as a routine for animal surgery, as animals have similar biochemical pathways and pain perception as humans. Only in 1973, A. J. Holland described anesthesia as an important refinement and improvement tool in animals used for scientific purposes [2].
Anesthesia is a relatively young field which is rapidly evolving and improving. Currently, the concept of ‘anesthesia’ comprises analgesia, muscle relaxation and a reversible state of unconsciousness. This last state, also known as hypnosis, occurs by inducing depression of the central nervous system (CNS) [1]. To perform safe and accurate anesthesia, a combination of several drugs can be used and associated with specific delivery techniques and monitoring systems that optimize anesthesia and patient safety.
In this Chapter, propofol pharmacokinetics and the main adverse effects of its infusion will be discussed.
1. Propofol
The properties of propofol as an hypnotic drug were initially documented in 1973 by ICI (Imperial Chemical Industries) in Cheshire, England [3]. However, propofol was only introduced in clinical practice in 1989. Through the last decades, this new injectable anesthetic had become more and more popular, turning itself the drug of choice from simple sedation to complex medical procedures that required the induction and maintenance of general anesthesia, both in humans and in other species [4]. Currently, it is also considered a drug of abuse [5].
1.1 Physicochemical characteristics
Propofol (2,6-diiopropylphenol) is an alkyphenol that consists in a simple phenol substituted with two isopropyl groups in each of the positions adjacent to the hydroxyl group [6]. This anesthetic is a highly lipophilic drug having a good miscibility and formulation stability in lipophilic vehicles or organic solvents. The critical point in the propofol preparation is the
2 capacity to adjust a biocompatible vehicle that ensures acceptable pharmacodynamic activities and minimal side effects [7]. The first formulation introduced in the clinical trials was prepared using polyoxyethylated castor oil (Cremaphor EL) as surfactant with 1% of propofol in 16% vehicle [8] but this mixture was unstable [9], causing undesirable effects such as: painful injection [10], anaphylactic reactions [11], potential for sepsis [7] and hyperlipidemia-related side effects [12]. These undesired effects raised the need to develop a safer alternative to this formulation [13, 14]. Nowadays, relatively stable lipid presentations are routinely used in the most diverse clinical settings. The classical formulation of propofol currently consists in 1% or 2% of propofol in a lipid vehicle, such as Intralipid, a parental nutritional agent based on 10% soybean oil, 2.25% glycerol and 1.2% purified egg phosphatide [15, 16], where each compound has a specific role in the final emulsion formulation [7]. Lipid preparations of propofol are highly concentrated in the emulsified oil droplets of average diameter of 0.15 to 0.3 μm which easily diffuse through cell membranes [7]. The pH of these preparations may range between 6.0 and 8.5 to ensure good emulsion stability and appear as slightly viscous milky substances that remain stable at room temperature and in the presence of light [17]. It can be used alone or diluted with 5% dextrose or NaCl 0.9% solutions [18]. Some emulsions may contain excipients such as EDTA or sulfite to avoid bacterial growth [7] however, the commonly available products contain no antimicrobial preservatives which means that any content of an opened ampoule must be used within 6 hours [16].
Numerous attempts to overcome the disadvantages of the lipid emulsion have been exhaustively tested. To improve propofol formulation, increases in propofol concentrations (propofol 2% and 6%), emulsion preparations containing less than 10% oil (Ampofol®, Amphastar Pharmaceuticals) or containing oils with different fatty acid contents or proteins (albumin) include some of the modifications that have been developed to produce a safer compound [7, 19]. Diprivan®, 1% propofol in 10% soybean oil emulsion has predominantly LCTs (Long Chain Triglycerides) when compared with Propofol-Lipuro® that contains mixed MCTs (Medium Chain Triglycerides) – LCT and 1% propofol. This MCT-LCT combination showed to be better tolerated in humans and other animal species as it provides faster triglyceride metabolism and elimination, does not affect the pharmacokinetics or pharmacodynamics of propofol and is less painful when injected [20, 21]. Alternatives to emulsion vehicles can be found in non-emulsion formulations which contain cyclodextrins or poloxamers which can be used to increase solubility, dissolution rate and the stability of drugs. Cyclodextrins are capable of generate inclusion complexes with lipophilic drugs [22] whereas poloxamers consist of nonionic surfactants that form a pluronic micelle in the presence of propofol [7]. However, pharmacodynamic studies showed that recovery times were longer comparatively to the propofol emulsion [23]. Finally, water-soluble prodrugs such as
3 hemisuccinates or phosphate monoesters (fospropofol, commercially known as Aquavan® or Lusedra®), also represent an alternative to lipid emulsions and have been of major interest in last decades [24]. These compounds, once delivered into the blood stream are enzymatically converted to propofol, inorganic phosphate and formaldehyde (and are seen as the ultimate formulation of propofol) [25, 26]. This prodrug exhibits a longer half-life, increased volume of distribution and delayed onset comparatively to lipid emulsions [27], which makes it more suitable for long-term sedation than anesthesia [28].
1.2 Mechanism of action
After decades of studies involving propofol, the exact mechanism of action of this drug remains unclear. Comparable to other intravenous anesthetics, propofol hypnotic effects in CNS are thought to result from the direct activation of the GABAA (Gama Amino Butyric Acid
– subtype A) receptors, involving a positive modulation of the inhibitory synaptic function of this neurotransmitter [29], in a reversible and dose-dependent manner [30]. GABAA receptors
are ligand-gated ions channels coupled to an integral Cl- channel, where receptor activation
rapidly increases Cl- conductance. This leads to cell membrane hyperpolarization and
prevention of further actions of potential propagation [29, 30]. GABAB, glycine, nicotinic as well
as NMDA (N-methyl-D-aspartate) subgroup of glutamate receptors [31] are also thought to be sensitive targets of propofol but in a less extent [30].
1.3 Pharmacokinetic properties
In all species, propofol is exclusively given by intravenous route. Once administered into the blood stream, propofol diffuses across the droplet interface of the lipid-based vehicle and is freely released in the blood. This process depends on the drug concentration gradient, partition coefficient, diffusivity capacity and interfacial area of the drug containing oil droplets [32]. Propofol strongly binds to plasma proteins and lipid fractions (98%) [33, 34]. The amount of unbound propofol depends on its total concentration in blood and only free drug is responsible for the pharmacological effects [34]. Propofol is immediately distributed from the vascular pool to the highly perfused tissues, being the brain the key target organ for clinical effect, followed by the poorly perfused tissues [35]. After a bolus or short-time infusion, the rapid and curvilinear decline in propofol plasma levels is noticed with time, as the concentration gradient results in rapid redistribution from the CNS back to blood stream and the highly perfused organs and muscle tissues (Figure 1.1). Finally, propofol redistribution occurs from the poorly perfused tissues (as adipose ones) [16, 36] defining the recovery time. The pharmacokinetic profile of propofol is usually described through the sum of two or three
4 exponential functions that include: fast distribution from blood into tissues; rapid metabolic clearance and slow return of the drug from a poorly perfused deep compartment (probably fat tissue) into the blood [37].
Figure 1.1 - Schematic illustration of propofol pharmacokinetics described by a representative two-compartment model. A typical propofol plasma concentration versus time curve (a)) is also showed. Q – Intercompartimental clearance; CL – Clearance. Adapted from Anderson 2013 [38] and Johnson et al. 2004 [39].
The rapid penetration of the blood-CNS barrier and distribution into the CNS by propofol justifies its rapid uptake and onset of action [40]. The short duration of action results from its redistribution from the brain to other tissues, like muscle and fat [41]. For these motives propofol plasma concentrations decline, within ten minutes, to less than 1 μg.ml-1, after a single
bolus dose of 2.5 mg.kg-1, allowing the awakening from anesthesia in humans [40, 42].
From a pharmacokinetic point of view, propofol remains the best controllable intravenous hypnotic, since it has a large body uptake combined with a fast elimination due to a large apparent volume of distribution and a high clearance [43]. During the last decades, the growing knowledge about the pharmacokinetic properties of propofol allowed a continuous remodeling of pooled data, describing together information of clinical trials and adequate modeling for the species in which it is used [43, 44]. Propofol pharmacokinetics after a single bolus or short-time infusion is well described in humans and also in other species [34, 36, 45-49]. Regarding long-term infusions, propofol pharmacokinetics is only described in human patients [50, 51]. A general overview of the main PK parameters described on the most relevant studies with humans and other animal species is summarized in Table 1.1.
5
Table 1.1 – Main pharmacokinetic parameters estimates in different species based on the most relevant studies from humans and other species.
Reference Specie Administration
mode Other drugs used Obtained PK parameters Marsh et al.
1991 [46] Human Short infusion
Nitrous oxide; bupivacaine
Three-compartment model: V1= 0.228 L.kg-1; V2= 0.463 L.kg-1; V3= 2.89 L.kg-1; k10= 0.119
min-1; k
12= 0.112 min-1; k13= 0.042 min-1; k21= 0.055 min-1; k31= 0.0033 min-1;
Schnider et
al. 1998 [52] Human
Bolus + infusion
(1h) -
Three-compartment model: V1= 4.27 L; V2= 18.9 L; V3= 238 L; k10= 0.443 min-1; k12= 0.302
min-1; k
13= 0.196 min-1; k21= 1.29 min-1; k31= 0.0035 min-1
Knibbe et al.
2002 [33] Human
Long infusion
(2-5 days) - Two-compartment model: CL= 2.1 L.min
-1; V1= 20.5 L; Q= 1.4 L.min-1; V
2= 150 L
Bienert et al.
2010 [53] Human
Long infusion
(2-4 days) - Two-compartment model: CL= 2.65 L.min
-1; V1= 27.7L; CLB=2.73 L.min-1; V 2=801 L Cockshott et al. 1992 [36] Dog Bolus + infusion (4h) -
T ½ α= 7.4 min; T ½ β= 53 min; T ½ ɣ= 725 min; Vdss= 6600 (mL.kg-1); CLB= 34 (mL.kg-1 .min-1); V= 1000 (mL.kg-1) Nolan et al. 1993 [54] Dog Bolus + infusion (1h) Nitrous oxide; acepromazine; papaveretum
T ½ α= 1.2 min; T ½ β= 14 min; T ½ ɣ= 96 Vdss=486 (mL.kg-1); CLB= 51 (mL.kg-1.min-1); V 1=
4384 (mL.kg-1)
Reid & Nolan
1993 [55] Dog Single bolus
Halothane; nitrous oxide; acepromazine
T ½ α= 0.78 min; T ½ β= 70 min; Vdss= 3589 (mL.kg-1); CLB= 40 (mL.kg-1.min-1); V 1= 466
(mL.kg-1)
Cockshott et
al. 1992 [36] Rat Single bolus -
T ½ α= 3.5 min; T ½ β= 33 min; T ½ ɣ= 383 min; Vdss= 9900 (mL.kg-1); CLB= 72 (ml/kg/min);
V1= 900 (ml.kg-1)
Cockshott et
al. 1992 [36] Pig Single bolus -
T ½ α= 4.9 min; T ½ β= 57 min; Vdss=620 (ml.kg-1); CLB= 76 (mL.kg-1.min-1); V
1= 1560 (mL. kg-1) Johnson et al. 2003 [48] Pig Short infusion (10 min) Ketamine, isoflurane,tiletamine, zolazepam, xylazine
Three-compartment model: V1= 2.4L; V2= 9.1L; V3= 113.0L; CL1= 1.2 L.min-1; CL2= 1.1
L.min-1; CL
3= 1.0 L.min-1
Cockshott et
al. 1992 [36] Rabbit Single bolus -
T ½ α= 2.1 min; T ½ β= 17 min; Vdss=460 (mL.kg-1); CLB= 337 (mL.kg-1.min-1); V
1= 1330 (mL.kg-1) Bienert et al. 2012 [49] Rabbit Bolus + infusion (10 min) -
Two-compartment model: V1= 7.67L; k10= 0.260 min-1; k12= 0.328 min-1; k21= 0.0191 min-1;
CL= 1.5 (L.min-1) Vdss= 139L
Reid et al.
1993 [56] Goat Single bolus Halothane
T ½ α= 0.71 min; T ½ β= 15.5 min; Vdss= 2560 (mL.kg-1); CLB= 275 (mL.kg-1.min-1); V 1= 658
(mL.kg-1)
Bester L. 2009
[57] Cat Single bolus Isoflurane
T ½ α= 25.7min; T ½ β= 43.2 min; T ½ ɣ= 1747.6 min; Vdss= 8440 (mL.kg-1); CLB= 8.6
(mL.kg-1.min-1); V
1= 566 (mL.kg-1)
V1 – volume of central compartment; V2 - volume of the rapid peripheral compartment; V3 - volume of the slow peripheral compartment; k - constant between compartments; T ½
α, T ½ β and T ½ ɣ - plasma concentration half-lives of α, β and ɣ decay curves; Vdss - apparent volume of distribution at steady-state; CLB - total body clearance; CL1 -metabolic
6
1.3.1 Distribution
As an extremely lipophilic drug, propofol can rapidly distribute from blood into tissues and organs. Propofol shows an initial distribution half-life of 2-8 minutes followed by slow distribution half-life ranging from 30 to 70 minutes which are due to its high metabolic clearance [58]. Children require higher induction and maintenance doses of propofol per kg of body mass than adults due to the higher volume of distribution and clearance [59]. It is also known that propofol distribution and pharmacokinetic parameters depend on cardiac output and hepatic blood flow [60, 61]. After intravenous administration, propofol makes a first pass through the heart and lungs subsystem, before getting in the systemic arterial blood. From there on, it spreads to all the body organs, including those responsible for drug clearance and distribution for the rest of the body (the second subsystem) before it can re-circulate and be measured in arterial blood [60]. Those two passages occur simultaneously and propofol is essentially added to a stream of blood flowing at a rate determined by the cardiac output [60]. Changes in the cardiac output demonstrated an evident effect on arterial and brain concentrations of propofol [62] and also in the liver blood flow, influencing the elimination of drugs with high hepatic extraction ratios [63], such as propofol.
1.3.1.1 Plasma Protein Binding
Propofol is a weak organic acid that remains entirely unionized at pH 7.4. In all species, it can get extensively bound to plasma proteins (98%), especially to albumin (50%) and red blood cells (48%) [36, 64]. These bounds are included as a part of the central compartment which is active and available for distribution to other tissues [64]. Only 2% of given propofol remain unbounded in blood stream [64], being responsible for the pharmacological effect (hypnosis) [34]. Plasma proteins binding of propofol do not seem to change with age but very low albumin concentrations may increase propofol free fraction (unbounded to plasma proteins), particularly during prolonged administrations [65, 66].
1.3.2 Elimination
As hypnotic agent, the success of propofol is due to its unique profile of action, redistribution and rapid metabolic clearance and elimination. The principal pathway of elimination is the hepatic metabolism into sulphate and glucuronic conjugates that have no hypnotic activity and are excreted in urine [67, 68]. In previous studies, it has also been reported an extrahepatic clearance of propofol in humans, thought to occur in the lungs, brain, gut and kidneys, and/or extra-renal elimination, since the metabolic clearance exceeds hepatic
7 blood flow [68, 69]. In a geriatric population, the elimination of propofol is slower, which is related mainly to the reduced hepatic flow and cardiac output [70].
The ending effects of most anesthetic agents is related with their redistribution from the brain to tissues which is generally much faster than the elimination rate of the drug from poorly perfused tissues [40]. In a short continuous infusion system, the duration of effects continues until steady-state is reached in-between compartments, indicating that accumulation has occurred among them but at different times. At this phase, the distribution equilibrium is reached, where the rate of introduction of the drug is equal to the rate of removal of the drug from the body, through metabolism and excretion. The elimination half-life is representative of the duration of effect [40]. Although the recovery from propofol anesthesia is also rapid, the elimination half-life of the drug is high [41, 71]. According to Shafer (1992), this occurs because of the slow elimination of propofol from the highly lipophilic tissue compartments (e.g. adipose tissue) and the propofol concentration reached in blood during this phase is irrelevant in clinical situations [72].
Hiraoka et al. (2005) reported that total body clearance of propofol was unaltered by changes in protein binding due to the high hepatic extraction ratio of propofol, which indicates that the hepatic clearance is blood flow-limited [73]. However, the metabolic clearance of propofol can exceed hepatic blood flow, indicating that this anesthetic has extra-hepatic sites of metabolism and elimination [74]. One of the most important characteristics that makes propofol clinically and pharmacokinetically different from other intravenous agents is its rapid metabolic clearance [72]. The distribution clearance of an intravenous anesthetic drug is a measure of the movement of the drug from the central compartment, the instantaneously equilibrating tissues including blood and highly perfused tissues, into tissues with lower blood flow [72]. Clearance of propofol occurs by metabolism, with urine being the major route of metabolites elimination in rabbits and humans [75].
1.3.2.1 Metabolism
Metabolism of drugs normally involves biotransformation (phase I) that converts lipophilic compounds into hydrophilic ones. Thereafter, these compounds suffer conjugation (phase II) and if the final substance has a high molecular weight it is excreted by the bile but, if it has a low molecular weight, it is eliminated in the urine [76].
In humans, after the administration of a sub-anesthetic dose of propofol, only 0,3% is eliminated in the urine, which means that the principal pathway of elimination is via metabolism [77]. Propofol is predominantly metabolized by oxidation into 2,6-diisopropyl-1,4-quinol and 2,6-diisopropyl-1,4-quinone (isomeric forms) followed by glucuronidation (50-70%) but also by sulphation [78]. In vitro studies suggest that both processes occurs essentially in the liver, by
8 specific enzymes (UGT (uridine diphosphate glucuronosyltransferase) and cytochrome P450 enzymes) that prevent the saturation of redistribution sites during long periods of administration [36], and result in the formation of inactive metabolites that are excreted in the urine [79]. In humans, CYP2B6 contributes to the biotransformation of propofol and appears to be the principal determinant of the inter-individual variability in the oxidation of this drug by human liver microssomes [80]. In studies designed to investigate the molecular basis for dog breed differences in propofol metabolism, CYP2B11 was assessed as the principal hepatic propofol hydroxylase [81]. Simons et al. (1991) and Le Guellec et al. (1995) in their studies noticed that the high metabolic activities obtained in rabbit liver samples were consistent with the above mentioned in vivo studies, indicating that glucuronidation is also the main metabolic pathway in this species [75, 82]. Human liver microssomes exhibited greater glucuronidation activity than rabbits, followed by rats. Concerning kidney microssomes from these animals, they were able to glucuronidate propofol, demonstrating that extrahepatic metabolism of propofol exists [82]. Raoof et al, 1996 also showed the contribution of the gut and kidney in propofol extrahepatic metabolism of humans [83] and a minor involvement of lungs is described [84]. Similarly, a small portion of propofol biotransformation occurs in the brain via UGT isoforms [85].
1.3.2.2 Excretion
One of the routes of metabolism consists in the glucuronidation of the parent compound. UGT family enzymes have been shown to mediate this reaction. Propofol also undergoes ring hydroxylation via CYP isoforms (that include CYP2C9 and 2A6 in humans, 2B11 in dogs and 2C11 and 2B1 in rats) to form 4-hydroxypropofol (or 2,6-diisopropyl-1,4-quinol), which is then glucuronidated or sulphated [86]. The resultant metabolites are excreted mainly in urine [29].
In a previous study of Simons et al. (1991) with rabbits, the inactive metabolites of propofol were excreted mainly in urine, whereas in feces were less than 2% [75]. According to that work, rabbit urine contains the glucuronide and sulphate conjugates of propofol, the 4-hydroxypropofol and conjugates of hydroxylated derivatives of propofol. The small proportion of these metabolites in feces, indicate that the biliary route is not important in rabbits [75].
1.3.3 Population PK models
Population pharmacokinetics (Pop PK) is defined as the study of the variability in drug concentrations among individuals, including healthy ones, accounting for the variability in terms of patient characteristics such as age, renal function or disease state [87]. Pop PK analysis using nonlinear mixed effects modeling approach implemented in NONMEM (ICON
9 Development Solutions, Ellicott City, MD, USA) have become an integral part of model-based drug development and optimization, estimating the impact of physiological and demographic factors that may affect the PK [88]. Exploratory data analysis (graphical and statistical summary) should be performed previously to the development of a structural and statistical model, which may include representative covariates for the fixed effects. Currently, results from population analyses are most frequently used to characterize the PK in the target population, to provide PK data in specific populations (elderly, children, etc.) and to support dosing recommendations for these populations [87]. Younger individuals may require higher induction and maintenance doses of propofol per kg due to higher volume of distribution and drug clearance then in older subjects (geriatric individuals), where elimination of propofol tends to be slower due to reduced hepatic flow and cardiac output [59]. So, propofol pharmacokinetic models included covariates as age, body weight or gender, as they can highly influence PK parameters (Table 1.2).
As previously mentioned, the disposition kinetics of propofol has been extensively described using various multicompartmental PK models. In humans, the Marsh et al. 1991 model is historically important because it has been incorporated in the first commercially available TCI system however this model only has weight as covariate, showing an increased bias and inaccuracy when used in elderly patients [46, 89]. Schnider et al. 1998 developed a three-compartment model whereby age, height, weight and lean body mass (LBM) were included as covariates [52]. Knibbe et al. 2002 developed a two-compartment model when propofol is used for long-term infusion in humans and included the body temperature and the serum triglycerides concentration. Concerning to rabbits, there are only two PK models described, as shown in Table 1.1. Cockshott et al. 1992 did not included any covariate in its model. However, Bienert et al. 2012 included body weight as main covariate and, as a result of the day time influence on propofol pharmacokinetics (chronopharmacokinetics), three different PK models were obtained (at 10, 16 and 22h) [36, 49]. All these models assume that propofol is administered into a central compartment, from which is eliminated. From the central compartment, the drug is distributed into a rapidly equilibrating peripheral compartment and more slowly into a third compartment when it is justifiable [90]. Non-compartment models did not enclose covariates (Table 1.2). More recently, new insights on PK modeling are focused on physiological models that can provide a more accurate description of drug disposition during the different stages of drug administration (bolus, short and prolonged infusion). Though, difficulties regarding the collection of extensive data for the model development (as first-pass effects, intravenous mixing in relation to the cardiac output and pulmonary uptake, etc) have limited their applicability [91].
10
Table 1.2 – Main pharmacokinetic models with covariates in different species based on the most
relevant studies from humans and other species.
Reference Specie Administration
mode Obtained PK models with covariates
Marsh et al.
1991 [46] Human Short infusion
Three-compartment model: V1= 0.228 L.kg-1; V2= 0.463 L.kg-1; V3= 2.89 L.kg-1; k10= 0.119 min-1; k12= 0.112 min-1; k13= 0.042 min-1; k 21= 0.055 min-1; k31= 0.0033 min-1; Schnider et al. 1998 [52] Human Bolus + infusion (1h)
Three-compartment model: V1= 4.27 L; V2= 18.9-0.391x(age-53
L; V3= 238 L; k10= 0.443+0.0107x(weight-77)-0.0159x(LBM-59)+0.0062x(height-177) min-1; k 12= 0.302-0.0056x(age-53) min-1; k 13= 0.196 min-1; k21= [1.29-0.024x(age-53)]/[18.9-0.391x(age-53)] min-1; k 31= 0.0035 min-1 Knibbe et al. 2002 [33] Human Long infusion (2-5 days)
Two-compartment model: k10= (2.2+0.27x body
temperature-0.049x triglycerides concentration) L.min-1; V
1= 22.2 L; CLB= 1.5 L.min-1; V 2= 168 L Bienert et al. 2010 [53] Human Long infusion (2-4 days)
Two-compartment model: CL= 2.65x(1-0.00714x(systolic
blood pressure -135)) L.min-1; V
1= 27.7L; CLB=2.73 L.min-1; V2=801 L Johnson et al. 2003 [48] Pig Short infusion (10 min) Three-compartment model: V1=(-0.4*SBV)+4.7L;V2 =(-0.3*SBV) + 16.7L; V3= (-2.3*SBV)+232.7L; CL1 =(-0.02*SBV)+1.6L.min-1; CL 2= (-0.1*SBV)+4.6 L.min-1; CL3 =(-0.3*SBV)+1.9 L.min-1 Bienert et al. 2012 [49] Rabbit Bolus + infusion (10 min)
Two-compartment model: V1= 7.67+3.25x(weight-3.5)L;
K10= 0.196 for 10h; 0.260 for 16h and 0.227 for 22h (min-1);
k12= 0.328 min-1; k21= 0.0191 min-1; Vdss=
139+59x(weight-3.5)L; CLB= 1.5+0.637x(weight-3.5) for 10h; 1.99+0.845x (weight-3.5) for 16h; 1.74+0.738x(weight-3.5) L.min-1 for 22h;
CL2= 2.52+1.07x(weight-3.5).
V1 – volume of central compartment; V2 - volume of the rapid peripheral compartment; V3 - volume of
the slow peripheral compartment; k - constant between compartments; Vdss - apparent volume of
distribution at steady-state; CLB - the total body clearance; CL1 - metabolic clearance; CL2 - rapid
peripheral compartment clearance. CL3 - slow peripheral compartment clearance; SBV - shed-blood
volume; LBM - Lean body mass (1.1xweight-128x(weight/height)2 for males and
1.07xweight-148x(weight/height)2 for females).
1.4 Pharmacodynamics of propofol
Due to its rapid onset and short duration of action, fast recovery and easy control of the anesthetic depth and clinical effects, propofol provides a good suppression of laryngeal reflexes and prevents post-operative anesthetic nausea (PONV) [92].
Pharmacodynamic properties of propofol depend on its therapeutic plasma concentrations and the knowledge about its pharmacokinetics allows a more accurate prediction of the optimal dosage for each species [4]. The required plasma concentration varies with the desired pharmacological effect (sedation, induction or maintenance of anesthesia), the simultaneous use of other drugs (opioids, muscle relaxants), the type of surgery and the patient’s sensitivity to the drug (age, weight and pre-existing conditions such as anemia or other diseases) [4]. Propofol is extensively metabolized, thus requires a reduction on its dosage when there is evidence of severe hepatic dysfunction, heart or renal failure since these diseases can alter the pharmacokinetic variables and lead to propofol overdose [93]. So, the
11 use of propofol demands a continuous titration of the drug infusion to obtain a desired pharmacological end-point.
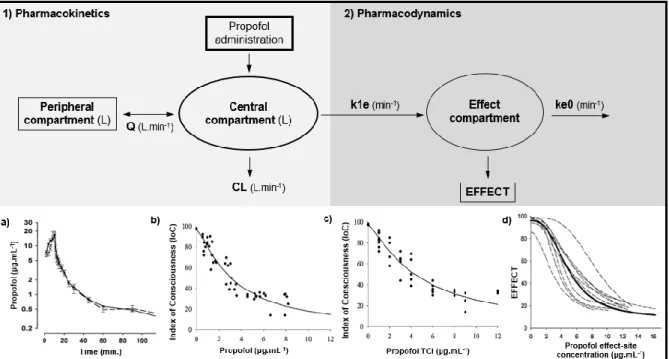
The time necessary to reach the peak concentration in the plasma and in the brain is named hysteresis. Each time a higher dose of propofol is used, propofol concentrations increase in blood and a certain time is needed before plasma and effect-site concentrations of propofol to reach an equilibrium [94]. The constant k1e represents the rate constant of the drug’s passage from the central compartment to the effect-site and the dissipation of the drug from the effect compartment is characterized by ke0 (Figure 1.2 - B). This last constant indicates the equilibrium rate of conversion of propofol plasma into effect-site concentration, turning possible the estimation of the drug concentration in the effect compartment [95] which is very useful in anesthesia using TCI devices, as it provides a more precise information of the drug effect than the estimated plasma concentration (Figure 1.2 – b), c) and d)) [96, 97]. Drug delivery systems, based on pharmacokinetic and pharmacodynamic properties of propofol, were developed, especially for humans, allowing a reasonable real-time estimation of its plasma concentrations, during the anesthetic period [4, 43].
Figure 1.2 – Schematic illustration of propofol pharmacokinetics (1)) and pharmacodynamics (2))
described by a representative two-compartment model (1)) with the additional effect-site compartment (2)). Typical propofol plasma concentration versus time curve (a)), Index of Consciousness (to monitor the depth of anesthesia) versus measured propofol concentration (b)) or TCI estimated propofol concentration curves (c)) and effect versus propofol effect-site concentration curve (d)) are also showed
(CL – clearance; Q – intercompertmental clearance; ke0 – elimination constant of propofol from the
effect compartment; k1e - constant of the drug’s passage from the central compartment to the
effect-site). Adapted from Anderson, 2013 [38]; Bouillon et al. 2004 [97], Johnson et al. 2004 [39] and Vanluchene et al. 2004 [98].
12
1.5 Adverse effects of propofol
Although propofol continuous infusion may provide less hemodynamic depression than bolus injection, the main undesired pharmacodynamic characteristics are related with its cardiovascular effects. These may include transitory decrease in arterial blood pressure (due to a decrease in peripheral vascular resistance) [99, 100], decreased sympathetic outflow or myocardial depression, that are likely to occur at higher blood concentrations [101]. As a consequence, a decrease in heart rate is more commonly observed than the expected reflex tachycardia, and results from the progressive inhibition of the sensitivity of the baroreflex by the anesthetic agent [102]. Another dose-related effect of propofol is respiratory depression commonly followed by apnea after induction or during prolonged periods of infusion, demanding mechanical ventilation with oxygen support also to avoid hypercapnia and hypoxemia [103-105]. Central respiratory neuronal network suppression has been demonstrated as the mechanism underling respiratory depression [106]. Propofol also exert cerebral vascular and metabolic effects similar to those of barbiturates, decreasing cerebral blood flow and reducing cerebral metabolic rate dose-dependently [107]. Animal and human studies also strongly indicate that propofol possesses antiepileptic properties, suppressing seizure activity [108], and protection against ischemic injury, being the ideal anesthetic for neurosurgery [109]. Other side effects of propofol administrations are related to Propofol Infusion Syndrome (PRIS). However, this condition will be explained in detail in Section 4 of this Introduction.
Recovery from anesthesia is dictated by the pharmacokinetic variables that rule the drug redistribution and elimination’s rates from the effect compartment (brain), once the drug administration is stopped, and by the duration of the drug administration [110, 111]. A short recovery period has been reported in several animal species specially when short-time infusions are used [112].
2. Total Intravenous Anesthesia (TIVA) and Target-Controlled Infusion (TCI)
In the 20th century, the introduction of propofol and other IV agents in human anesthesia
quickly initiated a paradigm shift. Inhalator anesthesia started to be substituted by these new agents, implementing a new method for the delivery of general anesthesia: “TIVA” (Total Intravenous Anesthesia) [113]. Commonly combined with intravenous opioids, propofol with TIVA provides sedation and/ or general anesthesia and analgesia, without using any kind of volatile agents. This is very useful in cases where anesthetic gases need to be avoided, such as in patients with a history of malignant hyperthermia. Furthermore, according to international treaties, it is expected that the emission of volatile agents like isoflurane and enflurane into the