Feeling the heat: Elevated temperature affects
male display activity of a lekking grassland
bird
Mishal GudkaID1¤*, Carlos David Santos2,3, Paul M. Dolman4, Jose´ Mª Abad-Go´ mez5,6, João Paulo Silva7,8
1 School of Biological Sciences, University of East Anglia, Norwich, United Kingdom, 2 Nu´cleo de Teoria e Pesquisa do Comportamento, Universidade Federal do Para´, Bele´m, Brazil, 3 Department of Migration, Max Planck Institute for Animal Behavior, Radolfzell, Germany, 4 School of Environmental Sciences, University of East Anglia, Norwich, United Kingdom, 5 Conservation Biology Research Group, Department of Anatomy, Cell Biology and Zoology, Faculty of Sciences, University of Extremadura, Badajoz, Spain, 6 Servicio de Conservacio´n de la Naturaleza y A´ reas Protegidas, Consejerı´a de Medio Ambiente y Rural, Polı´ticas Agrarias y Territorio, Junta de Extremadura, Me´rida, Badajoz, Spain, 7 CIBIO/InBio, Centro de Investigac¸ão em Biodiversidade e Recursos Gene´ ticos, Laborato´rio Associado, Universidade do Porto, Campus Agra´rio de Vairão, Vairão, Portugal, 8 CIBIO/InBio, Centro de Investigac¸ão em Biodiversidade e Recursos Gene´ticos, Laborato´ rio Associado, Instituto Superior de Agronomia, Universidade de Lisboa, Tapada da Ajuda, Lisbon, Portugal
¤ Current address: Coastal Oceans Research and Development–Indian Ocean (CORDIO) East Africa, Mombasa, Kenya
*mishal.gudka08@gmail.com
Abstract
Most species-climate models relate range margins to long-term mean climate but lack mechanistic understanding of the ecological or demographic processes underlying the cli-mate response. We examined the case of a climatically limited edge-of-range population of a medium-sized grassland bird, for which climate responses may involve a behavioural trade-off between temperature stress and reproduction. We hypothesised that temperature will be a limiting factor for the conspicuous, male snort-call display behaviour, and high tem-peratures would reduce the display activity of male birds.
Using remote tracking technology with tri-axial accelerometers we classified and studied the display behaviour of 17 free-ranging male little bustards, Tetrax tetrax, at 5 sites in the Iberian Peninsula. Display behaviour was related to temperature using two classes of Gen-eralized Additive Mixed Models (GAMMs) at different temporal resolutions. GAMMs showed that temperature, time of the day and Julian date explained variation in display behaviour within the day, with birds snort-calling significantly less during higher temperatures. We also showed that variation in daily snort-call activity was related to average daytime tempera-tures, with our model predicting an average decrease in daytime snort-call display activity of up to 10.4% for the temperature increases projected by 2100 in this region due to global warming. For lekking birds and mammals undertaking energetically-costly displays in a warming climate, reduced display behaviour could impact inter- and intra-sex mating behav-iour interactions through sexual selection and mate choice mechanisms, with possible con-sequences on mating and reproductive success. The study provides a reproducible example for how accelerometer data can be used to answer research questions with
a1111111111 a1111111111 a1111111111 a1111111111 a1111111111 OPEN ACCESS
Citation: Gudka M, Santos CD, Dolman PM, Abad-Go´mez JM, Silva JP (2019) Feeling the heat: Elevated temperature affects male display activity of a lekking grassland bird. PLoS ONE 14(9): e0221999.https://doi.org/10.1371/journal. pone.0221999
Editor: Stefano Grignolio, University of Sassari, ITALY
Received: October 14, 2018 Accepted: August 20, 2019 Published: September 16, 2019
Copyright:© 2019 Gudka et al. This is an open access article distributed under the terms of the
Creative Commons Attribution License, which permits unrestricted use, distribution, and reproduction in any medium, provided the original author and source are credited.
Data Availability Statement: Acceleration and processed behaviour data used in this study are available from the Movebank repository (https:// doi.org/10.5441/001/1.6df055p6).
Funding: Financial support was provided by InBIO (UID/BIA/50027/2013 and POCI-01-0145-FEDER-006821) and FCT/MCTES through national funds. JP Silva was funded under contract DL57/2016 (Foundation for Science and Technology). The funders had no role in study design, data collection
important conservation inferences related to the impacts of climate change on a range of taxonomic groups.
Introduction
Climate change is a major and increasing global threat to biodiversity [1,2], therefore a better understanding of species responses to climate change is important to inform and prepare pol-icy makers and conservationists [3–5]. However, most climate-species models relate range margins to long-term mean climate variables on assumed equilibrium, and do not adequately capture responses to increasing climatic extremes and stochasticity [6,7]. More fundamentally, such models lack a mechanistic understanding of the ecological, behavioural and demographic processes that currently limit range distributions and how these processes may respond to future climates. This limits their ability to predict future range suitability and responses [8]. Here we examine how global warming responses may involve a behavioural trade-off between avoiding temperature stress and carrying out breeding displays, for a climatically limited, edge-of-range population of a medium-sized grassland bird.
For some ectotherms such as reptiles and amphibians, the impacts of elevated temperatures on species’ behaviour patterns are well evidenced, and local population expiration can occur when temperature increases restrict key activities to a limited daily interlude [3]. In contrast for endotherms, understanding of how physiological and behavioural mechanisms contribute to climate range limits is largely lacking. For endotherms, higher temperatures can affect indi-viduals physiologically, leading to higher metabolic rates and possible overheating [9]. Indeed, mass deaths of bats and birds related to heat waves have been reported [10]. A common response to mitigate impacts of temperature is behavioural thermoregulation [11], where ani-mals remain mostly inactive in sheltered locations [12]. This response has been found, for example, in subterranean rodents which reduce above-ground activity [13] and baboons (Papio hamadryasursinus) which reduce feeding activity and increase grooming and resting
behaviour [14]. This reduced activity, if prolonged, may impact individual fitness and thus wider population dynamics [15]. Understanding the potential impacts of climate warming on endotherms will help biologists to identify the most threatened species, better forecast their future distributions [16–19], better understand the mechanistic stressors, and subsequently respond more effectively to conserve them [4]. Species restricted to open grassland, semi-arid and desert habitats may be particularly vulnerable to global warming, as they are highly exposed to insolation, with limited ability to perform behavioural thermoregulation due to the open nature of the landscape that they depend on.
In species showing extravagant sexual display, such as lekking breeding systems, where one sex (usually the males) display in clustered territories that are visited by the opposite sex for the sole purpose of breeding [20], reduced breeding activity caused by high temperatures may have both inter- and intra-sex implications [21,22]. In many lekking ungulates (including Red deerCervus elaphus, Fallow deer Dama dama, Blackbuck Antilope cervicapra and Uganda kob Kobus kob), males undertake energetically costly display behaviours, such as powerful
vocalisa-tion (bellowing, snorting), displays of physical strength and fighting, that increase their chance of obtaining copulations [23–26]. In African houbara,Chlamydotis undulata, male display
activity reliably indicates health status and ejaculation quantity and quality of males, allowing females to optimize fertilization success and the genetic quality of offspring [27–29]. Female houbara were also shown to adjust maternal allocation according to the observed male display
and analysis, decision to publish, or preparation of the manuscript.
Competing interests: The authors have declared that no competing interests exist.
rate, with consequences for hatching and fertilization success and chick growth and survival [21].
The little bustard,Tetrax tetrax, is a lekking grassland bird that has been shown to reduce
its overall activity at high temperatures in SW Iberia [30]. This area has some of the highest temperatures in Europe, and is also expected to be particularly affected by global warming and severe drought episodes by the end of the twenty-first century [31]. Males use energetically-costly ‘snort-calling’ to signal their presence (and potentially their quality) to females [22], and as an intra-sexual display addressed to competing breeding males [27,32].
The use of modern, affordable technology such as GPS loggers and accelerometers, is now allowing for novel methods to remotely collect accurate, high-resolution animal movement and positional data to provide increased insights into species behaviours and climate-related movement [33]. We investigated how elevated temperatures affected snort-calling of little bus-tard males, by remotely tracking seventeen free-ranging male birds during the mating season and classifying individual behaviour from fine-scale movement data collected using tri-axial accelerometers. The frequency of ‘snort-call’ display activity classified from these acceleration sequences were related to ambient temperature. We hypothesised that temperature would be a limiting factor for display behaviour, and that high temperatures would reduce the display activity of male birds.
Materials and methods
Study species and study site
The global breeding range of the little bustard (IUCN Near-Threatened) is confined to the Palearctic region including west and southern Europe, central Asia and north Africa [34]. Originally a steppe bird, it is presently well-adapted to extensive agriculture and pastures [35]. Its climatic niche in southern Europe seems to be more restricted than other bustard species, such as the great bustard (Otis tarda), avoiding areas with greater temperature extremes [36]. Within Europe the species is classified as ‘Vulnerable’ because of recent sharp population declines [34] mainly due to agricultural intensification and loss of preferred extensively-man-aged, heterogeneous farmland [37,38]. The little bustard’s western European stronghold is found in the Iberian Peninsula [39].
Our study was conducted in two regions of south-western Iberia: Alentejo (Portugal) and Extremadura (Spain) that have a thermo- and meso-Mediterranean climate [40] with warm, dry summers and cold, humid winters [41]. The average daily daytime (5:00–21:00 hours) tem-peratures in our study region varied between 10ºC and 31ºC during our study period of April and May 2014 and 2015. The little bustard’s mating season in south-western Iberia usually starts in the beginning of April and extends until mid/late May [42], with female brood-rearing continuing until the end of June. Males have a conspicuous and likely energetically costly dis-play ritual that is used to defend their territories or ‘disdis-play centres’ from other opportunistic males [43] and make them more visible to females. It is mainly characterised by standing rela-tively upright, puffing up their necks, and uttering a snort-call (Fig 1) and is by far the most common behaviour related to breeding display [27,44].
Data collection
In April and May 2014 and 2015, 17 wild adult breeding males (13 birds at 3 sites in Alentejo, Eastern Portugal and 4 birds at 2 sites in Extremadura, Western Spain.Fig 2) were captured using snares at their breeding grounds and fitted with solar-powered GPS-GSM-accelerometer tracking devices (Movetech Telemetry, UK,www.movetech-telemetry.com). To reduce the risk of increased energy expenditure and alterations to movement patterns, the loggers
weighed less than 3.2% of the mass of the bird (approximately 24 g) [45–48] and were aerody-namically designed without a protruding antenna to minimise drag [49]. Birds were tagged using a full (‘back-pack’) harness made from 6mm wide Teflon ribbon, with adjustable straps so that loggers could be positioned between the wings on the back, at the centre of mass of the bird, to minimise effects on flight patterns [50]. The harness was stitched at one point under the sternum and designed to release within a year. The device and straps were coloured to blend with the brown feathers on the bird’s back. Bird trapping and GPS tagging were approved by the Instituto da Conservac¸ão da Natureza e Florestas (Portuguese authority) through licenses to João Paulo Silva (ICNF/CAPT/2014, ICNF/CAPT/2015) and Consejerı´a de Medio Ambiente y Rural, Polı´ticas Agrarias y Territorio of the Junta de Extremadura (Spanish authority) through the license to Jose´ Mª Abad-Go´mez.
Fig 1. Male little bustard performing its characteristic snort-call display. https://doi.org/10.1371/journal.pone.0221999.g001
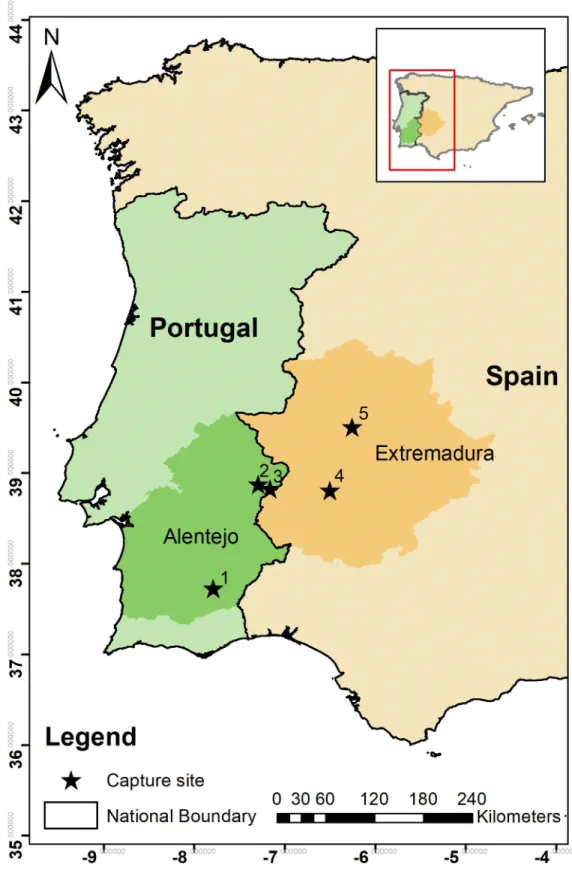
Fig 2. Location of the five study sites where 17 male little bustards were captured, tagged and tracked in the regions of Alentejo and Extremadura (darker shade) in Portugal (green) and Spain (orange) respectively, during the display seasons (April and May) of 2014 and 2015. 1- SPA Castro Verde; 2 –SPA Vila Fernando; 3 –SPA Torre da Bolsa; 4 –Arroyo de San Servan; 5 –SPA Llanos de Ca´ceres (SPA–Special Protection Area).
The onset of the display and hence capturing season was determined from field observa-tions, noting when males first started exhibiting full display behaviour [27,42]. Capturing was generally attempted during the two periods of greatest bird activity; just after dawn and a few hours before dusk. Tracking devices were fitted in less than 20 minutes to reduce the chances of the birds suffering from potentially fatal capture myopathy [51].
Tracking devices contain a tri-axial accelerometer which measures acceleration along the sway, surge and heave axes in ten-second data bursts of 1 Hz (collected every 10 or 20 minutes depending on program settings) and remotely transmit these data (hereafter ‘acceleration sequences’) via GSM (Global System for Mobile communication). Accelerometers could read up to±6G, which proved more than enough to characterize behaviours, as readings only rarely got close to 3G during flight events. Ambient temperature was measured every hour, using a temperature datalogger placed near the ground at each successful capture site. For 2 birds (out of 17) we obtained data from meteorological stations located within 10 km of the capturing site, as temperature loggers were not successfully retrieved from these sites.
Classifying behaviour from accelerometer data
Thirteen accelerometer sequences were validated in May 2015 using concurrent video footage of two tagged birds snort-calling in their natural circumstances [52,53]. Validating accelerom-eter sequences directly from wild animals is considered the most accurate method for calibra-tion [54], and is relatively uncommon, as many studies instead use captive animals or surrogate species [55]. The 13 accelerometer sequences were characterised by mean (± sd) heave values of 0.60g± 0.10, mean sway values of -0.03g ± 0.03, and mean surge values of 0.81g± 0.09 (S2 Fig). Although similar accelerometer readings e.g. high values of heave, may also be observed when the bird becomes alert and upright due to disturbance, we assumed that during the mating season, the time spent alert due to disturbance would be minimal compared with the time spent in display. This is supported by field observations of the birds across sev-eral display seasons (Silva, pers observation) and because breeding behaviour is density-depen-dent [22], the rate of snort call is expected to be greater at our high-density sites compared to the 3.8 calls per minute observed in lower-density sites in France [27].
Using these predetermined criteria, 1356 randomly selected accelerometer sequences (10% of the total) were manually classified as either display behaviour or not, based on the predomi-nant behaviour within the first 7 seconds. Using the software ‘AcceleRater’, these training data were used to compute a range of summary statistics (Mean, Standard deviation, Skewness, Kurtosis, max, min, the vector norm of the measurement, covariance between two axis, Pear-son correlation between two axis, dynamic body acceleration, the average difference between two axis, 25%, 50%, 75% percentiles etc.) to build multiple classification models [56,57]. ‘AcceleRater’ runs seven types of classification models with different characteristics: Artificial Neural Network; Decision Tree; Linear Support Vector Machine; Linear/Quadratic Discrimi-nant Analysis; Nearest Neighbours; Radial Basis Function kernel Support Vector Machine and Random Forest. Performance of the resulting models were assessed by their ability to classify an independent validation training set using a k-fold cross-validation method applied across the set of 1356 manually classified sequences. The training dataset was randomly split into k equal-size parts, k-1 parts are used for training and 1 for validation. The procedure was repeated k-times until all parts have been used for validation. We found that a value of 10 for k produced the highest accuracy. The best performing model, the Random Forest model, was then used to automatically classify the remaining 90% of data (S1 Fig).
Modelling snort-call display behaviour
Accelerometer data were analysed for the period commencing two days after the loggers were fitted on the bird (to ensure normal behaviour was resumed) and ending when males left their territories for the first migratory movements (using GPS data collected by the dataloggers). Data collected between 21:00 hours and 5:00 hours were excluded from analyses, as birds dis-play minimally at night [30]. Display behaviour was related to temperature in two classes of model at different temporal resolutions, (1) within days, using hourly measurements and (2) between days, using daily averages (seeS1 Tablefor variable details). We used Generalized Additive Mixed Models (GAMMs) as we expected complex non-linear responses of display [30] and included random effects to control for non-independence of repeated measures. The first model related snort-call display behaviour occurrence (0/1) for each accelerometer sequence to fixed smooth effects of temperature (mean for the hour behaviour was recorded), time (continuous) and Julian date (a sequential count of the number of days since the start of the year), using binomial error structure, also incorporating the random effect of bird identity. Correlations between predictors were checked prior to analysis to prevent multi-collinearity (temperature vs time: r = 0.51; temperature vs Julian date: r = 0.16; time vs Julian date: r = 0.01). Smooth functions in GAMMs remove the autocorrelation structure from the data, leaving residuals that are independent [58].
For the second model, we omitted any day that a bird did not provide at least two acceler-ometer readings per hour for a minimum of 11 of the 16 daylight hours (6144 acceleracceler-ometer sequences remaining). This was to ensure that data were representative and consistent across the day i.e. enough samples from different parts of the day, to provide a representative daily average. From this filtered dataset, for each bird we calculated daily (5:00–21:00 hours) (a) mean daytime temperature using all temperature data obtained at the site and (b) proportion of display sequences (hereafter ‘display activity’), averaged from hourly proportions to reduce any bias on the daily average due to unequal number of accelerometer samples recorded across different times of the day. The GAMM related display activity to the fixed effects of mean day-time temperature and Julian date (103 data points), with normal error distribution, incorpo-rating the random effect of bird identity. Multi-collinearity was low with the correlation between mean daytime temperature and Julian date only 0.3. GAMMs were fitted in R (R, 2013) using the function gamm4 of the package gamm4 [59], with the smoother parameter k set to 4 to avoid overfitting [60,61]. Predictive error of both GAMMs was estimated through a 10-fold cross-validation, with the original data randomly split into 10 equal-size parts, 9 parts used to train a new model and 1 to validate the model predictions. This procedure is repeated ten times in a way that training and testing subsets of each run were complementary [62]. For the first model, predictive error was the average of error rates produced for each sub-model of the cross-validation process, with error rate defined as the percentage of misclassifications pro-duced by binomial models. For the second model, predictive error was the average of Normal-ized Root Mean Square Error, defined as the root mean square error divided by the range of the model response variable.
Results
The 17 male little bustards were tracked for a mean of 12.8 days (sd:± 7.2, range: 2–25 days) during their display season, providing 8308 daylight acceleration sequences (5:00 to 21:00 hours), of which 41.5% were classified as snort-call display behaviour (seemethodsfor the clas-sification details). The best combination of precision (probability that an assigned behaviour is correctly classified) and recall (probability that a sample with a particular behaviour will be
correctly classified) for classifying snort-calls was obtained using the Random Forest model with k = 10 cross-validation (0.92 and over 0.97 respectively) (S1 Fig).
The snort-call display probability was significantly related to temperature, Julian date and time of day (Table 1,Fig 3). Snort-call display probability decreased substantially as tempera-ture increased from 4 to 20º C, stabilized from 20 to 30º C, and decreased thereafter (Fig 3). Birds snorted more in the early morning; the display probability declined from 5:00 to 10:00 hours after which it was relatively constant (Fig 3). Display probability increases from day 107 and peaks at day 124, and as the display season continues past this, display probability decreases steadily (Fig 3).
The daily snort-call display activity (proportion of display events in each day) was related to daily mean daytime temperature and Julian date (Table 1). Display activity decreased with increasing mean daytime temperature (Fig 4) as well as increased to a maximum in the middle of the display season before declining (S3 Fig).
Discussion
This work provides a reproducible method for predicting how future elevated temperatures may affect a specific aspect of the mating behaviour of a bird species using accelerometer data from advanced remote tracking technology.
Table 1. Summary of GAMMs relating (a) the probability of male little bustard snort-call display behaviour to smoothed fixed effects of hour of the day (time, 5:00–21:00 hours), mean hourly temperature and Julian date; (b) proportion of snort-call display behaviour each day, to smoothed fixed effect of daily average day-time temperature (5:00–21:00 hours) and Julian date. Both models incorporate random effect of bird identity. 17 little bustards were tagged with accelerometers during the display seasons (April and May) of 2014 and 2015 at five sites in Extremadura (Western Spain) and Alentejo (Eastern Portugal). In model (a) predictive error is repre-sented by the average± standard deviation of the error rates of 10 cross-validation models, while in model (b) we used the average ± standard deviation of the Normalized Root Mean Square Errors. edf denotes estimated degrees of freedom. In both models, display behaviour was classified from seven-second accelerometer sequences.
Parameter edf χ2 F P Predictive error
(a) Snort-call display probability 37.7± 1.5
s(Hourly temperature) 2.9 60.4 <0.001
s(Hour of the day) 2.7 20.0 <0.001
s(Julian date) 2.6 51.4 <0.001
(b) Daily proportion of snort-call display 31.4± 5.4
s(Daily mean temperature) 1.6 5.0 0.04
s(Julian date) 2.0 4.7 0.02
https://doi.org/10.1371/journal.pone.0221999.t001
Fig 3. GAMM partial effects of (left) temperature (centre) time of day (5:00–21:00 hours) and (right) Julian date on the probability of snort-call display. The GAMM used 8308 7-second accelerometer sequences from 17 male little bustards sampled during the display seasons (April and May) of 2014 and 2015 in SW Iberia. The model incorporates bird identity as a random factor. Dashed lines represent 95% confidence intervals.
The variation of snort-call occurrence of male little bustards during daylight hours was par-tially explained by temperature, time in the day, and Julian date. Variation in overall levels of
Fig 4. GAMM showing the partial effect of average daytime temperature (5:00–21:00 hours) on display activity (proportion of display events in each day) of 17 male little bustards tagged at five sites in Extremadura (Western Spain) and Alentejo (Eastern Portugal) in SW Iberia. The model incorporates average daytime temperature and Julian date as fixed effects and bird identity as random effect. The blue dashed line indicates the mean daytime temperature across the display season of little bustards in SW Iberia over the last five years (2014–2018) (grey shaded area represents the range of the mean temperatures each year) and red dashed lines indicate the increase in mean daytime temperature based on the 5-year display season average and the best (1˚C) and worst (7˚C) case IPCC scenarios of temperature increase by the end of the century for Southern Europe/Mediterranean region. Dashed black lines represent 95% confidence intervals.
daily snort-call activity was also related to average daytime temperatures, which is important given that future scenarios of global warming predict daily mean, rather than hourly, tempera-tures. Over the last five years (2014–2018), the overall mean daytime temperature across the display season of little bustards in SW Iberia was 18˚C (range 16–20.0˚C, measurements from a weather station at 38.3284˚N, 8.0066˚W). Based on this 5-year average and IPCC scenarios which project temperature increases of between 1˚C and 7˚C (depending on the scenario and the season) by the end of the century for the Southern Europe/Mediterranean region [63], we can assume that average temperatures across the display season may increase to between 19˚C and 25˚C by 2100. Our model predicts a decrease in average snort-calling activity between 0.9 and 10.4% for temperature changes of this magnitude. Climate change models [31] for the Mediterranean Basin also forecast (with a high level of certainty) a significant increase of heat wave events, which have already pushed maximum temperatures over 40˚C during mid-May in recent years. These extreme events may already be curtailing the length of the mating period (Silva, unpublished data) and are therefore likely to compound and exaggerate the decreases in display activity further. Moraleset al. (2014), also showed that birds have lower snort call rates
in poorer habitats, and with the likely decline in habitat quality in the future, we can expect even greater impacts on snort-calls levels.
In mammals and birds, energetically costly displays, calls and other male-male breeding interactions like fights, clashes and chases, play important roles in hierarchy establishment and female monopolization [64,65]. Reductions in such behaviours could potentially lead to less defined hierarchies, thereby allowing floaters (lower ranking, untested sub-adults or less-fit adult males that do not hold territories) more frequent access to females. This could lead to reduced mating success as floaters tend to harass and chase females [22]. In addition, other important display behaviours for male little bustard such as wing flashing and jumping, which are performed more by territorial males [64], are also likely to decrease as they are correlated with snort-calling. These factors, combined with the reduced active daily time of the lek, could result in females being less able to select territorial males with preferred genetic traits, with likely implications on female reproductive success and offspring health and hence population viability of this species [21]. However, the opposite is also possible, if higher temperatures filter out weaker males, allowing fitter and more resilient males with more resistance to the heat greater mating opportunities.
For little bustards, these potential consequences of reduced display combined with other existing threats and additional future climate change related impacts e.g. reduced fitness due to greater thermoregulatory-related energetic losses, may push this endangered species towards local and regional extirpation. Additionally, the link between display effort and mat-ing success has been demonstrated in several lekkmat-ing birds and mammals, includmat-ing great bus-tard [66–68] and several ungulates [24,25], suggesting that a wide range of lekking species may be vulnerable to any disturbance of their natural display behaviour, especially those exposed to higher temperatures. These impacts are going to be compounded by the likely future restric-tions in breeding range of these species in Iberia, and the fact that grassland species have lim-ited ability within unsheltered habitats, to buffer elevated temperatures with behaviour thermoregulation [69].
This work has shown how global warming may affect important behavioural mechanisms using the mating system of a lekking grassland bird species as an example. Behavioural response to elevated temperatures may affect energetically-costly breeding behaviours in a range of mammals and birds [70], highlighting the need for further work to understand the underlying mechanisms of such climate-species dynamics as well as accurately gauge the implications these changes may have at a population level. The study has also provided a reproducible example on how accelerometer data paired with a rigorous method for classifying
behaviours and an appropriate statistical analysis, can be used to answer specific research ques-tions with important conservation inferences for various taxonomic groups.
Supporting information
S1 Fig. Relative effectiveness of classification of male little bustard display behaviour by the various AcceleRater models. The precision is the probability that an assigned behaviour is correctly classified, and the recall is the probability that a sample with a particular behaviour will be correctly classified.
(PNG)
S2 Fig. Mean acceleration (ms-2) of 13 video classified display sequences for each of the seven seconds. Error bars represent standard deviation.
(TIFF)
S3 Fig. GAMM showing the partial effect of Julian date on display activity (proportion of display events in each day) of 17 male little bustards tagged at five sites in Extremadura (Western Spain) and Alentejo (Eastern Portugal) in SW Iberia. The model incorporates average daytime temperature and Julian date as fixed effects and bird identity as random effect. Dashed black lines represent 95% confidence intervals.
(TIFF)
S1 Table. Dependent and predictor variables included in Generalised Additive Mixed Models to explain male little bustard display behaviour.
(DOCX)
Acknowledgments
We would like to thank Teresa Marques and Pauline Diaz for their assistance during the data collection, Alex Hurley for his assistance with data processing, James Mbugua for producing the map and Luı´s Venaˆncio for providing the image of the little bustard displaying.
Author Contributions
Conceptualization: João Paulo Silva.
Data curation: Mishal Gudka, Jose´ Mª Abad-Go´mez, João Paulo Silva. Formal analysis: Mishal Gudka, Carlos David Santos, Paul M. Dolman. Funding acquisition: João Paulo Silva.
Investigation: Mishal Gudka, Jose´ Mª Abad-Go´mez, João Paulo Silva. Methodology: João Paulo Silva.
Project administration: João Paulo Silva. Supervision: João Paulo Silva.
Writing – original draft: Mishal Gudka, Carlos David Santos, Paul M. Dolman, João Paulo
Silva.
Writing – review & editing: Mishal Gudka, Carlos David Santos, Paul M. Dolman, Jose´ Mª Abad-Go´mez, João Paulo Silva.
References
1. Dawson TP, Jackson ST, House JI, Prentice IC, Mace GM. Beyond Predictions: Biodiversity Conserva-tion in a Changing Climate. Science. 2011; 332: 53–58https://doi.org/10.1126/science.1200303PMID:
21454781
2. Urban MC. Accelerating extinction risk from climate change. Science. 2015; 348: 571–573.https://doi. org/10.1126/science.aaa4984PMID:25931559
3. Cahill AE, Aiello-Lammens ME, Fisher-Reid MC, Hua X, Karanewsky CJ, Yeong Ryu H, et al. How does climate change cause extinction? Proc R Soc—Biol Sci. 2012;280.https://doi.org/10.1098/rspb. 2012.1890PMID:23075836
4. Huey RB, Kearney MR, Krockenberger A, Holtum JAM, Jess M, Williams SE. Predicting organismal vul-nerability to climate warming: roles of behaviour, physiology and adaptation. Philos Trans R Soc B. 2012; 367: 1665–79 doi: 10.1098/rstb.2012.0005.https://doi.org/10.1098/rstb.2012.0005PMID:
22566674
5. Buckley LB Huey RB. Temperature extremes: geographic patterns, recent changes, and implications for organismal vulnerabilities. Glob Change Biol. 2016; 22: 3829–3842.
6. Pearson RG, Dawson TP. Predicting the impacts of climate change on the distribution of species: are bioclimate envelope models useful? Glob Ecol Biogeogr. 2003; 12: 361–371.https://doi.org/10.1046/j. 1466-822X.2003.00042.x
7. Arau´jo MB, Pearson RG, Thuiller W, Erhard M. Validation of species–climate impact models under cli-mate change. Glob Change Biol. 2005; 11: 1504–1513.https://doi.org/10.1111/j.1365-2486.2005. 01000.x
8. Mustin K, Sutherland WJ, Gill JA. The complexity of predicting climate-induced ecological impacts. Clim Res. 2007; 35: 165–175.
9. Dillon ME, Wang G, Huey RB. Global metabolic impacts of recent climate warming. Nature. 2010; 467: 704–706.https://doi.org/10.1038/nature09407PMID:20930843
10. Welbergen JA, Klose SM, Markus N, Eby P. Climate change and the effects of temperature extremes on Australian flying-foxes. Proc Biol Sci. 2008; 275: 419–425.https://doi.org/10.1098/rspb.2007.1385
PMID:18048286
11. Rastogui SC. Essentials of Animal Physiology, 4th edn. New Age Int New Delhi India. 2007; 12. Boyles JG, Seebacher F, Smit B, McKechnie A.E. Adaptive thermoregulation in endotherms may alter
responses to climate change. Integr Comp Biol. 2011; 51: 676–690.https://doi.org/10.1093/icb/icr053
PMID:21690108
13. Rezende EL, Corte´s A, Bacigalupe LD, Nespolo RF, Bozinovic F. Ambient temperature limits above-ground activity of the subterranean rodent Spalacopus cyanus. J Arid Environ. 2003; 55: 63–74.https:// doi.org/10.1016/S0140-1963(02)00259-8
14. Hill RA. Thermal constraints on activity scheduling and habitat choice in baboons. Am J Phys Anthropol. 2006; 129: 242–249.https://doi.org/10.1002/ajpa.20264PMID:16323181
15. Sinervo B, Me´ndez-de-la-Cruz F, Miles DB, Heulin B, Bastiaans E, Cruz MV-S, et al. Erosion of Lizard Diversity by Climate Change and Altered Thermal Niches. Science. 2010; 328: 894–899 doi:10.1126/ science.1184695. PMID:20466932
16. Chown SL, Hoffmann AA, Kristensen TN MJA, Jr., Stenseth NChr, Pertoldi C. Adapting to climate change: a perspective from evolutionary physiology. Clim Res. 2010; 43: 3–15.https://doi.org/10.3354/ cr00879
17. Somero GN. The physiology of climate change: how potentials for acclimatization and genetic adapta-tion will determine ‘winners’ and ‘losers.’ J Exp Biol. 2010; 213: 912–920.https://doi.org/10.1242/jeb. 037473PMID:20190116
18. Woodin SA, Hilbish TJ, Helmuth B, Jones S, Wethey D. Climate change, species distribution models, and physiological performance metrics: predicting when biogeographic models are likely to fail. Ecol Evol. 2013; 3: 3334–3346.https://doi.org/10.1002/ece3.680PMID:24223272
19. Mathewson PD, Moyer-Horner L, Beever EA, Briscoe NJ, Kearney M, Yahn JM, et al. Mechanistic vari-ables can enhance predictive models of endotherm distributions: the American pika under current, past, and future climates. Glob Change Biol. 2016; 23: 1048–1064.
20. Alatalo RV, Ho¨glund J, Lundberg AJ.Sutherland W. Evolution of black grouse leks: female preferences benefit males in larger leks. Behav Ecol. 1992; 3: 53–59.https://doi.org/10.1093/beheco/3.1.53
21. Loyau A, Lacroix F. Watching sexy displays improves hatching success and offspring growth through maternal allocation. Proc R Soc B. 2010; 277: DOI: 10.1098/rspb.2010.0473.https://doi.org/10.1098/ rspb.2010.0473PMID:20538650
22. Morales MB, Casas F, Morena EG de la, Ponjoan A, Calabuig G, Martı´nez-Padilla J, et al. Density dependence and habitat quality modulate the intensity of display territory defence in an exploded lek-king species. Behav Ecol Sociobiol. 2014; 68: 1493–1504.https://doi.org/10.1007/s00265-014-1758-z
23. Apollonio M, Festa-Bianchet M, Mari F. Correlates of copulatory success in a fallow deer lek. Behav Ecol Sociobiol. 1989; 25: 89–97.https://doi.org/10.1007/BF00302925
24. Apollonio M, Festa-Bianchet M, Mari F, Mattioli S, Sarno B. To lek or not to lek: mating strategies of male fallow deer. Behav Ecol. 1992; 3: 25–31.https://doi.org/10.1093/beheco/3.1.25
25. McComb KE. Female choice for high roaring rates in red deer, Cervus elaphus. Anim Behav. 1991; 41: 79–88.https://doi.org/10.1016/S0003-3472(05)80504-4
26. Isvaran Kavita, Jhala Yadavendradev. Variation in Lekking Costs in Blackbuck (Antilope cervicapra): Relationship to Lek-Territory Location and Female Mating Patterns. Behaviour. 2000; 137: 547–563. 27. Jiguet F, Bretagnolle V. Courtship behaviour in a lekking species: individual variations and settlement
tactics in male little bustard. Behav Processes. 2001; 55: 107–118.https://doi.org/10.1016/S0376-6357 (01)00173-5PMID:11470502
28. Charge´ R, Saint Jalme M, Lacroix F, Cadet A, Sorci G. Male health status, signalled by courtship dis-play, reveals ejaculate quality and hatching success in a lekking species. J Anim Ecol. 2010; 79: 843– 850.https://doi.org/10.1111/j.1365-2656.2010.01696.xPMID:20412349
29. Charge´ R, Teplitsky C, Hingrat Y, Saint Jalme M, Lacroix F, Sorci G. Quantitative genetics of sexual dis-play, ejaculate quality and size in a lekking species. J Anim Ecol. 2013; 82: 399–407.https://doi.org/10. 1111/1365-2656.12023PMID:23228188
30. Silva JP, Catry I, Palmeirim JM, Moreira F. Freezing heat: thermally imposed constraints on the daily activity patterns of a free-ranging grassland bird. ECOSPHERE. 2015; 6: 1–13.
31. Christensen JH, Kumar K, Aldrian E, An S-I, Cavalcanti IFA, Castro M de, et al. Climate Phenomena and their Relevance for Future Regional Climate Change. Climate Change 2013: The Physical Science Basis. Contribution of Working Group I to the Fifth Assessment Report of the Intergovernmental Panel on Climate Change; 2013 pp. 1217–1308.
32. Jiguet F, Bretagnolle V. Sexy males and choosy females on exploded leks: correlates of male attractive-ness in the Little Bustard. Behav Processes. 2014; 103: 246–255.https://doi.org/10.1016/j.beproc. 2014.01.008PMID:24440985
33. Hebblewhite M, Haydon DT. Distinguishing technology from biology: a critical review of the use of GPS telemetry data in ecology. Philos Trans R Soc B Biol Sci. 2010; 365: 2303–2312.https://doi.org/10. 1098/rstb.2010.0087PMID:20566506
34. BirdLife I. Species factsheet: Tetrax tetrax. Downloaded fromhttp://www.birdlife.orgon 25/02/2017; 2017.
35. Wolff A, Paul J-P, Martin J-L, Bretagnolle V. The benefits of extensive agriculture to birds: the case of the little bustard. J Appl Ecol. 2001; 38: 963–975.https://doi.org/10.1046/j.1365-2664.2001.00651.x
36. Delgado MP, Traba J, Morales MB. Climate Niche Constraints in Two Coexisting Steppe Birds: The Lit-tle and the Great Bustards. BioOne. 2011; 64: 223–238.
37. Morales MB, Traba J, Carriles E, Delgado MP, Garci-a de la Morena EL. Sexual differences in micro-habitat selection of breeding little bustards Tetrax tetrax: Ecological segregation based on vegetation structure. Acta Oecologica. 2008; 34: 345.https://doi.org/10.1016/j.actao.2008.06.009
38. Ribeiro PF, Santos JL, Bugalho MN, Santana J, Reino L, Beja P, et al. Modelling farming system dynamics in High Nature Value Farmland under policy change. Agr Ecosyst Env. 2014; 183: 138–144.
https://doi.org/10.1016/j.agee.2013.11.002
39. Iñigo A, Barov B. Action plan for the little bustard Tetrax tetrax in the European Union. SEO|BirdLife and BirdLife International for the European Commission; 2010.
40. Rivas-Martı´nez S. Climatic Data of Portugal. CIF–Phytosociological Research Center, Madrid.; 2001. 41. Blondel J. The Mediterranean region: biological diversity through time and spaces [Internet]. Oxford
University Press; 2010. Available:http://library.wur.nl/WebQuery/clc/1929515
42. Silva J, Estanque B, Moreira F, Palmeirim J. Population density and use of grasslands by female Little Bustards during lek attendance, nesting and brood-rearing. J Ornithol Jan2014. 2014; 155: 53.https:// doi.org/10.1007/s10336-013-0986-8
43. Silva JP, Moreira F, Palmeirim JM. Spatial and temporal dynamics of lekking behaviour revealed by high-resolution GPS tracking. Anim Behav. 2017; 129: 197–204.https://doi.org/10.1016/j.anbehav. 2017.05.016
44. Schulz H. Grundlagenforschung zur Biologie der Zwergtrappe Tetrax tetrax. 1985.
45. Caccamise DF, Hedin RS. An Aerodynamic Basis for Selecting Transmitter Loads in Birds. Wilson Bull. 1985; 97: 306–318.
46. Wilson RP, Gre´ millet D, Syder J, Kierspel MAM, Garthe S, Weimerskirch H, et al. Remote-sensing sys-tems and seabirds: their use, abuse and potential for measuring marine environmental variables. Mar Ecol Prog Ser. 2002; 241–261.
47. Barron DG, Brawn JD, Weatherhead PJ. Meta-analysis of transmitter effects on avian behaviour and ecology. Methods Ecol Evol. 2010; 1: 180–187.https://doi.org/10.1111/j.2041-210X.2010.00013.x
48. Marcelino J, Moreira F, Mañosa S, Cusco´ F, Morales MB, Morena ELGDL, et al. Tracking data of the Little Bustard Tetrax tetrax in Iberia shows high anthropogenic mortality. Bird Conserv Int. 2018; 28: 509–520.https://doi.org/10.1017/S095927091700051X
49. Pennycuick CJ, Fast PLF, Ballersta¨dt N, Rattenborg N. The effect of an external transmitter on the drag coefficient of a bird’s body, and hence on migration range, and energy reserves after migration. J Ornithol. 2012; 153: 633–644.https://doi.org/10.1007/s10336-011-0781-3
50. Vandenabeele SP, Grundy E, Friswell MI, Grogan A, Votier SC, Wilson RP. Excess Baggage for Birds: Inappropriate Placement of Tags on Gannets Changes Flight Patterns. PLOS ONE. 2014; 9: e92657.
https://doi.org/10.1371/journal.pone.0092657PMID:24671007
51. Ponjoan A, Ponjoan A, Bota G, De La Morena ELG, Morales MB, Wolff A, et al. Adverse Effects of Cap-ture and Handling Little Bustard. J Wildl Manag. 2008; 72: 315.https://doi.org/10.2193/2006-443
52. Nathan R, Spiegel O, Fortmann-Roe S, Harel R, Wikelski M, Getz WM. Using tri-axial acceleration data to identify behavioral modes of free-ranging animals: general concepts and tools illustrated for griffon vultures. J Exp Biol. 2012;215.https://doi.org/10.1242/jeb.058602PMID:22357592
53. Brown DD, Kays R, Wikelski M, Wilson R, Klimley AP. Observing the unwatchable through acceleration logging of animal behavior. Anim Biotelemetry. 2013; 1: 20.https://doi.org/10.1186/2050-3385-1-20
54. Pagano AM, Rode KD, Cutting A, Owen MA, Jensen S, Ware JV, et al. Using tri-axial accelerometers to identify wild polar bear behaviors. Endanger Species Res. 2017; 32: 19–33.
55. Studd EK, Landry-Cuerrier M, Menzies AK, Boutin S, McAdam AG, Lane JE, et al. Behavioral classifica-tion of low frequency acceleraclassifica-tion and temperature data from a free ranging small mammal. Ecol Evol. 2018; 9: 619–630.https://doi.org/10.1002/ece3.4786PMID:30680142
56. Resheff YS, Rotics S, Harel R, Spiegel O, Nathan R. AcceleRater: a web application for supervised learning of behavioral modes from acceleration measurements. Mov Ecol. 2014; 2: 27.https://doi.org/ 10.1186/s40462-014-0027-0PMID:25709835
57. Resheff Y. AcceleRater Software Manual.http://accapp.move-ecol-minerva.huji.ac.il/static/pdf/draft. pdf; 2014.
58. Maindonald J. Smoothing Terms in GAM Models [Internet]. 2010.
59. Wood S, Scheipl F. Generalized Additive Mixed Models using “mgcv” and “lme4” [Internet]. 2017. Avail-able:https://cran.r-project.org/web/packages/gamm4/gamm4.pdf
60. Muñoz-Mas R, Costa RMS, Alcaraz-Herna´ndez JD, Martı´nez-Capel F. Microhabitat competition between Iberian fish species and the endangered Ju´car nase (Parachondrostoma arrigonis; Steindach-ner, 1866). J Ecohydraulics. 2017; 2: 3–15.
61. Granadeiro JP, Andrade J, Palmeirim JM. Modelling the distribution of shorebirds in estuarine areas using generalised additive models. J Sea Res. 2004; 52: 227–240.https://doi.org/10.1016/j.seares. 2004.01.005
62. Geisser S. Predictive Inference [Internet]. Chapman and Hall/CRC; 1993. Available:https://www. crcpress.com/Predictive-Inference/Geisser/p/book/9780412034718
63. IPCC. Fifth Assessment Report, Climate Change 2013: The Physical Science Basis [Internet].http:// www.ipcc.ch/report/ar5/wg1/; 2013. Available:http://www.ipcc.ch/report/ar5/wg1/
64. Ponjoan A, Bota G, Mañosa S. Ranging behaviour of little bustard males, Tetrax tetrax, in the lekking grounds. Behav Processes. 2012; 91: 35–40.https://doi.org/10.1016/j.beproc.2012.05.005PMID:
22626823
65. Isvaran K. Female Grouping Best Predicts Lekking in Blackbuck (Antilope cervicapra). Behav Ecol Sociobiol. 2005; 57: 283–294.
66. Ho¨glund J, Lundberg A. Sexual selection in a monomorphic lek-breeding bird: correlates of male mating success in the great snipe Gallinago media. Behav Ecol Sociobiol. 1987; 21: 211–216.https://doi.org/ 10.1007/BF00292501
67. Morales MB, Alonso J, Martı´n C et al, Ethol J. Male sexual display and attractiveness in the great bus-tard Otis bus-tarda: the role of body condition. J Ethol. 2003; 21: 51–56. https://doi.org/10.1007/s10164-002-0076-5
68. Alonso JC, Magaña M. Correlates of male mating success in great bustard leks: the effects of age, weight, and display effort. Behav Ecol Sociobiol. 2010; 64.https://doi.org/10.1007/s00265-010-0972-6
69. Estrada A, Delgado MP, Arroyo B, Traba J, Morales MB. Forecasting Large-Scale Habitat Suitability of European Bustards under Climate Change: The Role of Environmental and Geographic Variables. PLOS ONE. 2016; 11: e0149810.https://doi.org/10.1371/journal.pone.0149810PMID:26939133
70. Terrien J, Perret M, Aujard F. Behavioral thermoregulation in mammals: a review. Front Biosci Land-mark Ed. 2011; 16: 1428–1444. PMID:21196240