Carlos Pestana Barros & Nicolas Peypoch
A Comparative Analysis of Productivity Change in Italian and Portuguese Airports
WP 006/2007/DE _________________________________________________________
António Afonso
Anatomy of a fiscal débacle: the case of
Portugal*
WP 01 /2013/DE/UECE _________________________________________________________
De pa rtme nt o f Ec o no mic s
W
ORKINGP
APERSISSN Nº 0874-4548
School of Economics and Management
Anatomy of a fiscal débacle: the case of
Portugal
*
António Afonso
#January 2013
Abstract
After entering the EU in 1986, Portugal benefited from low interest rates and some growth momentum. However, the difficulty in taming fiscal imbalances, the pro-cyclicality of fiscal policy, the use of extraordinary fiscal measures, coupled with the 2008-2009 economic and financial crisis led to a fiscal débacle and to an international financial rescue in 2011. We briefly review here those developments.
JEL: E62, E65, H6
Keywords: Portugal, public finances, fiscal imbalances
1. Introduction
After 1985 Portugal faced several important economic and institutional transformations
regarding notably a deeper economic and financial integration in the European Union (EU)
level: joined the EU in 1986, joined the Exchange Rate Mechanism (ERM) of the European
Monetary System (EMS) in 1992, and adhered to the Economic and Monetary Union
(EMU) on January 1999, adopting the euro in 2002.
In terms of public finances developments, the fiscal consolidations that occurred in the
1980s were short-termed and mostly not successful. Indeed, Portugal was the first country
in the EU to breach the Stability and Growth Pact (SGP) in 2002, becoming therefore
subject to the Excessive Deficit Procedure (EDP), a situation that occurred again in 2005
and in 2009.
* I am grateful to useful comments, on previous versions, from Cláudia Braz, Vítor Gaspar, Patrícia Martins,
and Clara Raposo.
# Univ Tecn Lisboa, ISEG, School of Economics and Management, Department of Economics; UECE,
Then, on April 2011, notably in the context of the global economic and financial crisis,
and in the midst of the European sovereign debt crisis, with prohibitively rising long term
yields, Portugal asked for the financial support of the EU and of the International Monetary
Fund (IMF), signing a Memorandum of Economic and Financial Policies (MEFP), adopting
a programme set to last until mid-2014.
This note offers some stylised facts and assessment of the main developments in fiscal
policy in Portugal in the last 30 years, in particular to what extent fiscal behaviour has been
on an unsustainable path. Mostly, the upward path in primary spending, the lack of relevant
cyclically adjusted primary balances, coupled with pro-cyclical fiscal policies, and the wide
use of extraordinary and one-off fiscal measures (for example, sales of non-financial assets
and revenues resulting from the transfers of pensions to the general government), and the
weak growth after the 200s, compounded with the capital markets turmoil, paved the way
to the inability of autonomous sovereign long-term financing.
This not eis organised as follows. Section two reviews developments in public finances.
Section three offers comments on the fiscal débacle. Section four concludes.
2. Stylised developments
After the adoption of the euro, Portugal’s business cycle became more synchronized
with the euro area business cycle, as one would expect. Indeed, business cycle
synchronization increased from 0.265 in the period 1993-1998 to 0.793 in the period
1999-2009. 1 On the other hand, and contrarily to several other more exported oriented economies in the euro area (for instance, Austria, Belgium, Finland, Germany, and Ireland) in Portugal
the share of private consumption in GDP increased from 63.6% in the period 1993-1998 to
65.2% in the period 1999-2009. In addition, and regarding some changing composition in
the components of GDP, per sector, one observed also the diminishing relevance of the
share of the primary sector activities in GDP, following notably some EU incentives in that
direction after the entrance in the EU.
1 Synchronization is measured on the basis of correlation coefficients between the cyclical component of real
2.1. Public finances’ developments
Portugal was one of the countries that gained the most from the decrease in interest
rates, given the high interest rate levels that it incurred in the past. For instance, between
1986 and 2004, the implicit interest rate in the stock of government debt decreased around
9 percentage points (see Figure 1), after have peaked in 1992, and that could have been
used to implement sustained fiscal consolidations, but basically that was never fully
pursued.
Figure 1 – General government debt implicit interest rate
0,0 1,0 2,0 3,0 4,0 5,0 6,0 7,0 8,0 9,0 10,0 11,0 12,0 13,0 14,0 15,0 16,0 1 9 8 0 1 9 8 1 1 9 8 2 1 9 8 3 1 9 8 4 1 9 8 5 1 9 8 6 1 9 8 7 1 9 8 8 1 9 8 9 1 9 9 0 1 9 9 1 1 9 9 2 1 9 9 3 1 9 9 4 1 9 9 5 1 9 9 6 1 9 9 7 1 9 9 8 1 9 9 9 2 0 0 0 2 0 0 1 2 0 0 2 2 0 0 3 2 0 0 4 2 0 0 5 2 0 0 6 2 0 0 7 2 0 0 8 2 0 0 9 2 0 1 0 2 0 1 1 2 0 1 2 2 0 1 3 %
Source: European Commission, AMECO, October 2012. Own calculations for the implicit interest rate, which is Interest payments/Government debt *100.
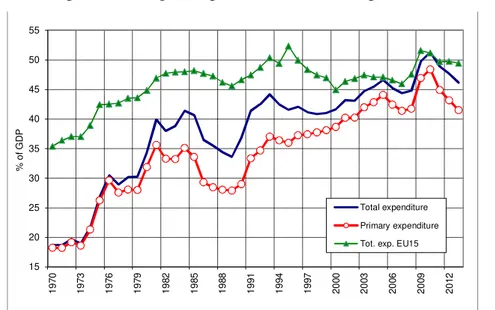
Indeed, public primary expenditure in Portugal has been trending upwards since the late
1980s, after the adhesion to the EU (see Figure 2). Indeed, primary expenditure averaged
23.5%, 31.6%, 35.7%, and 42% of GDP respectively in the 1970s, 1980s, 1990s, and
2000s. This contrasts with the developments observed on average in the EU, where the
government spending-to-GDP ratio remained more stable.
Another worrisome conclusion (see Figure 3) is the existence of high budget balance
deficits and rather inexistent primary surpluses in the last decades.2 Indeed, the budget deficit in the period 1974-2012 was below 3% of GDP only in two years, 1989 and 1999,
2 See Guichard and Leibfritz (2006), Pina (2004), and Cunha and Braz (2009) for assessments of the pitfalls
with average budget balances of -6.9%, -5.0%, -4.8%t of GDP respectively in the 1980s,
1990s, and 2000s. In such context, it was not surprising that two distinct stylized events,
but naturally connected, occurred. First, the fact that the few fiscal consolidations that took
place in the period 1970-2012 were mostly short lived. Second, the recurrent Excessive
Deficit Procedures opened for Portugal after 2001 (three in total).
Figure 2 – General government spending-to-GDP ratios, Portugal and EU15 (1970-2013)
15 20 25 30 35 40 45 50 55
1
9
7
0
1
9
7
3
1
9
7
6
1
9
7
9
1
9
8
2
1
9
8
5
1
9
8
8
1
9
9
1
1
9
9
4
1
9
9
7
2
0
0
0
2
0
0
3
2
0
0
6
2
0
0
9
2
0
1
2
%
o
f
G
D
P
Total expenditure
Primary expenditure
Tot. exp. EU15
Source: European Commission, AMECO, October 2012.
Another worrisome conclusion (see Figure 3) is the existence of high budget balance
deficits and rather inexistent primary surpluses in the last decades.3 Indeed, the budget deficit in the period 1974-2012 was below 3% of GDP only in two years, 1989 and 1999,
with average budget balances of -6.9%, -5.0%, -4.8%t of GDP respectively in the 1980s,
1990s, and 2000s. In such context, it was not surprising that two distinct stylized events,
but naturally connected, occurred. First, the fact that the few fiscal consolidations that took
place in the period 1970-2012 were mostly short lived. Second, the recurrent Excessive
Deficit Procedures opened for Portugal after 2001 (three in total).
More specifically, we can observe in the 1990s and in the 2000s a higher
spending-to-GDP ratio in terms of the compensation of public employees, vis-à-vis the EU15 average.
3 See Guichard and Leibfritz (2006), Pina (2004), and Cunha and Braz (2009) for assessments of the pitfalls
That ratio in Portugal trended upwards after 1986, and stayed above the EU15 average all
through the 1990s, being only reversed after 2005 (see Figure 4). However, part of the
reversion in 2003 is due to the fact that several hospitals were given the status of
enterprises, and exited the general government sector, implying the reduction in the number
of employees and in the overall wage bill.
Figure 3 – Budget balance and debt-to-GDP ratios in Portugal (1973-2013)
14 18 22 26 30 34 38 42 46 50 54 58 62 66 70 74 78 82 86 90 94 98 102 106 110 114 118 1 9 7 3 1 9 7 4 1 9 7 5 1 9 7 6 1 9 7 7 1 9 7 8 1 9 7 9 1 9 8 0 1 9 8 1 1 9 8 2 1 9 8 3 1 9 8 4 1 9 8 5 1 9 8 6 1 9 8 7 1 9 8 8 1 9 8 9 1 9 9 0 1 9 9 1 1 9 9 2 1 9 9 3 1 9 9 4 1 9 9 5 1 9 9 6 1 9 9 7 1 9 9 8 1 9 9 9 2 0 0 0 2 0 0 1 2 0 0 2 2 0 0 3 2 0 0 4 2 0 0 5 2 0 0 6 2 0 0 7 2 0 0 8 2 0 0 9 2 0 1 0 2 0 1 1 2 0 1 2 2 0 1 3 % G D P ( R e v , S p e n d , D e b t) -12.0 -11.0 -10.0 -9.0 -8.0 -7.0 -6.0 -5.0 -4.0 -3.0 -2.0 -1.0 0.0 1.0 2.0 3.0 4.0 5.0 6.0 7.0 8.0 9.0 10.0 % G D P ( B a la n c e )
Budget balance Total revenue Total spending Debt
Source: European Commission, AMECO October 2012.
More specifically, we can observe in the 1990s and in the 2000s a higher
spending-to-GDP ratio in terms of the compensation of public employees, vis-à-vis the EU15 average.
That ratio in Portugal trended upwards after 1986, and stayed above the EU15 average all
through the 1990s, being only reversed after 2005 (see Figure 4). However, part of the
reversion in 2003 is due to the fact that several hospitals were given the status of
enterprises, and exited the general government sector, implying the reduction in the number
of employees and in the overall wage bill.
In practice, in Portugal there have been recurrent difficulties related to primary
or the inability of a firm reigning in of general government spending.4 In fact, the necessary increase of some social spending that was undertaken, is not the issue, but rather the lack of
more structurally growth enhancing policies such as well targeted education spending.
For instance, it is true that public investment in infrastructure in the past has delivered
positive macroeconomic rates of returns (see Afonso and St. Aubyn, 2009, who assess the
period 1981-2005 in the case of Portugal). However, there are limits to how much physical
infrastructure a country needs, notably financed with public funds, while the eventual
crowding in effects of public investment will also diminish.
Figure 4 – Compensation of employees in Portugal (1973-2013)
4,0 6,0 8,0 10,0 12,0 14,0 16,0
1
9
7
0
1
9
7
3
1
9
7
6
1
9
7
9
1
9
8
2
1
9
8
5
1
9
8
8
1
9
9
1
1
9
9
4
1
9
9
7
2
0
0
0
2
0
0
3
2
0
0
6
2
0
0
9
2
0
1
2
%
o
f
G
D
P
Compensation of em ployees (General government)
Portugal
EU15
Source: European Commission, AMECO, October 2012.
Additionally, Afonso, Claeys and Sousa (2011) find evidence of budget deficit bias in
Portugal, with recurrent tax reversals making the budget balance rather pro-cyclical. On the
other hand, periods of more robust economic growth have typically been used to relax tax
pressure, notably especially during elections. Moreover, one-off measures have been
preferred over structural measures to contain the budget deficit during economic crises,
4 According to Afonso and Claeys (2008), the main reasons for the three initial breaches of the SGP in 2002
particularly also to fulfil the SGP requirements.5 Interestingly, they also identify a fiscal
regime shift in 1988 for Portugal, whereupon fiscal policy changes from being rather more
active and a-cyclical to slightly more passive and pro-cyclical thereafter. Unfortunately,
that mitigated change was not strong enough to ensure fiscal sustainability.
Therefore, as a result of past trends in fiscal policies in Portugal, it is not surprising that
almost all existing studies regarding the sustainability of public finances recurrently have
placed Portugal in the category of the countries that lack fiscal sustainability, notably
flagging the absence of cointegration between government spending and revenues (see, for
instance, Afonso, 2005, Marinheiro, 2006, Afonso and Rault, 2010, and Afonso and Jalles,
2012). More specifically, Afonso and Sousa (2011a) also report that Portugal’s fiscal
position has significantly deteriorated over the period 1978:1-2007:4, reflecting the high
persistence of government spending. In fact, the higher persistence of government spending
relative to government revenue has been the major determinant of the fiscal deterioration
over that period.
Even though government spending trended upwards in the 1990s-2000s in Portugal,
existing evidence shows that some room for improvement is available regarding what each
euro spent has provided in terms of public services. According to Afonso, Schuknecht, and
Tanzi (2005), and with data for OECD countries for the decade ended in 2000, Portugal
should have been able, theoretically, to attain the same level of output in public services,
using only around 80% of the inputs (total government spending) that were effectively
used. On the other hand, and from an output perspective that study reports that with the
same level of resources, the level of output might have been around 30% higher. Such
quality issues have not been too present in the debate, even though countries in the EU are
5 In 2004 there were transfers from state-owned enterprises (Caixa Geral de Depósitos, Navegação Aérea de
asked to report some related information in their respective Stability and Convergence
Programmes.
Another stylised observation can be offered regarding the rising trends of both the
general government debt ratio and the unemployment rate (see Figure 5). Without dwelling
on any causality, it is still interesting to wonder to what extent there might have been some
crowding out of financing in private activities, due to the increasing financing needs of the
government, and whether that has been relevant for employment creation. This is a thought
for further analysis, possibly exploring the existence of crowding out effects in the
financing conditions in the economy.
Figure 5 – Debt-to-GDP ratio and unemployment rate in Portugal (2000-2013)
Source: European Commission, AMECO, October 2012.
For instance, Afonso and Jalles (2013) find that the growth impact of a 10 percentage
points increase in the debt ratio is -0.2% (0.1%) respectively for countries with debt ratios
above (below) 90% (30%), and they derive an endogenous debt ratio threshold of 58% for
the euro area implying that above that level government debt is detrimental to growth.
2.2. Fiscal contractions and expansions
In order to assess the past stance of fiscal policy in Portugal, we looked at the change
in the cyclically adjusted primary budget balance (CAPB) as a percentage of GDP, a widely
used measure, to determine the periods where so-called fiscal episodes occur. Therefore, 30
34 38 42 46 50 54 58 62 66 70 74 78 82 86 90 94 98 102 106 110 114 118
2
0
0
0
2
0
0
1
2
0
0
2
2
0
0
3
2
0
0
4
2
0
0
5
2
0
0
6
2
0
0
7
2
0
0
8
2
0
0
9
2
0
1
0
2
0
1
1
2
0
1
2
2
0
1
3
D
e
b
t,
%
G
D
P
4 5 6 7 8 9 10 11 12 13 14 15 16
U
n
e
m
p
lo
y
m
e
n
t
ra
te
(
%
)
along the lines of Afonso (2010), we define, in a simplified way, the occurrence of a fiscal
episode when the change in the CAPB is at least one standard deviation in a given year (we
consider here the standard deviation of the full time series used for Portugal, 1970-2011).
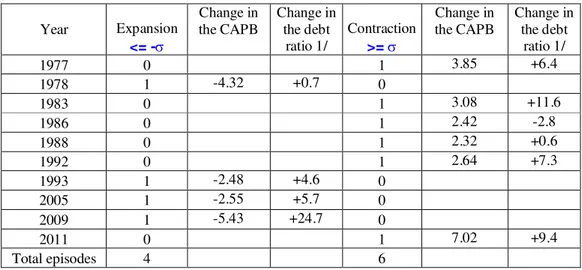
Table 1 reports the fiscal episodes, contractions and expansions, uncovered with the
above mentioned approach. It is possible to see that in the period 1970-2011, there were
four episodes of fiscal expansion, and six episodes of fiscal contraction. The fiscal
expansions in 1993 and the more recent ones in 2005 and 2009 seem now to be
counterproductive given the continuing worsening of fiscal imbalances.
Table 1 – Fiscal episodes in Portugal, 1970-2011 (change in the cyclically adjusted primary balance, % of GDP)
Year Expansion
<= -
Change in the CAPB
Change in the debt
ratio 1/
Contraction
>=
Change in the CAPB
Change in the debt
ratio 1/
1977 0 1 3.85 +6.4
1978 1 -4.32 +0.7 0
1983 0 1 3.08 +11.6
1986 0 1 2.42 -2.8
1988 0 1 2.32 +0.6
1992 0 1 2.64 +7.3
1993 1 -2.48 +4.6 0
2005 1 -2.55 +5.7 0
2009 1 -5.43 +24.7 0
2011 0 1 7.02 +9.4
Total episodes 4 6
Source: Data, European Commission, AMECO, October 2012; plus own calculations. - standard deviation of the cyclically adjusted primary balance.
1/ Change in the debt ratio (percentage points) two years after the fiscal episode = Dt+2-Dt.
However, if one observes the development of the government debt-to-GDP ratio after
those periods, as an ad-hoc way of checking the degree of success of the fiscal contractions,
the reality shows that the debt ratio either continued to increase or had only very small
decreases, the exception being 1986. Indeed, the change in the debt-ratio was recorded at
+6.4, +11.8, -2.8, +0.6, +7.3, and +9.4 percentage points, respectively two years after the
(forecast).6 To illustrate further the difficulties plaguing public finances in 2011, suffices to notice that there is no memory in Portugal of a fiscal contraction of the size of the one
measured by the improvement of the CAPB in 2011, and in spite of that adjustment, two
years after that fiscal contraction the debt ratio is still increasing.
Moreover, between 1989 and 2006 the Government obtained significant revenues from
privatisations, and around 12.8% of which were used for government debt redemptions.
Therefore, such historical lack of success in fiscal consolidations essentially contributed to
compound the existence of fiscal sustainability problems.
More specifically, and since more recently, the 2009 expansion is rather paradigmatic
of a mistaken assessment about whether Portugal could have had an expansionary fiscal
policy in that period. That was actually less warranted, even if there was a somewhat
unclear EC policy assessment and issuing of guidelines at the time.
Indeed, we may recall that the EC asked for a so-called TTT (timely, targeted,
temporary) fiscal impulse, as reported on November 2008 notably in the European
Economic Recovery Plan. Such short-term TTT budgetary impulse would amount to EUR
200 billion (1.5% of EU GDP), supported by the Member States (EUR 170 billion, 1.2% of
EU GDP), and by the EU and the European Investment Bank (EUR 30 billion (0.3% of EU
GDP). The problem was that one year after, the EC called for a fiscal contraction. But the
fiscal stance in Portugal in 2009 (again measured by the cyclically adjusted primary
balance) was strongly expansionary by around 5% of GDP. And once the “order” to spend
was given, the reversal of the process proved to be impossible in a contemporaneous
fashion. In practice, discretionary fiscal policy was favoured instead of allowing for only
the operation of the automatic fiscal stabilisers.
In retrospective, and to be fair, one may argue that the “license to spend”, issued by the
EC, was not for everybody, and just for the countries that had sufficient fiscal leeway at the
time. Again, an illustration of the pitfalls of implementing fiscal policies in a financially
6 The Portuguese Escudo effective exchange rate faced a devaluation of 17 and 23 per cent respectively in
constrained environment, coupled with some political cycle looming alongside economic
policy decisions (in fact, there were parliamentary elections in Portugal in 2009).7
3. The fiscal débacle
3.1. The pressure in the capital markets
The unstoppable vicious circle of rising long-term government bond yields and
sovereign downgrades, that preceded the request for financial support in 2011, is illustrated
in Figure 6. Indeed, subsequent packages of fiscal measures in 2010 and in 2011 went
alongside the successive downgrades from the three main rating agencies. In fact, the
collage of measures, under some pressure, has in the end come short of what was needed to
convincingly solve the lack of trust exhibited by capital markets. Moreover, the fact that the
sovereign rating downgrades continued to occur, even after the May 2011 bailout also fed
into the rising of the yields (see next section).
Figure 6 – 10-year government bond yield and ratings (3 Aug 2009 – 15 Apr 2011)
Notes: daily yields from Reuters. PS – Socialist Party; PR – President of the Republic; PM – Prime Minister; M – Moody’s; S&P – Standard and Poors; F – Fitch.
7 See Figure A1 in the Appendix for the time plot of parliamentary elections together with the fiscal stance in
Portugal as measured by the CAPB. A moderate negative correlation (-0.22) emerges signalling a more lax fiscal stance around elections.
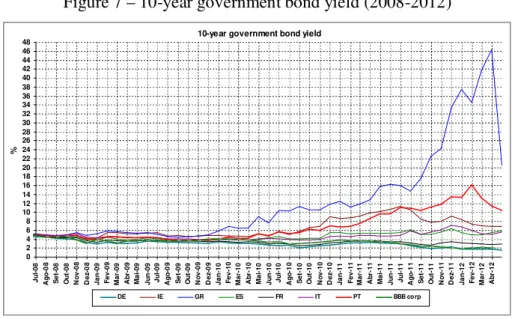
In the context of such, even if excessive, process of downgrades and overall rising
yields in the euro area periphery, notably in the aftermath of the 15th September 2008
Lehman Brothers bankruptcy (see Figure 7) little room for manoeuvre was left for the
authorities, which essentially could find only short-term financing in the markets via
Treasury Bills.8 Therefore, in the second quarter of 2012, one year after the bailout, Portuguese sovereign debt was still rated with junk status (see euro area country ratings in
the Appendix).
Figure 7 – 10-year government bond yield (2008-2012)
Source: Datastream.
On the other hand, less accurate fiscal and macro forecasts are also not welcomed by
capital markets. For instance, Afonso and Nunes (2012) find that in the case of Portugal,
corrections in EC forecasts for government debt (t+1, t-1 and t-2), real effective exchange
rate (t and t-2) and inflation (t and t+1) have a significant impact on the 10-year sovereign
yields.
Again, and to be a bit fairer with the policy makers, we have witnessed that before the
starting of the global credit crunch, essentially pinpointed in the literature by the first large
8 See Afonso and Gomes (2011) for an assessment of how some under rating in the sovereign bond market
may have occurred in that period, notably for Portugal and for other countries as well. Additionally, Afonso, Arghyrou and Kontonikas (2012) uncover some potential speculative mispricing in sovereign bond prices in that period.
10-year government bond yield
0 2 4 6 8 10 12 14 16 18 20 22 24 26 28 30 32 34 36 38 40 42 44 46 48 J u l-0 8 A g o -0 8 S e t-0 8 O u t-0 8 N o v -0 8 D e z-0 8 J a n -0 9 F e v -0 9 M a r-0 9 A b r-0 9 M a i-0 9 J u n -0 9 J u l-0 9 A g o -0 9 S e t-0 9 O u t-0 9 N o v -0 9 D e z-0 9 J a n -1 0 F e v -1 0 M a r-1 0 A b r-1 0 M a i-1 0 J u n -1 0 J u l-1 0 A g o -1 0 S e t-1 0 O u t-1 0 N o v -1 0 D e z-1 0 J a n -1 1 F e v -1 1 M a r-1 1 A b r-1 1 M a i-1 1 J u n -1 1 J u l-1 1 A g o -1 1 S e t-1 1 O u t-1 1 N o v -1 1 D e z-1 1 J a n -1 2 F e v -1 2 M a r-1 2 A b r-1 2 %
ECB emergency loan provided to European banks in response to increasing pressures in the
interbank market on 9 July 2007, yields spreads were essentially similar and small across
the euro area. Therefore, capital markets have been either not pricing or mispricing the
developments of fiscal variables in many euro area countries before that period.9 In fact, we have observed an amazingly constant flatness of most 10-year sovereign yields even until
2008 (see again Figure 7).
3.2. The bailout
On April 2011, Portugal asked for the financial support of the EU and of the IMF,
signing a MEFP. The Economic Adjustment Program for Portugal covers the financing
needs of the General Government from mid-2011 to mid-2014, amounting to EUR 78
billion, including also EUR 12 billion for banking recapitalization. The disbursements are
subject to quarterly assessments, and the MEFP requires a strong consolidation of public
finances and covers also structural reforms. One can recall that at the time Portugal was
already undergoing an EDP, launched in 2009, with 2014 as the deadline for the correction
of the excessive deficit. Such deadline was afterwards postponed in the context of the
agreements with the EU and the IMF.10
In practice, the overall euro area context was such that in 2010-2011, Greece, Portugal,
and Ireland all asked for international financial support. The financial rescue packages were
organised by the EU, the European Financial Stabilisation Facility (EFSF), the European
Central Bank (ECB), and the IMF. A second loan was agreed for Greece in 2011, involving
a haircut of privately-held debt. In addition, during 2012 Italian and Spanish bonds have
come also under significant pressure.
Other features that underpinned somewhat the fiscal débacle were both the revisions to
past budget deficit and government debt data, stemming from the change in the perimeter
of the general government, and the lack of adherence of some official fiscal forecasts. If the
first feature could be seen to some extent exogenous to the Members States of the EU, and
9 See Afonso, Arghyrou, and Kontonikas (2012).
10 See the EC site for a chronology of the Excessive Deficit Procedures for Portugal:
therefore to Portugal, the second feature has been a problem notably in several European
countries, with different degrees of acuity.
For instance, Afonso and Silva (2012), looking at Portuguese official forecasts for the
period 1977-2011, report evidence of unfavourable errors regarding the budget balance in
most years, which have been offset in some cases (totally or partially) by a favourable
nominal GDP effect deviation. Therefore, in an already difficult international context, the
credibility of fiscal and macro forecasts, plagued with successive unfavourable revisions,
when based on less realistic assumptions, may also have had an unwarranted effect in the
perceptions developed by capital markets.
Moreover, and in order to implement a fiscal adjustment with some magnitude, already
in the period 2011-2012, the authorities used again one-off measures, reviving the
2002-2004 experiences. For instance, in 2011 additional revenues were obtained from the transfer
of assets from pension funds of several financial institutions as well as extraordinary
revenue from a personal income tax surcharge. Such one-off measures amounted to 4% of
GDP in 2011 and 1.2% of GDP in 2012 (see Banco de Portugal, 2012).
In the context of the implementation of a financial assistance programme, the
authorities tend to struggle to follow ad-hoc rules of thumb such as for a 1/3, 2/3 share of
fiscal adjustment, respectively via the revenues and the spending side. Those fiscal austerity
strategies, given that the feedback effect on growth is not easy to forecast, are usually
fraught with difficulties regarding their success, and the outcomes tend to be uncertain.11 For the purpose of illustrating the effects of rising interest rates on general government
debt interest payments, the change in interest payments can be decomposed into three
effects: i) an effect stemming from changes in government debt (a so-called quantity
effect), ii) an effect resulting from changes in interest rates (a so-called price effect), and
iii) a residual cross effect. Therefore, the change in interest payments, I, can be decomposed
as follows:
11 Although some evidence points to the fact that expansionary fiscal policies in Portugal do not, per se, seem
Effect via Effect via Cross effect change in change in (residual)
debt interest rate
I
B i
i B
B
i
(1)where B is the general government debt and i is the average implicit interest rate (I/B).
Figure 8 shows the effect of the upward contribution from the change in interest rates
to the overall change in interest payments in 2011 and in 2012, notably as a result of the
difficulties in raising financing in the capital markets. Moreover, the impact on interest rate
payments from the change in interest rates was higher in that period than the effect from the
change in debt itself. Those developments contrast markedly with the period just before the
financial bailout, 2009-2010, where the change in interest rates contributed to decrease the
overall interest rate payments, while the rising stock of outstanding government debt had
then an opposite effect.
Figure 8 – Decomposition of the change in interest payments: 1981-2013 (% of GDP)
-1,50 -1,30 -1,10 -0,90 -0,70 -0,50 -0,30 -0,10 0,10 0,30 0,50 0,70 0,90 1,10 1,30 1,50 1,70 1,90 1 9 8 1 1 9 8 2 1 9 8 3 1 9 8 4 1 9 8 5 1 9 8 6 1 9 8 7 1 9 8 8 1 9 8 9 1 9 9 0 1 9 9 1 1 9 9 2 1 9 9 3 1 9 9 4 1 9 9 5 1 9 9 6 1 9 9 7 1 9 9 8 1 9 9 9 2 0 0 0 2 0 0 1 2 0 0 2 2 0 0 3 2 0 0 4 2 0 0 5 2 0 0 6 2 0 0 7 2 0 0 8 2 0 0 9 2 0 1 0 2 0 1 1 2 0 1 2 2 0 1 3
Change in debt Change in interest rate Cross effect
4. Conclusion
It seems fair to say that in Portugal there has been in the past a lack of a clear control of
(primary) public spending in the 1990s and in the 2000s, notably after 2008, and
governments have used too many off-budget measures to mitigate the imbalances in the
fiscal accounts. More recently, in 2009, fiscal policy followed an expansionary track in
Portugal, notably after some less fortunate policy guidelines voiced by some European
institutions.
In addition, pro-cyclical fiscal policies have exacerbated economic instability with the
distortionary effects of taxation becoming larger, and consequently undermining economic
growth prospects. In practice, the operation of the automatic fiscal stabilisers was usually
overridden by discretionary fiscal measures.
Therefore, and in a nutshell, the 2011 financial rescue, embedded in the Economic and
Financial Assistance Programme agreed between the national authorities and the EC, the
ECB and the IMF, was to some extent triggered by several internal and external constraints
and factors:
i) own policy errors, which seem to have cut across political partisanship;12 ii) strong general government primary spending persistence;
iii) the use of extraordinary or one-off fiscal measures, instead of more structural
fiscal adjustment measures;
iv) some recurrent pitfalls in fiscal forecasting (both at the national and at the EU
institutions level);
v) an exogenous hostile environment in capital markets, notably after the
sovereign debt crisis that materialised after 2009.
In retrospective, we can see the 2010 SGP as a lost opportunity, at the time, to clearly
flag to the markets an encompassing package of credible and well thought fiscal
consolidation measures. Indeed, several studies have pointed at length that fiscal
developments do matter for the setting of sovereign debt ratings by the rating agencies, and
12 In the Appendix, Table A2, we list the Ministers of Finance and the budget balance and debt ratios,
for the perception of investors about the default risk of a sovereign.13 In the end, more strict measures were then adopted one year after, under much less friendly market conditions,
and to some extent, imposed by the institutions that provided the financial support to
Portugal.
On the other hand, the experiences, notably in the period 2002-2004 (and in the period
2011-2012), of using temporary solutions to reduce fiscal imbalances, have proved to be
short lived in their effects. Therefore, policy decisions that favour such one-off measures
seem less likely to ensure a long-term adjustment of the fiscal position of a country.
Additionally, the future spending responsibilities stemming from public-private
partnerships that have been implemented in Portugal, and eventually also related to
state-owned enterprises, seem to pose relevant risks for public finances, not yet fully chartered.
References
Afonso, A. (2005). “Fiscal Sustainability: the Unpleasant European Case,” FinanzArchiv, 61 (1), 19-44.
Afonso, A. (2010). “Expansionary fiscal consolidations in Europe: new evidence”, Applied
Economics Letters, 17 (2), 105-109.
Afonso, A., Arghyrou, M., Kontonikas, A. (2012). “The determinants of sovereign bond yield spreads in the EMU”. Department of Economics, ISEG-UTL, Working Paper 36/2012/DE/UECE.
Afonso, A., Claeys, P. (2008). “The dynamic behaviour of budget components and output”.
Economic Modelling, 25 (1), 93-117.
Afonso, A., Furceri, D., Gomes, P. (2012). “Sovereign credit ratings and financial markets linkages: application to European data”, Journal of International Money and Finance, 31 (3), 606-638.
Afonso, A., Claeys, P., Sousa, R. (2011). “Fiscal Regime Shifts in Portugal”, Portuguese
Economic Journal, 10 (2), 83-108.
Afonso, A., Gomes, P. (2011). “Do fiscal imbalances deteriorate sovereign debt ratings?”
Revue Économique, 62 (6), 1123-1134.
Afonso, A., Gomes, P., Rother, P. (2011). “Short and Long-run Determinants of Sovereign Debt Credit Ratings”, International Journal of Finance and Economics, 16 (1), 1-15. Afonso, A. and Jalles, J. (2012). “Revisiting Fiscal Sustainability: Panel Cointegration and
Structural Breaks in OECD countries”. European Central Bank,Working Paper 1465. Department of Economics, ISEG-UTL, Working Paper nº 29/2012/DE/UECE.
Afonso, A., Jalles, J. (2013). “Growth and Productivity: the role of Government Debt”,
International Review of Economics and Finance, 25, 384-407.
Afonso, A., Nunes, A. S. (2012). “Economic forecasts and sovereign yields”, Department of Economics, ISEG-UTL, Working Paper xx/2012/DE/UECE.
Afonso, A., Rault, C. (2010). “What do we really know about fiscal sustainability in the EU? A panel data diagnostic”, Review of World Economics, 145 (4), 731-755.
Afonso, A., Schuknecht, L., Tanzi, V. (2005). “Public Sector Efficiency: an International Comparison,” Public Choice, 123 (3-4), 321-347.
Afonso, A., Sequeira, A. (2010). “Revisiting business cycle synchronisation in the European Union”. Department of Economics, ISEG-UTL, Working Paper nº 22/2010/DE/UECE.
Afonso, A., Silva, J. (2012). “The fiscal forecasting track record of the European Commission and Portugal”, Department of Economics, ISEG-UTL, Working Paper 37/2012/DE/UECE.
Afonso, A., Sousa, R. (2011a). “Assessing Long-Term Fiscal Developments: Evidence from Portugal”, Applied Economics Letters, 18 (1), 1-5.
Afonso, A., Sousa, R. (2011b). “The Macroeconomic Effects of Fiscal Policy in Portugal: a Bayesian SVAR Analysis”, Portuguese Economic Journal, 10 (1), 61-82.
Afonso, A., St. Aubyn, M. (2009). “Macroeconomic Rates of Return of Public and Private Investment: Crowding-in and Crowding-out Effects”, Manchester School, 77 (S1), 21-39.
Banco de Portugal (2012). “Some considerations on the assessment of the fiscal policy stance”, Economic Bulletin - Autumn 2012, pp. 38-40.
Cunha, J., Braz, C. (2009). “The Main Trends in Public Finance Developments in Portugal: 1986-2008”, Banco de Portugal, Occasional Paper 01/2009.
Guichard, S. and Leibfritz, W. (2006). “The Fiscal Challenge in Portugal”, OECD Working Paper 489.
Marinheiro, C. (2005). “The sustainability of Portuguese fiscal policy from a historical perspective,” Empirica, 33(2), 155-179.
OECD (2012). Economic Surveys – Portugal, July 2012.
Appendix
Figure A1 – Cyclically adjusted primary balance and parliamentary elections in Portugal
-8 -6 -4 -2 0 2 4
1
9
7
0
1
9
7
2
1
9
7
4
1
9
7
6
1
9
7
8
1
9
8
0
1
9
8
2
1
9
8
4
1
9
8
6
1
9
8
8
1
9
9
0
1
9
9
2
1
9
9
4
1
9
9
6
1
9
9
8
2
0
0
0
2
0
0
2
2
0
0
4
2
0
0
6
2
0
0
8
2
0
1
0
2
0
1
2
%
o
f
G
D
P
CAPB
Source: European Commission, AMECO, October 2012. Vertical lines denote parliamentary elections (Portuguese Parliament).
Table A1 – Sovereign credit ratings for euro area countries (17 May 2012)
Ratings Characterization
of debt and issuer S&P Countries Moody’s Countries Fitch Countries
Highest quality AAA DE, FI, LU,
NL Aaa
AT, DE, FI,
FR, LU, NL AAA AT, DE, FI, FR, LU, NL
AA+ AT, BE, FR Aa1 AA+ ES
AA BE Aa2 AA BE, SI
High quality
AA- EE Aa3 BE AA-
A + SI A1 EE A+ EE, MT, SK
A CY, SK A2 CY, SI, SK A ES, SI
Strong payment capacity
A- MT A3 ES, IT, MT A- IT
BBB+ ES, IE, IT Baa1 BBB+ IE
BBB Baa2 BBB
Adequate payment capacity
BBB- Baa3 BBB- CY
BB+ CY Ba1 CY, IE BB+ PT
BB PT Ba2 BB
Likely to fulfil obligations
BB- Ba3 PT BB-
B+ B1 B+
B B2 B
High credit risk
B- B3 B- GR
Very high credit risk
CCC GR Caa1 CCC
Default C GR C
Table A2 – Budget balance and government debt, % of GDP; Prime Ministers and Finance Ministers in Portugal (Constitutional governments)
Dates Minister of Finance Prime Minister
Government’s party affiliation
Budget Balance
Govern ment
debt
23-07-1976 Henrique Medina Carreira Mário Soares PS 1976 -5.1 25.9
1977 PS-CDS 1977 -3.8 27.3
30-01-1978 Vitor Constâncio PS 1978 -5.7 29.9
29-08-1978 José da Silva Lopes Alfredo Nobre da Costa Independent
22-11-1978 Manuel Jacinto Nunes Carlos Mota Pinto Independent
01-08-1979 António Sousa Franco Maria de Lourdes Pintasilgo Independent 1979 -5.3 33.8
03-01-1980 Aníbal Cavaco Silva Francisco Sá Carneiro/Diogo
Freitas do Amaral
PSD-CDS 1980 -8.0 30.6
09-01-1981 João António Morais Leitão Francisco Pinto Balsemão PSD-CDS 1981 -11.7 39.0
04-09-1981 João Salgueiro PSD-CDS
1982 PSD-CDS 1982 -7.9 41.8
09-06-1983 Ernâni Rodrigues Lopes Mário Soares PS-PSD 1983 -6.4 46.7
1984 PSD 1984 -9.7 51.4
06-11-1985 Miguel Cadilhe Aníbal Cavaco Silva PSD 1985 -9.6 58.4
1986 PSD 1986 -5.4 57.3
17-08-1987 Miguel Cadilhe Aníbal Cavaco Silva PSD 1987 -5.1 55.2
1988 PSD 1988 -3.2 54.7
1989 PSD 1989 -2.2 53.6
04-01-1990 Luís Miguel Beleza PSD 1990 -4.7 55.3
31-10-1991 Jorge Braga de Macedo Aníbal Cavaco Silva PSD 1991 -7.0 55.7
1992 PSD 1992 -4.4 50.0
07-12-1993 Eduardo Almeida Catroga PSD 1993 -7.5 54.6
1994 PSD 1994 -7.1 57.3
28-10-1995 António Sousa Franco António Guterres PS 1995 -5.0 59.2
1996 PS 1996 -4.5 58.3
1997 PS 1997 -3.4 54.4
1998 PS 1998 -3.5 50.4
25-10-1999 Joaquim Pina Moura António Guterres PS 1999 -2.7 49.6
2000 PS 2000 -3.3 48.4
03-07-2001 Guilherme d'Oliveira Martins PS 2001 -4.8 51.1
06-04-2002 Manuela Ferreira Leite Durão Barroso PSD-CDS/PP 2002 -3.4 53.7
2003 PSD-CDS/PP 2003 -3.7 55.7
17-07-2004 António Bagão Félix Pedro Santana Lopes PSD-CDS/PP 2004 -4.0 57.5
12-03-2005 Luís Campos e Cunha José Sócrates PS 2005 -6.5 62.5
21-07-2005 Fernando Teixeira dos Santos PS
2006 PS 2006 -4.6 63.7
2007 PS 2007 -3.2 68.3
2008 PS 2008 -3.7 71.6
26-10-2009 Fernando Teixeira dos Santos José Sócrates PS 2009 -10.2 83.1
2010 PS 2010 -9.8 93.3
21-06-2011 Vitor Gaspar Pedros Passos Coelho PSD-CDS/PP 2011 -4.2 107.8
2012 PSD-CDS/PP 2012 -4.7 113.9