Advanced Modelling of PSA Processes for Biogas
Upgrading
Master Thesis
Mónica Patrícia da Silva Santos
Supervisor: Prof. Alírio Rodrigues Co-Supervisor: Dr. Carlos Grande
LSRE – Laboratory of Separation and Reaction Engineering
Department of Chemical Engineering
Faculty of Engineering
University of Porto
Acknowledgments
Nesta secção quero agradecer a todos aqueles que de um modo ou de outro contribuíram para a realização desta tese.
Gostaria de agradecer aos meus orientadores, Professor Alírio Rodrigues e Dr. Carlos Grande. Ao Prof. Alírio pela disponibilidade demonstrada e ao Dr. Carlos Grande, que mesmo à distância, apoiou a execução desta tese e sempre se disponibilizou para me esclarecer.
Quero também agradecer a todos os colegas e amigos do LSRE.
Aos meus pais, “os meus pilares”, pela sua constante presença em todos os momentos da minha vida. Um muito obrigado.
Abstract
This work focused on the application of Pressure Swing Adsorption (PSA) for the upgrading of biogas to obtain bio-methane (purity > 98%) that can be used as renewable fuel. The effect of operating conditions using different materials (zeolite 13X and carbon molecular sieve 3K) was studied. Due to the high steepness of CO2 adsorption on zeolite 13X it was
observed that increasing the temperature from ambient to 323 K it is possible to improve the performance of the PSA unit and obtain bio-methane with purity higher than 99 % , recovery of 85 % and power consumption of 0.12 kW·mol-1 of produced methane.
Instead of the classical single-column simulation to describe the PSA performance, the more realistic multi-column PSA cycle was also investigated. A comparison of the results obtained between simulations using one-column simulation and two-column simulation was carried out to determine the effect of recycling contaminated streams in purge and pressure equalization steps. The results were obtained with a two-column PSA process using six-step cycle compressing pressurization, feed, depressurization, blowdown, purge and pressure equalization. It was found that the recycle of streams with purity lower than 99 % results in a significant decrease in the overall purity of bio-methane.
Finally, a new multi-column cycle was proposed with special emphasis in improving the PSA performance when using kinetic adsorbents. These adsorbents, carbon molecular sieves for example, are characterized by having slow adsorption kinetics resulting in large mass transfer zone (MTZ) inside the column. In this new column arrangement, when the heavy (most adsorbed) gas breaks through one column, the exit of this column is connected to other column (trim bed) where more heavy gas can be adsorbed. In this way, also more heavy gas will be adsorbed in the first (lead) column. The increase of process performance is directly related to the length of the MTZ: the larger the MTZ, the better will perform using the lead-trim beds concept. Two different adsorbents were employed in the process simulations: zeolite 13X (fast diffusion) and carbon molecular sieve (slow diffusion). Using this new cycle, it was possible to obtain high purity bio-methane and unit productivity of 5.5 mol CH4 per hour per kilogram of carbon
molecular sieve.
Keywords: adsorption, biogas, zeolite 13X, carbon molecular sieve 3K, Pressure Swing Adsorption
Resumo
Este trabalho focou-se sobre a aplicação da Adsorção com Modulação de Pressão (AMP) na purificação do biogás para obter biometano (> grau de pureza; 98 %), sendo este gás considerado uma fonte renovável de energia que pode ser usado como combustível. Foi estudado o efeito das condições de operação empregando diferentes materiais (zeólito 13X e peneira molecular de carbono 3K). Devido ao declive acentuado da isotérmica de adsorção do CO2 no
zeólito 13X observou-se que aumentando a temperatura de operação para 323 K é possível melhorar o desempenho da unidade de AMP. Foi possível obter biometano com uma pureza superior a 99 %, com uma recuperação de 85 % e um consumo energético de 0.12 kW·mol-1 de metano produzido.
Em vez da simulação clássica de uma coluna para descrever o desempenho da unidade de AMP, a fim de se aproximar à prática real, foi estudado o desempenho de um ciclo com várias colunas de AMP. Os resultados obtidos nas simulações para uma e duas colunas foram comparados para determinar o efeito de reciclo de correntes contaminadas nas etapas de purga e de equalização de pressão. Os resultados foram obtidos para um processo de AMP com duas colunas usando um ciclo com seis etapas: pressurização, produção, despressurização intermédia, despressurização, purga e equalização de pressão. Observou-se que o reciclo de correntes com uma pureza inferior a 99 % conduz a uma diminuição significativa na pureza total do biometano. Finalmente, um novo ciclo com várias colunas foi proposto para melhorar, com especial ênfase, o desempenho da AMP empregando adsorventes cinéticos. Estes adsorventes, por exemplo as peneiras moleculares de carbono, são caracterizados por uma cinética lenta de adsorção tendo por resultado uma grande zona de transferência massa (ZTM) dentro da coluna. Neste novo arranjo de coluna, quando o gás pesado (o mais adsorvido) rompe à saída da coluna, a saída desta é conectada a uma outra (“trim bed”) onde mais gás pesado pode ser adsorvido. Deste modo, mais gás pesado será adsorvido igualmente na primeira coluna (“lead bed”). O aumento do desempenho do processo é relacionado directamente com o comprimento da ZTM: quanto maior a ZTM, melhor será o desempenho do conceito “lead-trim beds”. Dois adsorventes diferentes foram empregues nas simulações do processo: zeólito 13X (difusão rápida) e peneira molecular de carbono (difusão lenta). Usando este novo ciclo, foi possível obter biometano com um elevado grau de pureza e uma produtividade de 5.5 mol de CH4 por hora e por quilograma de
i
Contents
Acknowledgments ... i Abstract ... ii Resumo...iii Contents... i List of Figures ... ii List of Tables... iv Notation ... vi 1. Introduction ... 11.1. Motivation and Relevance... 1
1.2. Objectives and Outline ... 3
2. State of the Art ... 5
2.1. Biogas... 5
2.2. Pressure Swing Adsorption (PSA) ... 5
3. Fundamental Concepts of Adsorption... 7
3.1. The Adsorbent ... 7
3.1.1. Zeolites ... 8
3.1.2. Carbon Molecular Sieves (CMS) ... 9
3.2. Models for the Description of the Gas Adsorption Equilibrium... 9
3.2.1. The Langmuir Model ... 9
3.2.2. The Freundlich Model ... 10
3.2.3. The Toth Model... 10
3.2.4. The Multi-Site Langmuir or Nitta Model... 11
3.3. Adsorption kinetics. Diffusion in Porous Media... 12
3.3.1. Molecular Diffusion ... 12
3.3.2. Knudsen Diffusion ... 13
ii
4. Modelling of Pressure Swing Adsorption ... 16
4.1. Adsorption equilibrium and kinetics ... 16
4.2. Mathematical modelling of fixed-bed column ... 17
4.3. Modified Skarstrom cycle and performance variables... 20
5. Simulation of a PSA Process for Biogas Upgrading... 24
5.1. PSA sizing ... 24
5.2. Simulation of 1-column PSA ... 26
5.3. Effect of recycling streams in PSA ... 28
6. New Cycle Configuration to Enhance Performance of Kinetic PSA Processes ... 32
6.1. Cycle design ... 32
6.2. Results and Discussion... 34
6.2.1. Cycle Ι: 9-step lead-trim operation... 36
7. Conclusions and Recommendation for Future Work ... 42
7.1. Conclusions ... 42
7.2. Objectives Achieved and Recommendation for Future Work ... 43
References ... 44
Appendix ... 51
A. Correlations used for estimation of mass and heat transfer parameters employed in the mathematic model ... 51
B. Boundary and initial conditions of the PSA model ... 52
C. Preliminary Studies: 1-Column PSA performance... 54
D. Cycle ΙΙ: 11-step higher pressure purge step ... 56
List of Figures
Figure 3.1. Activated Carbon adsorbs gases and chemicals. ... 7Figure 3.2. Mechanisms of diffusion on macropore: a) Molecular Diffusion; b) Knudsen Diffusion; c) Poiseuille Diffusion. ... 14
iii
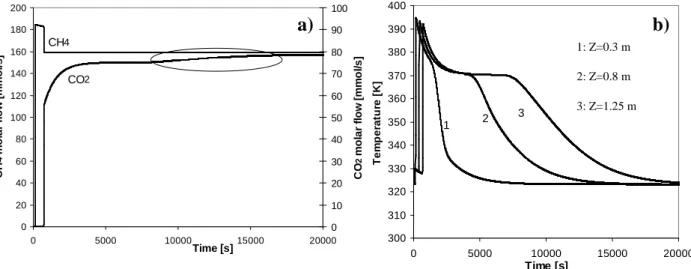
Figure 4.2. PSA cycle scheme (a) and pressure history of one CSS cycle (b) for a six steps 1-column PSA simulation... 21 Figure 4.3. PSA cycle scheme (a) and pressure history of one CSS cycle (b) for a six steps 2-column PSA simulation... 22 Figure 5.1(a) Molar flowrate of CH4 and CO2 and (b) temperature profiles at 0.3, 0.8 and 1.25 m
from feed inlet for a simulated binary curve (67 % of CH4 balanced by CO2) at 323 K, 4 bar with
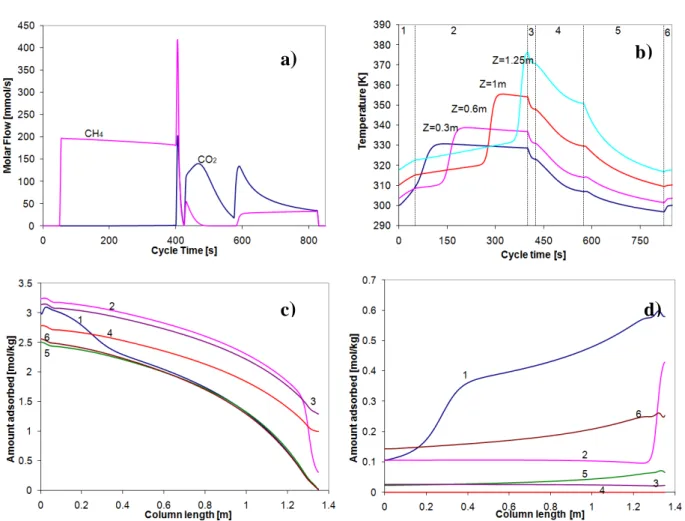
a total feed flowrate of 347.2 SLPM. ... 25 Figure 5.2. 1-column simulation of PSA for CH4-CO2 separation using zeolite 13X. Cycle
scheme is shown in Figure 4.2 and operating conditions in Table 5.3 (Run 21). Results presented are: a) Molar flowrate of each gas exiting the column, b) temperature histories at different positions (0.3, 0.6, 1 and 1.25 m) from feed inlet, for cyclic steady state, amount adsorbed of c) CO2 and d) CH4. ... 27
Figure 5.3. 2-column simulation of PSA for CH4-CO2 separation using zeolite 13X. Cycle
scheme is shown in Figure 4.3 and operating conditions in Table 5.4 (Run d, 2 bed). Results presented are: a) Molar flowrate of each gas exiting the column, b) temperature histories at different positions (0.3, 0.6, 1 and 1.25 m) from feed inlet, for cyclic steady state, amount adsorbed of c) CO2 and d) CH4. ... 30
Figure 5.4. Simulation results for PSA cycle employing one and two columns with cycle scheme showed in Figures 4.2 and 4.3, respectively.. ... 31 Figure 6.1. PSA cycle scheme used in simulation for PSA Cycle Ι... 33 Figure 6.2. 4-column simulation of PSA for CH4-CO2 separation using CMS-3K. Cycle scheme
is shown in Figure 6.1 and operating conditions in Table 6.2 (Run i). Results presented are: a) molar flowrate of each gas exiting the column and b) and typical pressure history of one CSS cycle used in simulation for PSA Cycle Ι.. ... 37 Figure 6.3. 4-column simulation of PSA for CH4-CO2 separation using CMS-3K. Cycle scheme
is shown in Figure 6.1 and operating conditions in Table 6.2 (Run i). Results presented are: a) gas phase concentration of CO2, b) amount adsorbed of CO2, c) amount adsorbed of CH4 and d)
steady state temperature profiles at different positions (0.3, 0.6, 1 and 1.25 m) from feed inlet.. 38 Figure 6.4. 4-column simulation of PSA for CH4-CO2 separation using Zeolite 13X. Cycle
scheme is shown in Figure 6.1 and operating conditions in Table 6.3 (Run e). Results presented are: a) molar flowrate of each gas exiting the column and b) steady state temperature profiles at different positions (0.3, 0.6, 1 and 1.25 m) from feed inlet. ... 40
iv
Figure 6.5. 4-column simulation of PSA for CH4-CO2 separation using Zeolite 13X. Cycle
scheme is shown in Figure 6.1 and operating conditions in Table 6.3 (Run e). Results presented are: a) gas phase concentration of CO2, b) amount adsorbed of CO2 and c) amount adsorbed of
CH4. ... 41
Figure C.1. Effect of purge flowrate in 1-column PSA performance: (a) CH4 purity and recovery
and (b) unit productivity and power consumption. ... 55 Figure C.2. Effect of purge time in 1-column PSA performance: (a) CH4 purity and recovery and
(b) unit productivity and power consumption. ... 55 Figure D.1. PSA cycle scheme used in simulation for PSA Cycle ΙΙ.. ... 56 Figure D.2. 4-column simulation of PSA for CH4-CO2 separation using CMS-3K. Cycle scheme
is shown in Figure D.1 and operating conditions in Table D.1. (Run n). Results presented are: a) molar flowrate of each gas exiting the column and b) and typical pressure history of one CSS cycle used in simulation for PSA Cycle ΙΙ.. ... 57
List of Tables
Table 3.1. Characteristic of major synthetic zeolite adsorbents... 8 Table 4.1. Adsorption equilibrium and kinetic parameters of CH4 and CO2 adsorption on zeolite
13X and CMS-3K... 17 Table 5.1. Physical properties of zeolite 13X used in the breakthrough and PSA simulations. ... 24 Table 5.2. Column characteristics and operating conditions used in the breakthrough and PSA simulations. ... 25 Table 5.3. 1-Column PSA performance for CH4/CO2 separation using zeolite 13X with modified
Skarstrom cycle. ... 26 Table 5.4. Comparison between the predicted performance of the studied PSA employing 1-column and 2-1-columns simulations... 29 Table 6.1. Physical properties of the CMS-3K employed in the PSA simulations... 35 Table 6.2. 4-Column PSA performance for CH4/CO2 separation using CMS-3K and the first
cycle configuration. ... 39 Table 6.3. 4-Column PSA performance for CH4/CO2 separation using Zeolite 13X and the first
v
Table A.1. Correlations used for estimation of mass and heat transfer parameters ... 51 Table B.1. Boundary and initial conditions of a PSA process for CO2/CH4 separation ... 52
Table C.1. 1-Column PSA performance for CH4/CO2 separation using zeolite 13X with modified
Skarstrom cycle.. ... 54 Table D.1. 4-Column PSA performance for CH4/CO2 separation using CMS-3K and the second
cycle configuration. ... 58 Table D.2. 4-Column PSA performance for CH4/CO2 separation using zeolite 13X and the
vi
Notation
ai number of neighbouring sites occupied by component i ap particle specific area (m-1)
Ai parameters relating the thermal variation of the heterogeneity coefficient
B& molar flowrate to be compressed
Bi parameters relating the thermal variation of the heterogeneity coefficient Bii mass Biot number of component i
Ci gas phase concentration of component i (mol·m-3)
p
C~ molar constant pressure specific heat of the gas mixture (J·mol-1·K-1)
s p
C~ constant volumetric specific heat of component i (J·kg-1·K-1)
i p,
C macropore averaged concentration of component i (mol·m-3)
pw
C~ constant pressure specific heat of the column wall (J·kg-1·K-1)
vi
C~ molar constant volumetric specific heat of component i (J·mol-1·K-1)
i ads, v,
C~ molar constant volumetric specific heat of component i adsorbed (J·mol-1·K-1)
dp particle diameter (m) dwi wall internal diameter (m)
D column diameter (m)
Dax axial dispersion coefficient (m2·s-1)
Dk,i Knudsen diffusivity of component i (m2·s-1) Dm,i molecular diffusivity of component i (m2·s-1) Dp,i macropore diffusivity of component i (m2·s-1)
∞
i u
D, micropore diffusivity of component i at infinite dilution (m2·s-1)
0 ,i
u
D diffusivity of component i at infinite temperature (m2·s-1)
e wall thickness (m)
Eai activation energy of micropore diffusion of component i (J·mol-1) 4
CH
F number of CH4 moles fed to the column in pressurization and feed steps (mol)
hf film heat transfer coefficient between the gas and the solid phase (W·m-2·K-1) hw wall heat transfer coefficient between the gas and the column wall (W·m-2·K-1) J diffusion flux (mol·m-1·s-1)
k Boltzmann constant (m2·kg·s-2·K-1)
vii
blowdown step (s-1)
kblow_eq constant for describing the time-evolution of variables and fluxes at boundaries, in the
pressure equalization depressurization step (s-1)
kf film mass transfer coefficient (m·s-1) kg gas thermal conductivity (W·m-1·K-1)
Kb,i barrier mass transfer coefficient of component i (m2·s-1)
Ki equilibrium constant of component i in the multisite Langmuir isotherm (Pa-1) Ki0 equilibrium constant at the limit T →∞ of component i (Pa-1)
Ku,i micropore diffusivity of component i (m2·s-1)
Ku,i0 limiting diffusivity at infinite temperature of component i (m2·s-1)
L column length (m)
Mw molecular weight (kg·mol-1) ni adsorbent heterogeneity Nu Nusselt number
P pressure (bar)
ni adsorbent heterogeneity
feed
n& moles of biogas available per unit of time (mol·s-1)
4
CH
N number of CH4 moles exiting the column in feed step (mol)
2
CO
N number of CO2 moles exiting the column in feed step (mol)
Plow blowdown pressure (bar) PE equalization pressure (bar) Phigh discharge pressure (bar) Pr Prandtl number
qi,max maximum adsorbed phase concentration of component i (mol·kg-1)
i
q macropore averaged adsorbed phase concentration of component i (mol·kg-1) ∗
i
q adsorbed phase in equilibrium with the average concentration in the macropores (mol·kg-1)
Qfeed feed flowrate (SLPM)
Qpurge purge flowrate (SLPM)
rp pore radius (m) 4
CH
R number of CH4 moles used in pressurization and purge steps (mol)
Re Reynolds number
viii
Rp particle radius (m)
Rw radius of the column wall (m) Sc Schmidt number
Sh Sherwood number
t time (s)
tblow blowdown step time (s) tfeed feed step time (s)
tlead feed 2 and lead adsorption steps times (s) tpress pressurization step time (s)
ttrim trim feed step time (s)
tpurge purge step time (s)
Tfeed feed temperature (K)
Tg gas temperature (K)
Ts solid phase temperature (K) Tw column wall temperature (K) T∞ ambient temperature (K) u0 superficial velocity (m·s-1)
U global external heat transfer coefficient (W·m-2·K-1)
x coordinate (m)
yCH4,feed molar fraction of methane in the feed and lead steps yi molar fraction of component i
z axial position (m)
Greek letters
αw ratio of the internal surface area to the volume of the column wall (m-1)
αwl ratio of the logarithmic mean surface area of the column shell to the volume of the
column wall (m-1)
ϵ attractive force constant in Lennard-Jones potential
εc bed porosity εp particle porosity
γ equal to 3/2 for ideal gases
λ heat axial dispersion coefficient (W·m-2·K-1)
∆Hads,i heat of adsorption of component i (J·mol-1) η mechanical efficiency (assumes a value of 0.8)
ix
µ gas viscosity (Pa·s)
ρb bulk density (kg·m-3) ρg gas density (kg·m-3) ρp particle density (kg·m-3) ρw column wall density (kg· m-3)
p
τ pore tortuosity
σ12 collision diameter from the Lennard-Jones potential (A) Ω function of ϵ/kT
Introduction 1
1. Introduction
1.1. Motivation and Relevance
There are several studies of CH4 / CO2 separation, where the separation was performed
with adsorbents that allow operation under kinetic-control regime (Cavenati, et al, 2005; Delgado et al., 2006a; Delgado et al., 2007; Gomes and Hassan, 2001; Grande and Rodrigues, 2007a; Kapoor and Yang, 1989; Kim et al., 2006; Pilarczyk et al., 1988; Schroter et al., 1989; Yang, 1987). However, there are also few studies, for the same mixture, operating with equilibrium adsorbents (Bonnot and Tondeur, 2006; Delgado et al., 2006b; Grande and Rodrigues, 2007a, b). Four (Skarstrom cycle, Skarstrom, 1960) or five steps single bed were considered in those studies. It was previously demonstrated that kinetic-based adsorbents may result in higher overall productivities than equilibrium-based adsorbents (Grande and Rodrigues, 2007a). The main reason for that was the strong non-linearity of the isotherms of equilibrium-based adsorbents like zeolites (Yang, 1987). However, the performance of equilibrium-equilibrium-based materials can be improved if higher temperatures are employed.
One objective of this work is to demonstrate that equilibrium-based adsorbents can significantly contribute to bio-methane production from thermophilic digestors where temperature is around 323 K (Zupancˇicˇ and Rosˇ, 2003). The feed conditions, corresponding to the biogas from thermofilic digestors, were fixed: 500 m3·day-1 (measured in standard conditions, 296.15 K and 1 atm), available at 323 K and with 67 % of CH4 and 33 % CO2. The
flowrate of 500 m3·day-1 with such composition can be obtained in waste-water treatment plants and in small/medium biogas digesters using crop residues. Several Pressure Swing Adsorption (PSA) simulations were performed to obtain a product (CH4) with over 98 % of purity and high
recovery. The influence of multi-column operation was studied using a modified Skarstrom cycle comprising: co-current pressurization with feed, feed, co-current pressure equalization depressurization, current blowdown, current purge with product and counter-current pressure equalization pressurization. The introduction of an equalization step introduced a great improvement in the PSA process (Berlin, 1966; Delgado and Rodrigues, 2008; Marsh et al., 1964; Wagner, 1969; Warmuzinski, 2002). The design of a PSA can be done by studying the performance of one column and avoiding recycling of gases from other columns. So far all biogas separation work in Laboratory of Separation and Reaction Engineering (LSRE) (Cavenati, et al, 2005; Grande and Rodrigues, 2007a, b) were performed employing only one column where the purge step was performed with pure methane. However, in industrial
Introduction 2
processes, where a multicolumn system is employed, and a stream with 0.1 % up to 2 % of CO2
is recycled in the pressure equalization(s) and purge steps, the result is a higher contamination of the product stream. For that reason to obtain more realistic results, the performance of all the columns and the impurities present in the recycled streams should be taken into account. The effect of recycling dirty streams was evaluated since the objective is to produce methane with 98 % purity (contamination of CO2 may reach 2 %). However, the design of a PSA unit using
kinetic adsorbents is challenging because the design cannot be performed using the simplified equilibrium theory concept (LeVan, 1998; Ruthven et al., 1994). In fact, using the equilibrium theory, one assumption is that the diffusion is very fast and thus the mass transfer zone (MTZ) happens in a small portion of the column. However, PSA process using adsorbents with slow diffusion kinetics are known by having large MTZ, often larger than the column length (Keller et al., 1987). Due to the large MTZ, the effective adsorption loading attained in each column is far distant from the maximum (equilibrium) adsorption loading. A direct consequence of this sub-utilization of the columns is a low productivity of kinetic PSA processes.
Any improvement of the process performance will reduce the size and thus the initial investment of the separation. It was previously suggested that connecting two beds in series (lead-trim) can be advantageous since there is more contact time between the gas and the adsorbent (Keller et al., 1987). This concept was initially developed for TSA processes where the column regeneration is performed at higher temperature than adsorption. The adsorbent temperature should be increased to promote desorption almost always followed by a purge to remove the desorbed gas. After that, a cooling step should be done to return the column to adsorption condition (Keller et al., 1987). If this step begins only after all the heated bed, the adsorption column will remain at that temperature for the time that the cooling front takes to cross it and consequently, much of the heat is removed from the bed. One way to overcome this limitation is putting the beds in series; one bed is on adsorption, other on regeneration and a third on cooling step. The MTZ passes completely through the first (lead) column into the second (trim) bed. After the lead bed is saturated it should be regenerated and the trim bed becomes the lead bed. In order to carry out this separation, a minimum of three columns should be employed. Although this concept was described for Temperature Swing Adsorption (TSA) operation dealing with diluted mixtures, it is possible to extend this concept to PSA processes.
In this work, this lead-trim concept is employed for the operation of a new PSA cycle, specially focused for kinetic adsorbents. We have taken as example the removal carbon dioxide of from biogas (33 % CO2 and 67 % CH4) with the aim of obtaining methane with purity higher
Introduction 3
Wellinger, 2009). Simulations of the PSA cycle using two different adsorbents was carried out. The first adsorbent is zeolite 13X where the diffusion is very fast and the long mass transfer zone is caused by thermal effects while the second adsorbent is carbon molecular sieve 3K (CMS-3K) where diffusion of methane is extremely slow. The possibility of reducing power consumption by performing purge at higher pressure was also analyzed.
1.2. Objectives and Outline
The general objective of this thesis is the upgrading of biogas by Pressure Swing Adsorption (PSA). The first part is dedicated to study the recycle effect of highly contaminated streams in the PSA performance, particularly in the methane purity. For this purpose, several simulations of a process for binary separation of CH4-CO2 using zeolite 13X as selective
adsorbent were carried out at 323 K. This temperature was chosen after a preliminary study and by comparison with previous works already performed, in LSRE, for this separation on this adsorbent. The results obtained with a two-column PSA process using six-step cycle (pressurization, feed, depressurization, blowdown, purge and pressure equalization) were compared with those attained by simulating the behaviour of only one column. The objective of the second part was to study a new PSA cycle to improve the utilization of the kinetic adsorbent in multi-column PSA processes.
This thesis begins, in Chapter 1, with a short description of the work, presenting the relevance and motivation and the objectives.
The climate is changing due the accumulation of greenhouses gases (GHG) in the atmosphere which contributes to the Global Warming. CO2 and CH4 are the major greenhouse
gases from human sources, being the greenhouse warming potential (GWP) of methane 21 times higher than for CO2. In Chapter 2 the major sources of biogas and the technologies to separate it
are presented, with special emphasis for the pressure swing adsorption process.
A brief description of the adsorbents employed in this thesis is given in Chapter 3: zeolite 13X and carbon molecular sieve 3K. The main adsorption equilibrium models, Langmuir, Freundlich, Toth and Multi-Site Langmuir, are also described as well as the diffusion kinetics in the adsorbent particles (molecular diffusion, Knudsen diffusion, Poiseuille flow, micropore diffusion and pore mouth resistance of micropores). The mathematic model of a PSA process is described in Chapter 4. The adsorption equilibrium and kinetics of CO2 and CH4 on zeolite 13X
and CMS-3K are also shown in this Chapter, as well as the configuration of a modified Skarstrom cycle and it performance variables.
Introduction 4
Most of the research work published for biogas separation was performed with kinetic adsorbents and few works were carried out with equilibrium adsorbents, in this case, the zeolite 13X. For this purpose and to improve the biogas separation employing zeolite 13X as adsorbent, in the Chapter 5 several simulations were performed and a Skarstrom modified cycle was studied for one and two column PSA process. The increase of temperature to 323 K was also studied.
PSA processes that employ kinetic adsorbents, with slow diffusion kinetics, lead to a large mass transfer zone (MTZ). For this reason, the effective adsorption loading decreases which results in a low productivity of processes. In Chapter 6 it is proposed an alternative to modify the properties of the bed without changing the properties of the adsorbent. Therefore, a new cycle configuration was proposed to enhance the PSA performance employing this adsorbent type. The carbon molecular sieve 3K was the kinetic adsorbent chosen.
State of the Art 5
2. State of the Art
2.1. Biogas
Methane (CH4), like carbon dioxide (CO2) gas, is a significant contributor to the
accumulation of greenhouse gases (GHG) and consequently for increased global warming (Pritchard, 2004): the greenhouse warming potential (GWP) of methane is 21 times higher than for CO2 (Knaebel and Reynhold, 2002). Principal sources of methane emissions to atmosphere
are: natural gas systems, enteric fermentation, landfills and wastewater treatment plants. Tighter control in methane emissions will have a significant contribution in mitigating anthropogenic emissions. Landfill gas (LFG) and the biogas generated in anaerobic digestion units of wastewater treatment plants (WWTPs) are the main sources of methane emissions in several countries (GHG Data). Considering that this methane can also be used for energy or fuel production, this is a win-win situation for the generation of a bio-fuel. For this reason, it is the bio-fuel with higher tons of CO2 avoided (FBAE).
The use of bio-methane as fuel or its injection in a pipeline for grid distribution, introduces some quality specifications for biogas. Despite of the removal of several contaminants (siloxanes, H2S), the gas should have a very small content of water and carbon dioxide
concentration below 2-3 % (Li et al., 2005). From all these separations, CH4-CO2 is the most
expensive one since normally CO2 content is higher than 25 %. The biogas composition of LFG
depends on the waste composition and aging of the landfill (Shin et al., 2002). The composition of biogas generated in anaerobic digestion units of WWTPs depends on the sludge and the operation conditions of digestion process. Humidity, pH, temperature, and composition, particle size and age of the waste are factors that affect the biogas generation.
After the removal of minor contaminants, carbon dioxide and methane can be separated by physical or chemical scrubbing (Jacobson, 2009; Wellinger, 2009), membrane-based processes (Air Liquide), pressure swing adsorption (PSA) and temperature swing adsorption (TSA) (CarboTech; Grande and Rodrigues, 2007a, b; Knaebel and Reynhold, 2002; Xebec).
2.2. Pressure Swing Adsorption (PSA)
PSA is a well known separation technique (Ruthven et al., 1994; Sircar, 2002; Voss, 2005), in practice for at least 60 years (Skarstrom, 1960). A PSA process is cyclic in nature: after the adsorbent is saturated with the most adsorbed specie, a suitable protocol for regeneration should
State of the Art 6
be designed. In this gas separation process, one or more components of a gas mixture are preferentially adsorbed in a solid surface while the other(s) are not preferentially adsorbed. In a multicolumn process, the gas mixture is fed into the first adsorption column where it is purified and during this time the remaining columns were undergo regeneration. For that reason, there is always an adsorber column actively cleaning gas and therefore, the process is continuous. Generally, the regeneration is achieved by reducing the total pressure of system and introducing a gas at same pressure (PSA) or by increasing the temperature (TSA). In this separation process, the adsorbent can be used for a long period before the regeneration and as it operates at normal temperature and relatively low pressure, the energy consumption is low.
PSA technology can operate in two distinct modes, depending on the adsorbent employed (Grande and Rodrigues, 2007a; Ruthven et al., 1994; Yang, 1987). Some materials present stronger surface interactions with CO2 adsorbing larger loadings of this gas when compared to
methane. These materials are termed as equilibrium-based adsorbents and some examples are: activated carbon (Davis, et al., 1992; Sircar and Koch, 1986, 1988a), zeolite 13X (Sircar, et al., 1988b), silica gel (Dolan and Mitariten, 2003a)and metal-organic frameworks (Cavenati et al., 2008; Müller et al., 2005; Wang et al., 2002). Other materials have similar adsorption loadings of CO2 and CH4, but their diffusion rates can be controlled by tightening the size of the micropores.
In materials like carbon molecular sieves (Masahiro and Kazuo, 1995), clinoptilolites (Jayaraman et al., 2004; Jayaraman et al., 2005; Seery, 1998), titanosilicates (Anson et al., 2009; Dolan and Mitariten, 2003b), DDR zeolites (Fujita et al., 2006) and SAPO-34 (Li et al., 2006) where kinetic separation takes place since much more CO2 is adsorbed than CH4 per unit time.
The cycle configuration of a PSA process depends on the specific application. Different steps should be employed if the process intends to purify the less adsorbed compounds or if the target is to concentrate the most adsorbed one. The design of PSA depends strongly on the properties of the adsorbent: adsorption loading and diffusion, thermal effects, etc. When the kinetic diameter of the gas molecules is very close it is possible to select materials such that one molecule is larger than the pore diameter and is thus not adsorbed. This size-exclusion or molecular-gate concept is already applied for different separations: oxygen-nitrogen, carbon dioxide-methane, methane-nitrogen, etc (Cavenati et al., 2009; Farooq et al., 2002; Kuznicki et al., 1999, 2000; Mitariten, 2001, 2004).
Fundamental Concepts of Adsorption 7
3. Fundamental Concepts of Adsorption
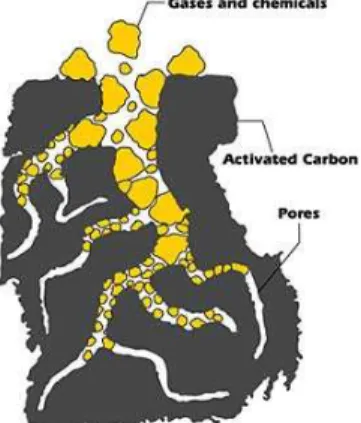
Adsorption is the phenomenon that occurs when a molecule of a fluid (gas or liquid) is in contact with the surface of a solid; the fluid is called adsorbate and the surface is the adsorbent. The adsorbate molecules will form bonds with the adsorbent surface and become attached. So, the adsorption results of the unsaturated forces that act in the discontinuities existing in the adsorbent structure. This phenomenon, illustrated in Figure 3.1, is spontaneous, for this reason, we have always heat release. Its amount depends on the specific adsorbate-adsorbent system and on operating conditions.
Figure 3.1. Activated Carbon adsorbs gases and chemicals. (Online Chemistry Portal, 2011)
The adsorption may be classified according to the adsorbate–adsorbent interactions, the chemical adsorption (chemisorption) and the physical adsorption (physisorption). The different kinds of adsorption bonds have different energy.
3.1. The Adsorbent
A good adsorbent is a solid that have good adsorptive capacity and good adsorption kinetics so, the solid must have a higher surface area or a micropore volume and must have a large pore network, that is, a high porosity (Do, 1998).
The range of pore size according to the classification recommended by IUPAC is: micropores (d < 2 nm), mesopores (2 < d < 50 nm) and macropores (d > 50 nm).
Alumina, silica gel, activated carbon and zeolite are the most common adsorbents; they are used in diverse processes. The most important characteristic of an adsorbent is its high porosity (Yang, 1987). So, physical characterization is generally more important than chemical characterization.
There are standard techniques to characterize porous material, for example, mercury porosimetry, liquid nitrogen adsorption, x-ray diffraction. If we have some of the mentioned
Fundamental Concepts of Adsorption 8
techniques we can measure the surface area, the total pore volume, the pore size distribution and crystal structure, for example. The surface area of an adsorbent can be determined using the adsorption data for nitrogen at liquid temperature, 77 K. The Brunaur-Emmet-Teller equation is used to calculate the amount of N2 for monolayer coverage. The total pore volume is usually
determined by helium and mercury densities while the pore size distribution is measured by mercury porosimetry for pores larger than 60 Å and by N2 desorption (or adsorption) for pores in
the range larger than 5 Å. The crystal structure is determined by x-ray diffraction.
3.1.1. Zeolites
Zeolites are crystalline materials that belong to the class of aluminosilicates, which may be constituted by alkali or alkali earth elements, such as sodium, potassium and calcium. The stoichiometric formula is represented by: Mx/n[(AlO2)x(SiO2)y]zH2O where x and y are integers,
n is the valence of cation M and z is the number of water molecules in each unit cells. The tetrahedra of silicon and aluminium, SiO4 and AlO4, are the primary structural units. These
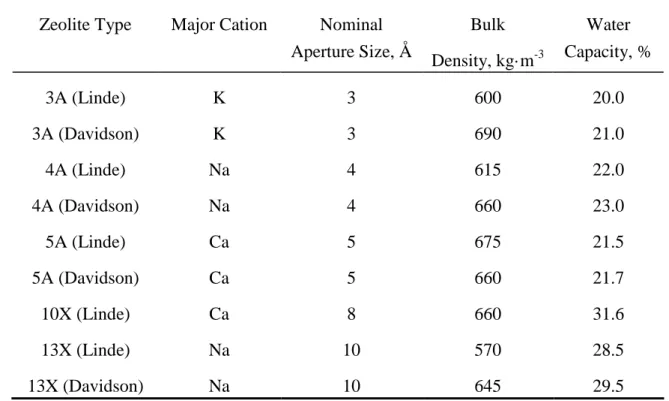
atoms are connected through shared oxygen atoms raising an open crystal lattice. This crystalline framework contains cavities and channels into which the molecules can penetrate. About 150 types of zeolites have been synthesized, they are designated by letters. The main characteristic of these synthetic zeolite adsorbents are described in Table 3.1.
Table 3.1. Characteristic of major synthetic zeolite adsorbents. (Yang, 1987).
Zeolite Type Major Cation Nominal Aperture Size, Å Bulk Density, kg·m-3 Water Capacity, % 3A (Linde) K 3 600 20.0 3A (Davidson) K 3 690 21.0 4A (Linde) Na 4 615 22.0 4A (Davidson) Na 4 660 23.0 5A (Linde) Ca 5 675 21.5 5A (Davidson) Ca 5 660 21.7 10X (Linde) Ca 8 660 31.6 13X (Linde) Na 10 570 28.5 13X (Davidson) Na 10 645 29.5
Fundamental Concepts of Adsorption 9
The zeolite structure may be a set of cubes, hexagonal prisms, octahedra and truncated octahedra. The truncated octahedron is the structure unit of zeolites A and X and the zeolite type X has a larger pore than type A.
In this adsorbent the gas separation is based on the different adsorption equilibrium of the gases.
3.1.2. Carbon Molecular Sieves (CMS)
Carbon molecular sieves are a modified type of carbon activated with a more uniform pore size distribution and a pore size of several angstroms (Jüntgen, et al., 1981), the effective micropore diameters of CMS may range from 4 to 9 angstroms (Ruthven, 1984). These materials have a high internal surface area/equilibrium capacity and a partial/total molecular sieving capability (Srinivasan et al., 1995). The synthesis of these carbons has as a final objective to obtain a material with a homogeneous pore size distribution. The carbonization of the coal and the coating of coke on the coal char are the basics procedures in their synthesis, the pyrolysis and activation steps are determinant in the micropore size (Jüntgen et al., 1981). The carbon molecular sieves are bidisperse adsorbents featuring micropores smaller than 10 Å and macropores between 0.1-1 µm (Schröter, 1993; Grande et al., 2003) however, the controlling resistance is almost located in the micropores (Qinglin et al., 2003).The gas separation in this type of adsorbent is based on the different adsorption kinetics of the gases although have similar adsorption loadings.
3.2. Models for the Description of the Gas Adsorption Equilibrium
The contact between an adsorbent and an adsorbate, at a given temperature and pressure, leads to an equilibrium relation between the adsorbed amount and the adsorbate concentration in the fluid phase. The representation of these data is termed adsorption isotherms.
3.2.1. The Langmuir Model
This model is based on a kinetic point of view, that equals the rate of adsorption to the rate of desorption from the surface at equilibrium (Do, 1998). This model assumes that:
- the surface is homogeneous, that is, the adsorption energy is constant in all sites;
- the adsorption in surface is localized, that is, adsorbed atoms or molecules are adsorbed; - each site can accommodate only one molecule or atom;
Fundamental Concepts of Adsorption 10
- there is no lateral interaction between adsorbed molecules. The Langmuir isotherm is expressed by the equation 3.1.
P K 1 P K q q i i max i, i + = ∗ (3.1)
where, qi∗ is the amount of the adsorbed phase of component i, qi,max is the maximum adsorbed amount of component i, corresponding to a complete monolayer coverage, Ki is the affinity
constant or Langmuir constant and P is the gas pressure. The Langmuir model can take the following two forms if:
• the pressure is very low → 1 >> KiP → the isotherm reduces to the Henry Law:
P K q q i max i, i = ∗
, that is, the amount adsorbed increases linearly with the pressure.
• the pressure is relatively high → KiP >> 1 → the amount adsorbed reaches the saturation
capacity, all sites are occupied ( is called monolayer coverage,
max i, i q q∗ =1).
3.2.2. The Freundlich Model
This model considers the adsorption on nonuniforms surfaces, the adsorbate can occupies n sites. The resulting isotherm is expressed by:
i i 1/n i 1/n i max i, i P) K 1 P) (K q q ( + = ∗ (3.2)
where q∗i is the amount of the adsorbed phase of component i, qi,max is the maximum adsorbed amount of component i and ni represents the adsorbent heterogeneity.
The Freundlich equation does not have a proper Henry law behaviour at low pressure and when this is sufficiently high, it does not have a finite limit (Do, 1998). According to this isotherm, the amount adsorbed will increase indefinitely with the pressure.
3.2.3. The Toth Model
The Toth equation (Toth, 1971) is an empirical isotherm equation but does not have the same limitations like the others empirical equations as Freundlich and Sips equations. The Sips isotherm has the same problem at low pressure and does not have a proper Henry law behavior. This equation describes many systems with sub-monolayer coverage:
Fundamental Concepts of Adsorption 11 i 1/n i n P) i (K 1 P i K q q i i,max + = ∗ (3.3)
where qi∗and qi,max are the absolute amount adsorbed and the maximum amount adsorbed of
component i, P is the gas pressure and niis the heterogeneity parameter.
The adsorption constant (Ki) is assumed to have an exponential dependence of temperature
according to: ∆ − = T R H K K g i i i exp 0 (3.4) T B A ni = i + i (3.5)
where Ki0 is the infinite adsorption constant, ∆Hi is the isosteric heat of adsorption at zero
loading, T is the temperature, Rg is the universal gas constant and Ai and Bi are the parameters
relating the thermal variation of the heterogeneity coefficient. The parameters Ki and ni are
specific for adsorbate–adsorbent pairs and the last is less than the unity. This parameter is used to characterize the adsorbent and when it decreases means that the material is more heterogeneous.
3.2.4. The Multi-Site Langmuir or Nitta Model
The multisite Langmuir model represented in Equation (3.6) assumes that a molecule can occupy more than one adsorption site of a homogenous surface.
i a i i i i i i q q Py K q q − = ∗ ∗ max , max , 1 (3.6)
where qi∗ and qi,max are the current and the maximum amount adsorbed of component i for a given pressure P and a constant solid temperature Ts. The exponent ai corresponds to the number
of neighbouring sites that a molecule can occupy. The adsorption constant (Ki) is determined by
the equation 3.4. If we neglect adsorbate-adsorbate interactions, the multicomponent extension of this model can be expressed as:
i a i i i i i i i q q Py K q q − =
∑
∗ ∗ max , max , 1 (3.7)Fundamental Concepts of Adsorption 12
The saturation capacity of each component is imposed by the thermodynamic constraint, aiqi,max
= constant to satisfy a material balance of sites in the adsorbent(Sircar, 1995).
3.3. Adsorption kinetics. Diffusion in Porous Media
The rates of adsorption and desorption in porous adsorbents are generally controlled by transport within the pore network and not by the intrinsic kinetics of sorption at the surface (Ruthven, 1984). Like the bulk gas phase through the pores is generally little, it is possible to consider intraparticle transport as a diffusive process, that is, it is assumed that when a molecule enters into an adsorbent (‘in micropores’), it will only collide with the solid and will not be part of a gas phase; so, it is possible to correlate the kinetic data in terms of diffusivity defined in accordance with Fick’s first equation:
x c -D(c) J ∂ ∂ = (3.8)
where c is the concentration in mol·m-3, D is the diffusion coefficient or diffusivity in m2·s-1, J is the diffusion flux in mol·m-1·s-1 and x is the position in m.
This law relates that the flux goes from regions of high concentration to regions of low concentration. The pore diffusion may occur by several different mechanisms depending on the pore size, the sorbate concentration and other conditions (Ruthven, 1984). In fine micropores, like the intracrystalline pores of zeolites, the diffusing molecule never escapes from the force field of the adsorbent surface therefore; this process is often called surface diffusion. Normally, the terms micropore or intracrystalline diffusion are used to describe the transport in micropores, when the diffusing molecule escapes from the surface field (in large pores), the diffusion is called macropore diffusion.
In macropore mass transfer may occur three distinct mechanisms of transport (Ruthven, 1984): molecular diffusion, Knudsen diffusion and Poiseuille flow, which are represented in Figure 3.2.
3.3.1. Molecular Diffusion
It occurs when the resistance to mass transfer is a result of collision between diffusingmolecules. The molecular diffusion will be the dominant transport mechanism when the average distance travelled between molecular collisions is small relative to the pore diameter, which can be seen in Figure 3.2a).
Fundamental Concepts of Adsorption 13
If the transport within the macropores occurs only by molecular diffusion, the pore diffusivity (Dp,i) is given by:
p i m i p, D D
τ
, = (3.9)where Dm,i is the molecular diffusivity and can be estimated from the Chapman-Enskog equation
and τpis the tortuosity factor.
For a binary gas mixture the Chapman-Enskog equation is used to determine the molecular diffusivity (Dm,i) expressed in cm2·s-1:
12 2 12 2 / 1 2 1 2 / 3 1 1 0018583 . 0 Ω + =
σ
P M M T Dm,i (3.10)where M1 and M2 are the molecular weights, P is the total pressure in atmospheres and Ω is the
collision integral and function of ε/kT , where k is the Boltzmann constant. The Lennard-Jones force constant,
ε
is given by:2 1
ε
ε
ε
= (3.11)The collision diameter from the Lennard-Jones potential, σ12, expressed in Angstroms is
calculated by: ) ( 2 1 2 1 σ σ σ12 = + (3.12)
3.3.2. Knudsen Diffusion
This transport mechanism occurs when mean free path is greater than the pore diameter consequently, the collisions between molecule and pore wall is the main diffusional resistance, and this mechanism is represented in Figure 3.2b).
The Knudsen diffusivity (Dk,i), expressed in cm2·s-1, can be estimated from the equation: 2 / 1 9700 = w p i K, M T r D (3.13)
where Mw is the molecular weight, rpis the mean pore radius in cm and T is the temperature in
Fundamental Concepts of Adsorption 14
Figure 3.2. Mechanisms of diffusion on macropore: a) Molecular Diffusion; b) Knudsen Diffusion; c) Poiseuille Diffusion. (Ruthven, 1996)
3.3.3. Poiseuille Flow
This mechanism is present when there is a difference in total pressure across a particle, and consequently there will be a direct contribution to the adsorption flux from forced laminar flow through the macropores, as can be seen in Figure 3.2c).
From Poiseuille’s equation it may be shown that the equivalent diffusivity, expressed in cm2·s-1, is given by: 8µ Pr D 2 p = (3.14)
where P is the total pressure in dynes·cm-2, rpis the mean pore radius in cm and µ is the viscosity
in poise.
3.3.4. Micropore diffusion and Pore-mouth resistance in micropores
The diffusion of gases into the adsorbent particles until its adsorption in the surface involves different transfer mechanisms: the gas has to diffuse through distribution channels (macropores) and then diffuse inside the micropores before they reach their adsorption location.
Normally, the diffusion within zeolites crystals can be simplified to a Linear Driving Force (LDF) model. For the case of crystal diffusion, the micropore LDF constant (kµi,) assumes the same exponential dependence of temperature(Ruthven, 1984) as micropore diffusion:
− = T R Ea K K g i i u i u exp 0 , , (3.15)
Fundamental Concepts of Adsorption 15
For the case of carbon molecular sieves, also bidisperse adsorbents, the micropores and macropores resistances are distinct. However, in the mostly gas separations the controlling resistance is located in the micropores (Farooq et al., 2002). Three types of diffusion mechanism in micropores may be encountered: distributed pore diffusional resistance (Chagger et al., 1995; Chen et al., 1994; Liu and Ruthven, 1996; Rutherford and Do, 2000; Ruthven, 1992; Ruthven et al., 1986; Van Den Broeke and Krishna, 1995), barrier resistance confined at the pore mouth (Dominguez et al., 1988; Fitch et al., 1994; LaCava et al., 1989; Liu and Ruthven, 1996; Reid and Thomas, 1999, 2001; Rynders et al., 1997; Srinivasan et al., 1995), or a dual resistance model (Liu and Ruthven, 1996; Loughlin et al., 1993; Reid and Thomas, 1999, 2001) which is a combination of micropore resistance and surface barrier at the mouth of the micropores. The micropore LDF constant is composed by the micropore diffusion resistance and the surface barrier at the mouth of the micropores and can be described by (Cavenati et al., 2005) the equation 3.16: ∞ + = i u c i b i u D r K K , 2 , , 15 1 1 (3.16)
The temperature dependence of micropore diffusion and surface barrier at the mouth of the micropores can be described by the following equations:
− = ∞ T R Ea D D g i i u i u exp 0 , , (3.17) − = T R Eb K K g i i b i b exp 0 , , (3.18) where 0 ,i u
K is the LDF constant for infinite temperature, Du∞,i is the micropore diffusivity of
component i at infinite dilution, Du0,idiffusivity of component i at infinite temperature,Eai is the
energy of activation of component i, Ebi is the activation energy for micropore barrier resistance
of component i, Kb,i is the barrier mass transfer coefficient of component i and Kb0,i is the
Modelling of Pressure Swing Adsorption 16
4. Modelling of Pressure Swing Adsorption
A classical Pressure Swing Adsorption (PSA) unit is composed by several columns operating in parallel filled with one selective adsorbent. However, the configuration of PSA units is so flexible that we can find units with only one column (Siettos et al., 2003) or with multiple adsorbents per column (Cavenati et al., 2006a; Grande and Rodrigues, 2007b; Lü et al. 2003, 2004; Ribeiro et al., 2008).
When a PSA is designed for an application, the first difficulty to overcome is the selection of the adsorbent. As mentioned before, kinetic adsorbents are normally selected for bulk separation of CO2.Nonetheless, it was mentioned by several researchers that zeolites adsorbents
can also provide an alternative. In Chapter 5, zeolite 13X was selected since under certain operating conditions, faster regeneration can be carried out. In Chapter 6 and taking into account the main chapter objective, to find a new cycle to enhance the kinetic adsorbents performance, the carbon molecular sieve 3K was the adsorbent chosen.
4.1. Adsorption equilibrium and kinetics
The basic information to simulate and design a PSA process is the pure gas adsorption equilibrium and diffusion kinetics in the adsorbent. While the adsorption equilibrium of CO2 and
CH4 on zeolite 13X (CECA, France) was determined in a magnetic suspension balance
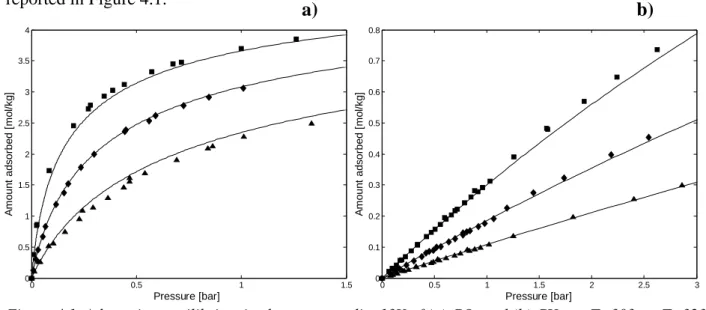
(Rubotherm, Germany), the data of pure gases on CMS-3K (Takeda, Japan) was already available (Cavenati et al., 2005). The adsorption equilibrium of CO2 and CH4 on zeolite 13X is
reported in Figure 4.1.
Figure 4.1. Adsorption equilibrium isotherms on zeolite 13X of (a) CO2 and (b) CH4. ■, T=303; ♦, T=323
and ▲, T=348 K.
a)
b)
0 0.5 1 1.5 0 0.5 1 1.5 2 2.5 3 3.5 4 Pressure [bar] A m o u n t a d s o rb e d [ m o l/ k g ] 0 0.5 1 1.5 2 2.5 3 0 0.1 0.2 0.3 0.4 0.5 0.6 0.7 0.8 Pressure [bar] A m o u n t a d s o rb e d [ m o l/ k g ]Modelling of Pressure Swing Adsorption 17
Solid lines in Figure 4.1 correspond to the fitting of the multisite Langmuir model (Nitta et al., 1984), which is described in chapter 3.2.4.
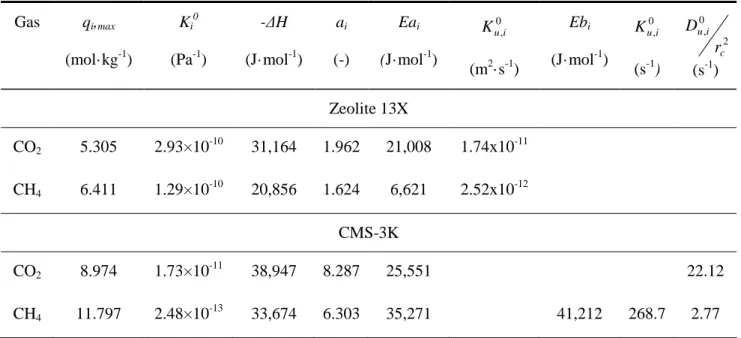
The parameters obtained from fitting of pure adsorption equilibrium are shown in Table 4.1, as well as the adsorption equilibrium of CO2 and CH4 on CMS-3K. The kinetic parameters of
pure gases on zeolite 13X and CMS-3K are also presented in this table.
Table 4.1. Adsorption equilibrium and kinetic parameters of CH4 and CO2 adsorption on zeolite 13X
(Santos et al, 2011) and CMS-3K. (Cavenati et al, 2005)
Gas qi,max (mol·kg-1) Ki 0 (Pa-1) -∆H (J·mol-1) ai (-) Eai (J·mol-1) 0 ,i u K (m2·s-1) Ebi (J·mol-1) 0 ,i u K (s-1) 2 0 , c i u r D (s-1) Zeolite 13X CO2 5.305 2.93×10 -10 31,164 1.962 21,008 1.74x10⁻¹¹ CH4 6.411 1.29×10 -10 20,856 1.624 6,621 2.52x10⁻¹² CMS-3K CO2 8.974 1.73×10 -11 38,947 8.287 25,551 22.12 CH4 11.797 2.48×10 -13 33,674 6.303 35,271 41,212 268.7 2.77
4.2. Mathematical modelling of fixed-bed column
The mathematical model of a column filled with adsorbent is described by a set of partial differential equations including mass, energy and momentum balances. For some specific cases, these equations can be simplified (constant velocity or isothermal behaviour), however for bulk gas-phase separations, all these equations are normally required(Ruthven, 1994; Yang, 1987). In this work, the mathematical model used to describe the fixed-bed adsorption column is based on the following assumptions (Da Silva et al., 1999; Da Silva and Rodrigues, 2001):
• The gas phase behaves as an ideal gas;
• Mass, heat and momentum variations in the radial direction are negligible;
• The mass transfer rate is represented by a bi-linear driving force (bi-LDF) model;
Modelling of Pressure Swing Adsorption 18
• The pressure drop in the column is described by Ergun Equation;
• The bed porosity is considered constant along the bed;
• The process runs under adiabatic operation;
• Heat conduction through the column wall can be neglected.
The assumption of negligible influence of the heat conduction through the column wall is based in the slow dynamics of the heat conduction through the column wall when compared to the dynamics of the mass balance in the column.
The mathematical model proposed (Da Silva et al., 1999; Da Silva and Rodrigues, 2001) was validated against experimental data of breakthrough curves and single-column PSA separation of CH4-CO2 using zeolite 13X (Cavenati et al., 2005).
The component mass balance for the gas phase in the adsorption column is given by:
) ( ) 5 / 1 ( ) 1 ( , , 0 i pi i i f p c i c i i T ax c C C Bi k a t C ) C (u z ) z y C D (ε z + − − + ∂ ∂ = ∂ ∂ − ∂ ∂ ∂ ∂ ε ε (4.1)
where CT is the total gas-phase concentration, Ci is the gas-phase concentration of component i, Dax, is the axial dispersion coefficient, u0 is the superficial velocity, εc is the column porosity, kf,i
is the film mass-transfer resistance for component i, Cp,i is the averaged concentration of
component i in the macropores of the adsorbent and ap is the extrudate specific area.
In this equation the Biot Number of component i is defined as:
i p p p i f i D R k Bi , 2 , ε = (4.2)
where Rp is the extrudate radius, Dp,i is the pore diffusivity of component i and εp is the pellet
porosity.
When the LDF approximation is used to describe mass transfer rate within the large pores of the matrix, the mass balance for extrudate is given by:
p p i i p i i p i p i p t q C C Bi R D t C ε ρ ∂ ∂ − − + = ∂ ∂ ) ( ) / 5 1 ( 1 15 , 2 , , (4.3)
where ρp is the particle density, and qi is the extrudate-averaged adsorbed-phase concentration
of component i. The pore diffusion coefficient, Dp,i was estimated assuming contribution of
molecular and Knudsen diffusion with a tortuosity factor of 2.0(Da Silva et al., 1999; Da Silva and Rodrigues, 2001).
Modelling of Pressure Swing Adsorption 19
The mass transfer rate in micropores is also described by a LDF approximation given by:
) ( ) ( 15 , 2 , i i i u i i c i c i q q K q q r D t q − = − = ∂ ∂ ∗ ∗ (4.4)
where Dc,i is the crystal diffusivity of component i, rc is the crystal radius, and qi∗ is the
gas-phase concentration of component i in equilibrium with the gas concentration within the micropores, Cp,i .
The superficial velocity is related to the total pressure gradient by Ergun Equation:
0 0 3 0 3 2 2 1.75(1 ) ) 1 ( 150 u u d u d z P c p g c c p c ε ρ ε ε ε µ − + − = ∂ ∂ − (4.5)
where P is the total pressure, µ is the gas viscosity, dp is the particle diameter, and ρg is the gas
density.
To take into account the energy transfer, three different balances were employed: gas, solid and column wall. The energy balance for the gas phase is expressed by:
) ( 2 ) ( ) 1 ( ~ ~ 0 g w w w s g p f c T g g c g p T g g T c T T R h T T a h t C T R z T C C u z T z t T v C C − − − − − ∂ ∂ + ∂ ∂ − ∂ ∂ ∂ ∂ = ∂ ∂ ε ε λ ε (4.6)
where C~v is the molar constant volumetric specific heat of the gas mixture, Tg is the temperature
of the gas phase, Ts is the solid (extrudate) temperature, Twis the wall temperature, λ is the axial
heat dispersion, Cp
~
is the molar constant pressure specific heat of the gas mixture, hf is the film
heat-transfer coefficient between the gas and solid phases, hw is the film heat-transfer coefficient
between the gas phase and the column wall, Rw is the column radius.
The energy balance in the solid phase is given by:
) ( ) 1 ( t q ) ( ) 1 ( t T ~ ~ ~ ) 1 ( i 1 , , s 1 , 1 , , s g p f c n i i ads b i p s g p c s p p n i v i p n i i v i p p c T T a h H t C T R C C q C C i ads − − + ∂ ∂ ∆ − + ∂ ∂ − = ∂ ∂ + + −
∑
∑
∑
= = = ε ρ ε ε ρ ρ ε ε (4.7) where s pC~ is the constant volumetric specific heat of component i, Cvi
~
is the molar constant volumetric specific heat of component i, Cv,ads,i
~
is the molar constant volumetric specific heat of component i adsorbed, ρb is the bulk density and (-∆Hi) is the isosteric heat of adsorption.
Modelling of Pressure Swing Adsorption 20 ) ( ) ( t T ~ ∞ − − − = ∂ ∂ T T U T T h C w w g w wl w w pw w α α ρ (4.8)
where C~pw is the specific heat of the column wall, U is the global external heat-transfer coefficient, and T∞ is the environment temperature. In this equation, αwis the ratio of the internal
surface area to the volume of the column wall, αwl is the ratio of the logarithmic mean surface
area of the column shell to the volume of the column wall, that are defined by:
) ( w e d e d wi wi + = α (4.9) ) ln( ) ( 1 wl wi wi wi d e d e d + + = α (4.10)
The mass and heat parameters employed in this model were estimated using correlations existing in literature (Bird et al., 2002; Ruthven, 1984; Wakao and Funazkri, 1978; Wasch and Froment, 1972).These correlations are summarized in Appendix A, Table A.1.
4.3. Modified Skarstrom cycle and performance variables
The operation of a PSA unit is not steady but cyclic: prior to massive breakthrough of the most adsorbed compound (CO2), the adsorbent should be regenerated. To handle this
requirement in continuous feed processing, several columns are employed: when one column is in feed mode, the other(s) are in regeneration. The regeneration procedure is also performed in different steps, intending to speed-up the removal of the adsorbed components.
In this work, the PSA cycle employed was a modified Skarstrom cycle (Kim et al., 2006) including pressure equalization. The steps are:
1. Co-current pressurization with feed to condition the pressure to start a new cycle; 2. Co-current feed, where selective removal of CO2 takes place;
3. Co-current pressure equalization depressurization. In this step, the column is partially depressurized and the exiting gas is recycled to other column to save energy;
4. Counter-current blowdown where the pressure is reduced to the lower pressure of the cycle. Removal of CO2 starts in this step;
5. Counter-current purge with product to displace CO2 from the product-end of the column;
6. Counter-current pressure equalization recycling the gas exiting step 3 from other column to partially increases the pressure of the column.
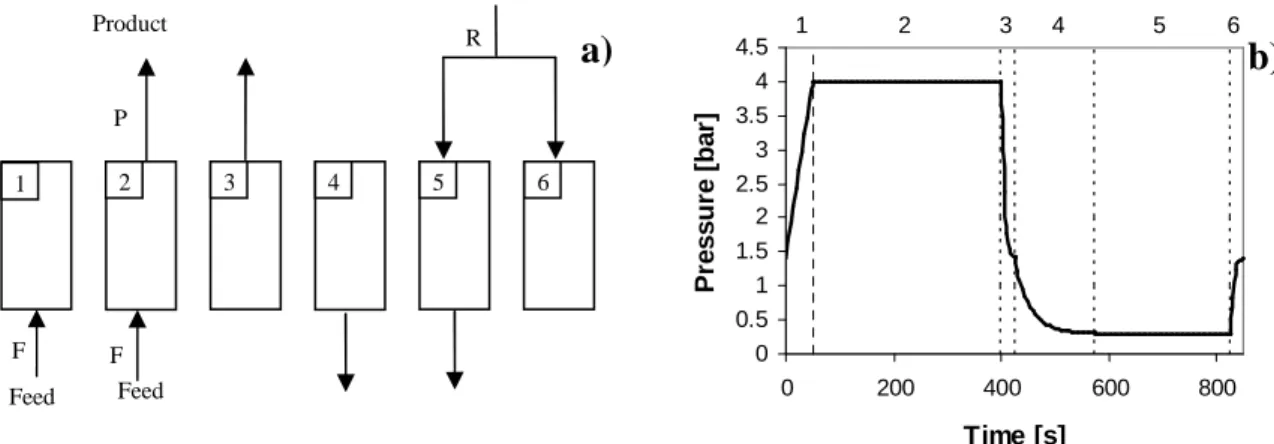
Modelling of Pressure Swing Adsorption 21 0 0.5 1 1.5 2 2.5 3 3.5 4 4.5 0 200 400 600 800 Time [s] P re s s u re [ b a r] 3 2 1 4 5 6
A schematic representation of this cycle for a single column as well as the pressure history over one cycle is shown in Figure 4.2.
Figure 4.2. PSA cycle scheme (a) and pressure history of one CSS cycle (b) for a six steps 1-column PSA simulation. Steps are: 1) co-current feed pressurization, 2) adsorption, 3) co-current pressure equalization depressurization, 4) counter-current blowdown, 5) counter-current purge and 6) counter-current pressure equalization pressurization.
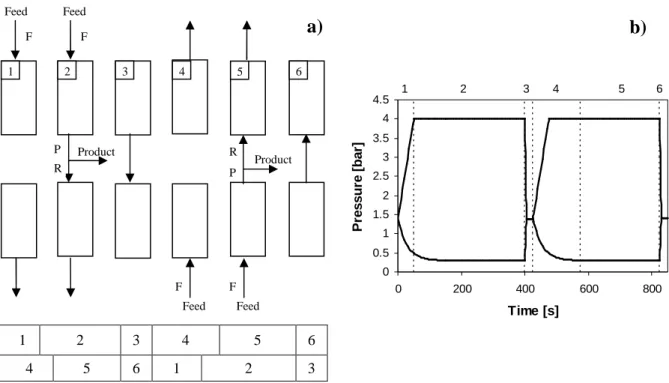
Simplified simulations of PSA cycles are carried out using this 1-column scheme: the inlet streams of steps 5 and 6 (purge and pressure equalization) are not recycled from the feed stream avoiding links between different columns and also saving variables making simulations faster. In 1-column process, the streams used in the purge and pressure equalization steps (5 and 6, respectively) were pure methane. A more realistic description of the system involves the simulation of all the columns comprised in the PSA unit. Note that in the 1-column simulations, the gas exiting step 3 is not considered as product and is also not recycled into any column. The results obtained using this strategy do not have any gas recycled into the column and also let us evaluate the increase of product recovery by using one equalization step. For a two-column PSA unit, the schematic representation is given in Figure 4.3 together with a pressure history. Simulations of multiple columns were performed for H2 production indicating some variations in
the performance (Nikolic et al., 2008, 2009; Ribeiro et al., 2008).
In this particular case, the specification of 98 % purity for CH4 indicate that the recycled
feed stream may contain large amounts of CO2 which may seriously deviate the behaviour of the
one-column simulations from real performance.
Product Feed 6 4 2 3 5 1 Feed F F P R