On: 24 September 2013, At: 12:15 Publisher: Taylor & Francis
Informa Ltd Registered in England and Wales Registered Number: 1072954 Registered office: Mortimer House, 37-41 Mortimer Street, London W1T 3JH, UK
The International Journal of
Aviation Psychology
Publication details, including instructions for authors and subscription information: http://www.tandfonline.com/loi/hiap20
Dynamic Spatial Ability: An
Exploratory Analysis and a
Confirmatory Study
Teresa C. D'Oliveira
Published online: 13 Nov 2009.
To cite this article: Teresa C. D'Oliveira (2004) Dynamic Spatial Ability: An Exploratory
Analysis and a Confirmatory Study, The International Journal of Aviation Psychology, 14:1, 19-38, DOI: 10.1207/s15327108ijap1401_2
To link to this article: http://dx.doi.org/10.1207/s15327108ijap1401_2
PLEASE SCROLL DOWN FOR ARTICLE
Taylor & Francis makes every effort to ensure the accuracy of all the information (the “Content”) contained in the publications on our platform. However, Taylor & Francis, our agents, and our licensors make no
representations or warranties whatsoever as to the accuracy, completeness, or suitability for any purpose of the Content. Any opinions and views
expressed in this publication are the opinions and views of the authors, and are not the views of or endorsed by Taylor & Francis. The accuracy of the Content should not be relied upon and should be independently verified with primary sources of information. Taylor and Francis shall not be liable for any losses, actions, claims, proceedings, demands, costs, expenses, damages, and other liabilities whatsoever or howsoever caused arising directly or indirectly in connection with, in relation to or arising out of the use of the Content.
This article may be used for research, teaching, and private study purposes. Any substantial or systematic reproduction, redistribution, reselling, loan,
sub-licensing, systematic supply, or distribution in any form to anyone is expressly forbidden. Terms & Conditions of access and use can be found at http://www.tandfonline.com/page/terms-and-conditions
Dynamic Spatial Ability: An Exploratory
Analysis and a Confirmatory Study
Teresa C. D’Oliveira
Instituto Superior de Psicologia Aplicada Lisbon, Portugal
Spatial ability is included in nearly every multiple aptitude battery. However, it has been defined and evaluated in such a variety of ways that it is difficult to be precise about the meaning of the concept. A first study addresses the spatial literature, con-siders several measures, and empirically explores the dimensionality of the spatial domain. Nine spatial ability tests and 1 computer- administered measure were ad-ministered to a total of 104 volunteers. Results from the exploratory factor analysis identified 3 main factors: visualization, spatial relations, and dynamic spatial ability. A second study was conducted to cross-validate this factor structure. A total of 141 participants were involved in this study. Participants were recruited from profes-sional training domains in which spatial ability has been considered important for successful performance: air traffic control, piloting, civil engineering, and architec-ture. Cross-validation was obtained through a confirmatory factor analysis (CFA). In general, both empirical studies confirm the existence of dynamic spatial ability as a distinct dimension within the spatial domain.
Spatial ability is included in nearly every multiple aptitude battery (Anastasi, 1988). Such consistency clearly contrasts with the contradictions in the spatial do-main literature. Four do-main areas have been identified in which conflicting perspec-tives have been proposed.
1. Definitions of spatial ability. Spatial abilities and skills have been defined in a variety of ways. Some abilities have similar descriptions, but different denomina-tions (e.g., mental rotation of Dror, Kosslyn, & Waag [1993] and spatial reladenomina-tions of Boer [1991]), whereas others with identical terms have different definitions (e.g., spatial visualization in Isaac [1995] and in McGee [1979]).
Requests for reprints should be sent to Teresa C. D’Oliveira, ISPA, Rua Jardim do Tabaco, 34, 1149-041 Lisbon, Portugal. E-mail: [email protected]
2. Number of abilities. The number of abilities that have been identified in the spatial domain varies considerably and ranges from 2 (e.g., McGee, 1979) to 10 (e.g., Lohman, 1979).
3. Factor names. Factor names are also a source of controversies in the spatial literature, as they seem to vary across authors and even within work of the same au-thor (e.g., Lohman, 1988).
4. Tests used to measure each factor. The tests that have been used to measure or evaluate spatial abilities often give rise to disputes as Lohman (1979) and Eliot and Smith (1983) suggested. There is quite a variety of spatial ability tests and con-fusion exists regarding their names and content.
Subtle variations in test format and administration procedures may also be re-sponsible for inconsistency of results. Eliot and Hauptman (1981) claimed that the differences in the methods and measures used to assess spatial ability clearly con-tributed to the increased ambiguity of the term.
A detailed description of the historic evolution of how spatial abilities have been studied, the tests used, and the factors identified can be found elsewhere (e.g., Eliot & Smith, 1983; Michael, Guilford, Fruchter, & Zimmerman, 1957; Smith, 1964). In general the literature points to the existence of three spatial factors: visu-alization, orientation, and spatial relations.
Visualization involves the ability to mentally manipulate, rotate, twist, or invert a pictorially presented two- or three-dimensional stimulus (McGee, 1979). Ac-cording to Lohman (1979), tests that load on this factor are characterized by their stimuli complexity (e.g., Differential Aptitude Tests [DAT] Surface Development test). Orientation involves the comprehension of the arrangement of elements within a visual stimulus pattern and the aptitude to remain unconfused by the changing orientation in which a spatial configuration may be presented (McGee, 1979). Lohman (1988) claimed that this factor may be difficult to separate from the visualization factor. Spatial relations refers to the ability to solve simple rotation problems or to identify reflected versions of the target (e.g., Primary Mental Abil-ities [PMA] Space test). In contrast to the visualization factor, tests that load on this factor are characterized by their stimuli simplicity.
In the late 1980s and the beginning of the 1990s, Pellegrino and Hunt (1989, 1991) claimed that the aforementioned spatial factors are all characterized by having static stimuli and therefore should be grouped in a specific domain: the static spatial domain. In contrast, a distinct area in the spatial domain should be considered, the dynamic spatial domain, where the ability to reason about movement is included.
Dynamic spatial ability refers to the ability to deal with moving elements and relative
motion. Such ability seems to be separate from those assessed by conventional spa-tial ability tests where the nonexistence of moving elements constitutes a basic limi-tation (Hunt, Pellegrino, Frick, Farr, & Alderton, 1988). Two tasks are considered markers of this ability: the relative arrival time and intercept judgment tasks. The rel-20 D’OLIVEIRA
ative arrival time task requires individuals to indicate which of two moving objects will first arrive at a given target, and the intercept task requires judgments about the meeting of two objects (Law, Pellegrino, & Hunt, 1993).
The controversial nature of the spatial domain is conducive to the development of an exploratory study whenever one is interested in spatial measures. Only after such analysis will it be possible to establish a link with the literature and also be confident about the tests administered. The matter becomes even more important when one considers that the majority of spatial ability tests are in English and the research on the domain has been conducted in English-speaking countries. These circumstances make such exploratory research even more necessary when the tar-get population of the study is non-English speaking. Study 1 was developed to ad-dress these issues.
STUDY 1 Method
Participants. A total of 104 volunteers were recruited as they were applying to a Portuguese university. As the objective of this study was to explore the spatial factors being tapped and the tests administered, participants were members of the general population. Volunteers were paid 5 euros for their participation. Sample composition is presented in Table 1.
Assessment instruments. A total of 10 tests of spatial ability were used: 9 were paper-and-pencil tests and 1 was a computer-administered measure. Table 2 presents the list and order of the tests administered.1Tests were administered in
group sessions with a duration of approximately 2 hr.
Several concerns were involved in the selection of the paper-and-pencil tests. First, it was important to have a great diversity of tests, as the use of certain tests is related with the identification of specific spatial abilities. Second, as the popula-tion targeted by this study was the Portuguese general populapopula-tion, another concern underlying this selection procedure was that these tests should be already in Portu-guese and in use by PortuPortu-guese organizations. This latter concern resulted in a very limited choice of tests.
Dynamic spatial tests are still experimental and were mainly developed for Pellegrino and Hunt’s (1989, 1991) studies. Two types of tasks are considered markers in the domain of dynamic spatial ability: relative arrival time and intercept judgment tasks (Law et al., 1993).
1With the exception of Yela (1967) and Almeida (1992), complete references for all paper-and-pen-cil tests, publishers, and commercial availability can be found in Eliot and Smith (1983).
The test used in this study is representative of the first marker (i.e., relative ar-rival time judgment). Participants observed a computer-controlled display, con-taining a black and a white object (referred to as targets in the task description). Each object moved horizontally toward its own vertical “wall” line. The objects traveled horizontally across the screen over a period of 4 sec, and then disappeared. The task was to determine which target would arrive first at its respective wall, as-suming that they continued to move at the same speed. Speed discrimination diffi-culty (three levels), path length traveled by the winning object (two levels), and color of the winning object (two levels) were crossed over trials.
Decisions required the observer to judge not only how far each target was from its wall when it disappeared from the screen, but also how fast the objects were traveling relative to each other. Feedback was always provided, including errors and responses longer than 9 sec. Two performance indicators are presented in this task: accuracy and reaction time. A detailed description of the task can be found in Yee, Hunt, and Pellegrino (1991).
Procedure. Volunteers were assigned to a session of tests in the cross-sec-tional design, according to their personal convenience. At the beginning of the ses-22 D’OLIVEIRA
TABLE 1
Sample Composition in Study 1 Age M = 19.22, SD = 1.12
Gender Men =25%, Women = 75%
Play computer games Yes = 79.8%, No = 20.%
TABLE 2
List of Tests Administered and Their Authors
Test Author
MacQuarrie—Copying subtest MacQuarrie (1925) MacQuarrie—Blocks subtest MacQuarrie (1925) MacQuarrie—Pursuit subtest MacQuarrie (1925) PMA—Spatial test Thurstone (1947) Figures Rotation Yela (1967)
DAT—Spatial Relations Bennett, Seashore, & Wesman (1947) Spatial Reasoning Almeida (1992)
GATB 7 Boss, Cardinet, Maire, & Muller (1963)
GATB 12 Boss et al. (1963)
Relative Arrival Time Judgment Yee, Hunt, & Pellegrino (1991)
Note. PMA = Primary Mental Abilities; DAT = Differential Aptitude Tests; GATB = General
Apti-tude Test Battery.
sion some general instructions regarding the testing session and the variety of tests being administered were given. At the end of the session, participants were de-briefed and paid.
Results
Reliability analysis. Table 3 presents means, standard deviations, and ranges by gender for each test administered.
Correlations between measures and reliability results are presented in Table 4. MacQuarrie subtests require another type of analysis (i.e., test–retest) that was not possible to conduct in this study due to the cross-sectional design.
Exploratory factor analysis. An exploratory factor analysis (EFA) was con-ducted to assess factors being evaluated by the spatial measures administered. The use of Kaiser rule pointed to the extraction of three factors explaining a total of 64.4% of variance. Results from the varimax rotation are presented in Table 5.
The rotation method used in this factor analysis, varimax, implies that the re-sulting factors are independent. Such methods are especially recommended when one later intends to use the factor scores in a regression or other prediction tech-nique (Hair, Anderson, & Tatham, 1987). However, it can be argued that as all the
TABLE 3
Means, Standard Deviations by Gender, and Theoretical Minimum and Maximum in Each Test in Study 1
Entire Sample Women Men
Measure M SD M SD M SD Min. Max.
1. Copying 28.04 12.16 25.23 10.11 36.46 14.00 0 80 2. Blocks 7.20 4.04 6.46 3.66 9.42 4.37 0 30 3. Pursuit 22.90 5.33 22.72 5.41 23.46 5.12 0 40 4. PMA 25.86 10.78 24.29 10.66 30.54 9.90 –a 54 5. F. rotation 2.44 .83 5.74 3.30 8.97 4.76 –a 21 6. DAT 46.41 17.88 46.69 11.53 45.58 19.09 –a 42 7. SR 18.14 4.68 17.78 4.69 19.19 4.58 0 30 8. GATB 7 22.44 6.04 22.10 5.87 23.46 6.54 0 48 9. GATB 12 19.51 5.59 19.21 5.22 20.42 6.60 0 40 10. Accuracy 69.57 11.06 68.11 11.35 73.94 8.97 0 96 11. Reaction time 3,301.91 387.64 1,691.03 374.96 1,719.27 430.63 0 4,000
Note. Min. = minimum; Max. = maximum; PMA = Primary Mental Abilities; DAT = Differential
Aptitude Tests; SR = Spatial Reasoning; GATB = General Aptitude Test Battery.
aScores obtained in this test result from the application of a formula, therefore allowing for negative final scores.
24
TABLE 4
Correlation Matrix of Spatial Measures Used in Study 1
Measure 1 2 3 4 5 6 7 8 9 10 11 rxx 1. Copying — .47 .31 .38 .38 .27 .34 .32 .38 .23 –.15 — 2. Blocks — .33 .45 .55 .64 .62 .57 .62 .35 –.04 — 3. Pursuit — .35 .20 .19 .19 .31 .26 .04 –.05 — 4. PMA — .51 .35 .39 .29 .35 .15 –.05 .93 5. F. rotation — .50 .41 .46 .47 .34 –.07 .81 6. DAT — .59 .61 .66 .20 –.07 .95 7. SR — .52 .51 .12 –.06 .82 8. GATB 7 — .63 .10 –.23 .89 9. GATB 12 — .12 –.09 .87 10. Accuracy — .33 .84 11. Reaction time — .98
Note. rxx= Cronbach’s alpha; PMA = Primary Mental Abilities; DAT = Differential Aptitudes Tests; SR = Spatial Reasoning; GATB = General Aptitude Test Battery.
measures used in study are spatial ability measures, an oblique method in which factors are correlated would be more applicable. Such a method is especially perti-nent when the objective of the study is to obtain several meaningful factors or con-structs (Hair et al., 1987).
A second factor analysis was consequently conducted using a promax rotation method. The resulting factor structure obtained was very similar to the one ob-tained with varimax rotation (i.e., the same tests load on the same factors). Such a rotation method also allows studying the correlations between the factors, as pre-sented in Table 6.
Factor scores obtained with the varimax procedure were used to analyze gender differences and the influence of using computer games on spatial test results. Con-cerning the use of computer games, results indicate that no significant differences were found between participants that reported playing and not playing computer games (Wilks’s lambda = .970), F(3, 100) = 1.013, ns. In regard to gender, the tra-ditional difference between men and women was obtained (Wilks’s lambda = .827), F(3, 100) = 6.953, p < .05. However, this result was constrained to Factor 2,
TABLE 5
Varimax Rotated Factor Matrix in Study 1
Measure Factor 1 Factor 2 Factor 3
Copying .275 .680 .039 Blocks .737 .402 .197 Pursuit .060 .750 –.123 PMA .289 .693 .094 F. rotation .539 .448 .246 DAT .865 .090 .064 SR .747 .191 .031 GATB 7 .778 .205 –.177 GATB 12 .801 .201 –.047 Accuracy .178 .188 .807 Reaction time –.146 –.155 .782
Note. PMA = Primary Mental Abilities; DAT = Differential Aptitude Tests; SR = Spatial
Rea-soning; GATB = General Aptitude Test Battery. Italicized values represent significant factor loadings.
TABLE 6
Factor Correlation Matrix (Promax Rotation)
Factor 1 Factor 2 Factor 3
Factor 1 — .570 .176
Factor 2 — .181
Factor 3 —
F(3, 102) = 13.655, p < .05, MSE = .891. Within this factor, only in Copying and
PMA did men perform better than women, F(1, 102) = 19.633, p < .05, and F(1, 102) = 6.922, p < .05, respectively.
Discussion
Results obtained in this study allow several conclusions. First, one should refer to a spatial domain and not a single spatial ability, as the latter construct may introduce confusion. Second, several dimensions or abilities constitute the spatial domain. Practical implications are straightforward. It becomes important to link spatial tests with the dimensions they covered. Choosing a test just because it covers the spatial domain is not enough; it becomes important to clarify the spatial dimension or ability that the test in question covers.
Third, tests administered in this study were linked to three specific spatial abili-ties. The resulting factor structure was invariant when different rotation methods (varimax and promax) were used. The exploratory factor structure presented the same number of factors and equivalent factor loadings, thus showing the presence of a strong factor solution. The promax rotation method also presented an interest-ing result; there is a strong correlation between Factor 1 and Factor 2 (r = .570).
Regarding the factors identified and the tests administered, it was possible to es-tablish a clear link with the literature. Three factors were identified: Two were as-sociated with the paper-and-pencil tests and the remaining dimension was related with the performance measures of the computer-administered test. Factors associ-ated with the traditional measures were identified as static factors (Factors 1 and 2), whereas measures associated with the dynamic spatial ability test cluster in a very specific factor (Factor 3) labeled as the dynamic spatial ability factor.
The two performance measures associated with the dynamic factor are accuracy and reaction time. Interpretation of reaction time results should be conducted with care as higher scores actually indicate worse performance. Therefore a negative correlation exists between these two measures: More accurate results are associ-ated with slower performances. This kind of result has been referred to in the litera-ture as a trade-off between accuracy and reaction time.
Distinction between Factors 1 and 2 resembles previous differentiation pre-sented in the literature (e.g., Lohman’s [1979] review or even Eliot and Smith’s [1983] typology). Factor 1 includes tests in which participants have to deal with three-dimensional stimuli and are required to rotate, reflect, or fold complex fig-ures. Factor 2 includes tests that involve bidimensional stimuli and require simple operations such as copying, pursuit, and bidimensional rotation (left and right). In light of the work presented in the literature, Factor 1 could be labeled as a visual-ization factor (the complex static spatial factor) and Factor 2 could be termed a spa-tial relations factor (the simple static spaspa-tial factor).
26 D’OLIVEIRA
Findings from the EFA promax rotation confirm the distinction between static and dynamic areas in the spatial domain: Visualization and spatial relations pres-ent a strong correlation (.57). The correlations between these factors and the dy-namic factor are considerably smaller (i.e., < .2). In fact, the magnitude of these latter correlations leads one to believe that these factors have in common the fact that they are spatial factors but they are clearly tapping distinct processes. Finally, it should be mentioned that no differences were found regarding the use of com-puter games and results on spatial ability tests.
As presented in the literature, gender differences were also found in this study. However, it was possible to locate such differences in a particular spatial factor: spatial relations. In this factor, only Copying and PMA exhibit the traditional gen-der difference, by which men typically present better results than women. Al-though the results are in line with the literature, it is not possible to generalize them to the spatial domain because the majority of measures used do not present any dif-ferences between men and women.
STUDY 2
Although a strong factor structure was obtained in Study 1, no single study stands alone. When cross-validating the results of an EFA, one is interested in knowing if the number of factors, their interrelations, and the pattern of variable loadings can be reproduced. Such an analysis is usually referred to as CFA (Kline, 1991). When a distinct sample is used for the confirmatory analysis, one is conducting the stron-gest possible cross-validation of a factor structure.
Method
Participants. A total of 141 Portuguese participants were involved in this second study. Volunteers were recruited from four specific professional training areas: air traffic control, piloting, civil engineering, and architecture. These profes-sional areas are presented in the literature as the ones in which spatial literature is most relevant (Carretta, 1987; Carretta, Rodgers, & Hansen, 1993; Hunter & Burke, 1994; McGee, 1979; Pellegrino & Hunt, 1991; Smith, 1964; Wing, 1991). Air traffic controllers (ATCs) and pilot recruits were recruited within a military setting and civil engineering and architecture students were recruited within an ac-ademic setting. Participants’ characteristics are presented in Table 7.
TABLE 7
Participants’ Characteristics in Study 2 Age M = 21.47, SD = 4.03
Gender Men = 85.1%, Women = 14.9%
Assessment instruments and procedure. Spatial measures used in Study 1 were also administered in this second study. The order and procedure previously adopted was also used in this confirmatory analysis.
Results
Reliability analysis. Table 8 presents means and standard deviations for the entire sample and per occupation for each test administered. Correlations between measures and reliability results are presented in Table 9. As CFA is very sensitive to deviations from normality, variable distributions were analyzed. Through the use of histograms, normal probability plots, and the values of skewness and kurtosis it was possible to ascertain that two tests did not comply with the require-ments for a CFA. In particular, it was clear that both PMA and DAT had possible outliers (one in PMA and two in DAT). It was concluded that the procedure recom-mended to obtain a final score in each test was involved in the presence of these outliers. In all three cases, the number of correct answers was inferior to the num-ber of incorrect answers. By replacing these extreme values with the mean value in each test, it was possible to comply with the normality of distributions required by a CFA.
CFA
Model specification. Sepath in Statistica was used to develop the CFA. Analysis started with model specification. Four theoretically viable models were developed, as presented in Figure 1.
Model 1 represents the three spatial factors or latent variables as independent constructs; that is, there are no correlations between the factors. Such a model is equivalent to an orthogonal extraction method in an EFA, as conducted in Study 1.
Model 2 also represents the three factors as independent constructs but includes a correlation between the static factors. Such a correlation is supported by the EFA results (promax rotation) in Study 1, where a correlation of .57 was found between the static factors. At the same time, such a correlation may provide some insight into the dichotomy between static versus dynamic spatial ability proposed in the literature. Model 3 considers the fact that all three factors are spatial ability factors and as such all latent variables may be correlated. This model corresponds to an oblique extraction method in an EFA.
Finally, Model 4 proposes a second-order factor model. Basically this model proposes that the spatial domain can be divided into two second-order factors: a static factor and a dynamic factor. The static factor is then divided in two first-order factors, visualization and spatial relations. Because dynamic spatial ability is asso-ciated with two indicators or manifest variables (i.e., accuracy and reaction time) it 28 D’OLIVEIRA
29
Entire Sample ATCs Pilots Architects Civil Engineers
Measure M SD M SD M SD M SD M SD 1. Copying 42.49 15.54 38.16 13.87 47.03 15.97 37.98 13.46 43.00 15.57 2. Blocks 11.28 4.14 10.38 3.61 13.03 3.69 9.78 4.29 9.50 3.88 3. Pursuit 27.08 6.42 27.08 6.24 27.08 7.41 26.17 5.42 29.71 4.10 4. PMA 36.72 11.71 35.33 9.74 41.95 8.76 32.90 11.29 30.79 11.90 5. F. rotation 10.17 4.53 10.33 4.38 10.90 4.24 8.67 4.71 11.02 5.55 6. DAT 64.97 18.19 65.75 14.23 71.42 15.00 60.68 14.45 57.50 21.17 7. SR 21.04 5.77 21.38 5.66 23.32 4.73 18.05 6.07 19.14 5.14 8. GATB 7 27.45 5.98 26.50 6.33 28.52 5.63 27.27 5.93 24.86 6.55 9. GATB 12 25.41 5.50 23.92 6.51 25.23 4.85 26.34 5.98 24.36 4.70 10. Accuracy 73.31 12.58 82.86 7.03 72.58 12.41 69.54 13.15 71.28 11.88 11. Reaction time 1,454.29 378.40 1,538.44 403.57 1,398.04 368.74 1,561.77 379.85 1,244.38 244.64 N 104 24 62 41 14
Note. ATCs = air traffic controllers; PMA = Primary Mental Abilities; DAT = Differential Aptitude Tests; SR = Spatial Reasoning; GATB = General Apti-tude Test Battery.
30
TABLE 9
Correlation Matrix of Spatial Measures Used in Study 2
Variable 1 2 3 4 5 6 7 8 9 10 11 rxx 1. Copying — .36 .35 .37 .30 .36 .26 .45 .36 .05 –.06 — 2. Blocks — .31 .50 .33 .52 .46 .39 .37 .09 –.08 — 3. Pursuit — .21 .11 .15 .01 .24 .19 .11 –.04 — 4. PMA — .52 .54 .50 .41 .32 .23 –.06 .95 5. F. rotation — .52 .37 .37 .31 .25 –.11 .82 6. DAT — .59 .46 .42 .26 .02 .95 7. SR — .30 .23 .21 –.07 .86 8. GATB 7 — .54 .11 –.01 .89 9. GATB 12 — .10 .00 .86 10. Accuracy — .44 .89 11. Reaction time — .99
Note. rxx= Cronbach’s alpha; PMA = Primary Mental Abilities; DAT = Differential Aptitude Tests; SR = Spatial Reasoning; GATB = General Aptitude Test Battery.
31
was not possible to analyze if dynamic spatial ability could also be considered as a second-order factor; as such, this model was not tested.
Model identification. To allow identification, it was decided to use the stan-dardization procedure available in Sepath, which produces a solution in which all la-tent variables have a variance of 1. This procedure, when combined with the use of correlations, allows one to estimate a completely standardized path model (Steiger, 1994). Next, as the objective of the study was to analyze a pattern of relations, corre-lations were used as input data2(Hair, Anderson, Tatham, & Black, 1995).
Second, as previously mentioned, dynamic spatial ability has two indicators: ac-curacy and reaction time. In other words, there is one factor or latent variable that is associated with only two manifest variables. In these circumstances the literature recommends the imposition of certain constraints to obtain an adequate solution.
The recommendations proposed by Steiger (1994) of constraining both factor loadings to be equal and fixing the latent variable correlations with other con-structs to zero were adopted.
Model 3 is clearly eliminated by such constraints. Model 1 is also eliminated because it is the researcher that actually has to impose the constraints; certain fac-tor correlations have to be constrained to zero. Such a situation occurs regardless of the theoretical background, which might present the specific model as feasible or not. That is, factor correlations are set to zero due to empirical identification first and theoretical reasons second. It is as if the arguments of exploring the associa-tions between the theoretical constructs also became secondary.
Model specification was, as a consequence, simplified using only one model for further analysis. The model used in subsequent analysis was Model 2, the model in which both static factors are correlated. Model 2 actually allows testing Model 1. If the correlation between the static factors is not relevant, as proposed in Model 1, the analysis of Model 2 will reveal it.
Model Evaluation
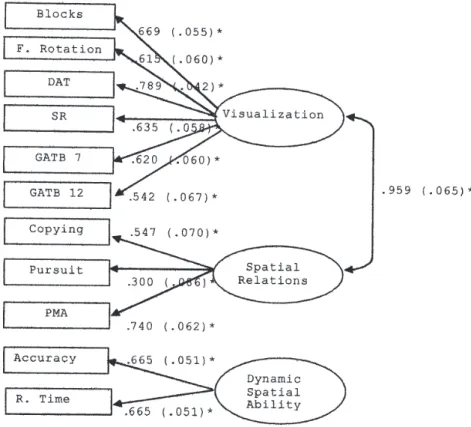
Estimates analysis. Model estimates and their respective standard errors and significance as provided by Sepath are presented in Figure 2.
Residuals analysis. Normalized residuals in each model were also ana-lyzed and only three residuals presented values that were ± 2.58 (p < .01).3
32 D’OLIVEIRA
2Sepath also recommends the use of correlations when conducting a CFA and is the only software program that provides the correct standard errors when that type of data are used as input (e.g., Schumacker & Lomax, 1996).
3Residual matrix is available from the author by request.
Global goodness of fit. Global goodness of fit measures provided by Sepath are presented in Figure 2.
Discussion
The objective of Study 2 was to cross-validate the EFA results obtained in Study 1. By using a sample different than the one used in the exploratory study, attempts were made to conduct the strongest possible cross-validation.
Initial specification of the measurement model led to the proposition of four nested models. Those models are clearly related to the spatial ability literature.
FIGURE 2 Confirmatory factor analysis results (standardized solution with standard errors in parentheses).χ2= 95.55, df = 44 (p = .000); GFI = .885; Adjusted GFI = .827; RMSEA = .096; Population Gamma Index = .932; Adjusted Population Gamma Index = .898; *significant for p < .01.
As presented, requirements of the analysis meant that only Model 2 could actu-ally be tested. This model shared with others the same measurement model but proposed a correlation between the two static spatial factors, an association that was based on the EFA promax rotation conducted in Study 1.
Several indicators of fit were included to avoid dichotomous decisions re-garding model fit (i.e., good vs. bad fit) and as a way of obtaining more de-tailed information regarding the different components of the model. Initially, parameter estimates for the model were evaluated. The first aspect is that, as recommended by Steiger (1994), the parameters estimated exceeded their re-spective standard errors. Significance tests on the parameters estimated were all positive; that is, in the expected direction and of significant magnitude. This result is particularly important when analyzing measurement models as the re-lation between each latent variable and its constructs is evaluated. This analy-sis and its results provided strong and positive indications regarding those rela-tions. Next, a residual analysis was conducted and results revealed that the recommended 5% level of residuals within the threshold value of ± 2.58 (p < .01) was not exceeded. The last form of evaluation of model fit involves the analysis of global goodness-of-fit indexes (GFIs). The first noticeable aspect is the significant chi-square value (p < .05). That is, if an evaluation of model fit only considers this criterion, the model would be rejected, as the chi-square value means that the proposed model does not fit sample data. However, mixed results were presented in the remaining global goodness-of-fit measures. Some measures clearly did not meet the recommended values (e.g., root mean square standardized residual should be less than .05 for fit to be considered good), whereas others present GFIs that Hair et al. (1995) considered to be marginal values.
Finally, model evaluation has to consider all the information obtained in terms of fit assessment. Although the GFIs only revealed acceptable fit, both the estimates analysis and the residuals analysis present very good results. The re-siduals analysis indicates very few discrepancies between the sample data and the proposed model. The estimates analysis denotes that there is a very strong factor structure in that all the proposed relations between latent and manifest variables were significant and in the expected direction. When all this informa-tion is considered, it can be concluded that the model under study has an accept-able fit. Such a conclusion has other implications, as the objectives of this sec-ond study are linked with Study 1. Indeed, this study allowed the conclusion that the factor structure obtained in Study 1 was positively cross-validated. That is, the measures that were used to evaluate the spatial domain are tapping three dif-ferent factors: two static factors and one dynamic factor. It was also important to note that as in Study 1 with the EFA promax rotation’s results, this study also re-vealed a strong correlation between the static factors.
34 D’OLIVEIRA
GENERAL DISCUSSION
This article has considered the spatial literature and its inconsistencies. In an initial phase, several spatial measures were administered to a sample from the general pop-ulation. Next, the resulting factor structure was cross-validated through a CFA in a different sample. Results obtained in this research allow for several conclusions.
First, and as it was revealed in the literature review, one should refer to a spatial domain and not a single spatial ability, as the latter construct could introduce con-fusion. Second, several dimensions or abilities constitute the spatial domain. Prac-tical implications are straightforward. It becomes important to link spatial tests with the dimensions they covered. Choosing a test just because it covers the spatial domain is not enough; it becomes important to clarify the spatial dimension or ability that the test in question covers. Results allow division of the spatial domain into two main areas: static and dynamic. The two static factors obtained (visualiza-tion and spatial rela(visualiza-tions) have a clear link with the conven(visualiza-tional spatial literature. The dynamic spatial dimension identified supports previous work developed by Pellegrino and his colleagues (Hunt et al., 1988; Pellegrino & Hunt, 1989, 1991).
In spite of these results, there are limitations that should be considered. The first issue that can be examined is related to the measures used. As previously mentioned, Portuguese participants were involved in these studies and an effort was made to choose measures that were already in Portuguese and in use by Portuguese organiza-tions. This aspect had direct implications for the paper-and-pencil tests administered in this study; namely, it constrained the variety of tests that could be used.
The nonexistence of dynamic spatial ability tests that are commercially avail-able also introduced limitations in these studies. Although the dynamic test used was a marker of dynamic spatial ability, only one test was used (two measures of performance). The study of dimensionality within the dynamic spatial ability do-main, for example, as suggested by Hunt et al. (1988), was not possible.
The fact that only one dynamic test was used also hindered the analysis of the trade-off between accuracy and reaction time. In static spatial tasks it has been demonstrated that accuracy and reaction time reflect separate sources of individual differences (e.g., Mumaw & Pellegrino, 1984). Is that also the case for dynamic spatial tasks? If so, could one then speak of different components of the dynamic spatial ability? It would also be important to investigate whether this trade-off is a characteristic of this kind of task (i.e., dynamic task) or is specific to the type of task used (i.e., relative arrival time).
In addition, maybe this trade-off can be thought of as a strategy used by partici-pants to solve the task presented to them. Such a perspective would be equally valid for the static measures if one considered different components of performance such as correct answers and errors. With computer-administered static tests, it has been demonstrated that in some tests accuracy and reaction time load on different factors,
whereas for other tests, both measures load on the same factor. It might be possible to make an equal distinction for the dynamic spatial ability domain.
On the other hand, this strategy issue is not that straightforward. If one consid-ers the task presented to participants, considering this trade-off between accuracy and reaction time as a strategy indicator would be somehow unjustified. This indi-cator gives no idea of the initial performance and how such performance evolved throughout the 96 trials. One cannot say, for example, that in general, volunteers sacrificed faster results to have a more accurate performance. If the initial mance is not considered, that kind of conclusion can be erroneous. The perfor-mance just described can result from an improvement in accuracy (with equal mean reaction time) or from a decrement in reaction time (with similar mean accu-racy). A strategy indicator would also need to reflect individual performance and not a general tendency in the sample. That is, individual performance should be characterized first. Only after that can general sample performance be described. These issues point to the importance of developing new dynamic spatial ability measures. Further studies should concentrate efforts toward this purpose and ex-ploring the questions just raised.
Another aspect that should be considered in future studies involves the character-istics of the population being targeted. The majority of spatial ability tests are devel-oped in English-speaking countries and tests are administered to English-speaking people. In these studies the population did not speak English and the instruments were not in English. There is nothing in the literature that supports the idea that a cor-respondence can be established between different languages or even different coun-tries. In fact, there are concerns regarding test format and how subtle modifications in test format might introduce variations in the skills being evaluated.
Exploratory and confirmatory studies such as these may provide evidence that such a parallel can be established. In fact, in spite of the samples’ characteristics it was possible to establish direct and clear links with typologies and distinctions presented in the literature. Such a conclusion is important when one considers the internationalization of psychological measures and an incentive for the develop-ment of cross-cultural analysis, as initially proposed by Eliot and Smith (1983). It should also be mentioned that the tests require no verbal stimuli, as for most spatial tests, only general instructions are translated to different languages. Therefore, modifications in format are kept to a minimum or are nonexistent.4
Finally, the predictive value of the spatial dimensions identified is of interest. Smith (1964) presented the most detailed review on the predictive value of spatial ability. Smith discussed most of the initial studies, some dating to the 1920s, in which it was concluded that spatial ability had a positive contribution to the perfor-mance prediction of several technical training courses, namely mechanics in the 36 D’OLIVEIRA
4I kindly appreciate the suggestion presented by a reviewer regarding this issue.
Royal Air Force, technical courses of engineering drawing, engineering appren-tices, mathematics courses in college, and so on. Today the list of occupations could be enlarged to include others, namely in the aeronautical domain. Carretta (1987) considered that spatial ability is required for a great variety of jobs in the military domain, especially for pilots. A similar case has been put forward by Wing (1991) and Eurocontrol (1996, 2002) concerning ATCs. However, these authors only considered the traditional domain of spatial ability (i.e., static spatial ability). No studies exist regarding the predictive value of dynamic spatial ability. Pellegrino and Hunt (1991) suggested that dynamic spatial ability could be of great practical significance for predicting several visuospatial reasoning activities, such as piloting and air traffic control. Further research in this area may enrich the spa-tial ability literature and emphasize the importance of its study.
ACKNOWLEDGMENTS
Part of the work presented in this article was conducted while I was earning my PhD at Cranfield University, England, under the supervision of Dr. John Harris. I appreciate the collaboration of Earl Hunt, University of Washington, and the mate-rials provided. Research was supported by the Fundação para a Ciência e a Tecnologia, Lisbon, Portugal.
REFERENCES
Almeida, L. S. (1992). Bateria de provas de raciocínio diferencial [Differential reasoning test battery]. Braga, Portugal: Universidade do Minho.
Anastasi, A. (1988). Psychological testing (6th ed.). New York: Macmillan.
Boer, L. C. (1991). Spatial ability and orientation of pilots. In R. Gal & A. D. Mangelsdorff (Eds.),
Handbook of military psychology (pp. 103–114). Chichester, England: Wiley.
Carretta, T. R. (1987). Spatial ability as a predictor of flight training performance (Tech. Rep. No. FHRL–TP–86–70). Brooks Air Force Base, TX: Air Force Human Resources Laboratory, Air Force Systems Command.
Carretta, T. R., Rodgers, M. N., & Hansen, I. (1993). The identification of ability requirements and
se-lection instruments for fighter pilot training (Tech. Rep. No. AL/HR–TP–1993–0016). Brooks Air
Force Base, TX: Air Force Human Resources Laboratory, Air Force Systems Command. Dror, I. E., Kosslyn, S. M., & Waag, W. L. (1993). Visual-spatial abilities of pilots. Journal of Applied
Psychology, 78, 763–773.
Eliot, J., & Hauptman, A. (1981). Different dimensions of spatial ability. Studies in Science Education,
8, 45–66.
Eliot, J., & Smith, I. M. (1983). An international directory of spatial tests. Windsor, England: NFER-Nelson.
Eurocontrol. (1996). Guidelines for selection procedures and tests for ab initio trainee controllers. Brussels, Belgium: Author.
Eurocontrol. (2002). Selection tests, interviews and assessment centres for ab initio trainee controllers:
Guidelines for implementation (Rev. ed.). Brussels, Belgium: Author.
Hair, J. F., Anderson, R. E., & Tatham, R. L. (1987). Multivariate data analysis. New York: Macmillan. Hair, J. F., Anderson, R. E., Tatham, R. L., & Black, W. C. (1995). Multivariate data analysis with
read-ings (4th ed.). Englewood Cliffs, NJ: Prentice Hall.
Hunt, E., Pellegrino, J. W., Frick, R. W., Farr, S. A., & Alderton, D. (1988). The ability to reason about movement in the visual field. Intelligence, 12, 77–100.
Hunter, D. R., & Burke, E. F. (1994). Predicting aircraft pilot-training success: A meta-analysis of pub-lished research. International Journal of Aviation Psychology, 4, 297–313.
Isaac, A. R. (1995). Short-term memory and advanced technology: The use of imagery in air traffic control. In N. Johnston, R. Fuller, & N. McDonald (Eds.), Aviation psychology: Training and
selec-tion (pp. 107–111). Aldershot, England: Avebury Aviaselec-tion.
Kline, R. B. (1991). Latent variable path analysis in clinical research: A beginner’s tour guide. Journal
of Clinical Psychology, 47, 471–484.
Law, D. J., Pellegrino, J. W., & Hunt, E. B. (1993). Comparing the tortoise and the hare: Gender differ-ences and experience in dynamic spatial reasoning. Psychological Science, 4, 35–40.
Lohman, D. F. (1979). Spatial ability: A review and reanalysis of the correlational literature (Tech. Rep. No. 8). Stanford, CA: Stanford University, Aptitude Research Project, School of Education. Lohman, D. F. (1988). Spatial abilities as traits, processes and knowledge. In R. J. Sternberg (Eds.),
Ad-vances in the psychology of human performance (Vol. 4, pp. 181–248). Hillsdale, NJ: Lawrence
Erlbaum Associates, Inc.
McGee, M. G. (1979). Human spatial abilities: Psychometric studies and environmental, genetic, hor-monal and neurological influences. Psychological Bulletin, 86, 889–918.
Michael, M. B., Guilford, J. P., Fruchter, B., & Zimmerman, W. S. (1957). The description of spatial-vi-sualization abilities. Educational and Psychological Measurement, 17, 185–199.
Mumaw, R. J., & Pellegrino, J. W. (1984). Individual differences in complex spatial processing. Journal
of Educational Psychology, 76, 920–939.
Pellegrino, J. W., & Hunt, E. B. (1989). Computer-controlled assessment of static and dynamic spatial reasoning. In R. F. Dillon & J. W. Pellegrino (Eds.), Testing: Theoretical and applied perspectives (pp. 174–198). New York: Praeger.
Pellegrino, J. W., & Hunt, E. B. (1991). Cognitive models for understanding and assessing spatial abili-ties. In H. A. H. Rowe (Ed.), Intelligence: Reconceptualization and measurement (pp. 203–225). Hillsdale, NJ: Lawrence Erlbaum Associates, Inc.
Schumacker, R. E., & Lomax, R. G. (1996). A beginner’s guide to structural equation modeling. Mahwah, NJ: Lawrence Erlbaum Associates, Inc.
Smith, I. M. (1964). Spatial ability: Its educational and social significance. London: University of Lon-don Press.
Steiger, J. H. (1994). Statistica: Structural equation modeling: Technical documentation. In Statsoft, Inc. (Ed.), Statistica for Windows (pp. 1–134). Tulsa, OK: Statsoft, Inc.
Wing, H. (1991). Selecting for air traffic control: The state of the art. In J. A. Wise, V. D. Hopkin, & M. L. Smith (Eds.), Automation and systems issues in air traffic control (NATO ASI Series, Vol. F73, pp. 409–427). Berlin: Springer-Verlag.
Yee, P. L., Hunt, E., & Pellegrino, J. W. (1991). Coordinating cognitive information: Task effects and individual differences in integrating information from several sources. Cognitive Psychology, 23, 615–680.
Yela, M. (1967). Rotação de Figuras Maciças—RFM [Solid figures rotation]. Lisbon, Portugal: Secção de Estudos de Testes da Cegoc.
Manuscript first received December 2001 38 D’OLIVEIRA