M
ASTER
E
CONOMICS
MASTER’S DISSERTATION
E
DUCATION AND AGRICULTURAL PRODUCTION IN
MOZAMBIQUE: THE CASE OF MAIZE
NATACHA RIVI BRUNA
M
ASTER
E
CONOMICS
M
ASTER
’
S
D
ISSERTATION
E
DUCATION AND AGRICULTURAL PRODUCTION IN
MOZAMBIQUE: THE CASE OF MAIZE
NATACHA RIVI BRUNA
S
UPERVISOR:
P
ROF.
D
R.
C
ARLOSP
ESTANAB
ARROSC
O-S
UPERVISOR:
P
ROF.
D
R.
J
OÃOM
ANUELF
ERREIRAD
OSS
ANTOSM
OSCAACKNOWLEDGEMENTS
Having completed my thesis, I would like to give my thanks to my supervisor and co-supervisor, Prof. Dr. Carlos Pestana Barros and Prof. Dr. João Mosca, for the support, availability, criticism and guidance throughout the process of completion of the present work.
Secondly I would like to give my very special thanks to Observatório do Meio Rural, for having granted the scholarship, which made the masters possible. Particularly to Prof. Dr. João Mosca, who provided much help and encouragement along my academic life.
I would also like to express my gratitude to Dr. Margarida Martins for proofreading the work and for the suggestions that improved it. And also to Ayod El Modai Arune for his contributions.
Last but not least, I owe a special thanks to my dear friend Máriam Abbas, who gave me her unconditional support and fellowship which made possible the realization of this work and master.
ABSTRACT
This paper analyses the relationship between the levels of education and of maize production in Mozambique in the period from 1992 to 2013 using a spatial econometric panel data model.
Based on the results obtained, it was possible to identify a positive and statistically significant spatial error effect meaning that spatial autocorrelation exists among provinces relative to maize production, and this autocorrelation is positive. Although there is negative correlation between technical education and maize production in Mozambique, there are evidences that maize production increases can be explained by primary and secondary schooling and by the increment of number of schools. Therefore education should be considered a main issue in agricultural development.
The results follow the findings of other countries concerning the higher impact of primary and secondary schooling comparing to any other level of education. The relevant has policy implications are derived.
Key words: education, agricultural production, maize, Mozambique, spatial
RESUMO
Este Trabalho Final de Mestrado analisa a relação existente entre os níveis de educação e a produção do milho em Moçambique entre 1992 e 2013, tendo como base um modelo de econometria espacial de dados em painel.
Através dos outputs obtidos foi possível identificar um spatial error effect positivo e estatisticamente significativos, o que indica que a existência de auto correlação espacial se verifica entre as diferentes províncias em relação à produção do milho, e esta é considerada positiva. Apesar de se verificar uma relação negativa entre os níveis de educação técnica e a produção do milho em Moçambique, existem evidências de que incrementos na produção do milho podem ser explicados pela obtenção de educação primária e secundária e pelo aumento do número de escolas. Sendo assim, a educação deverá ser considerada uma importante questão para o desenvolvimento da agricultura.
É importante realçar que os resultados obtidos neste estudo consideram-se consistentes com as conclusões alcançadas em outros países relativamente ao facto de que a educação primária e secundária apresentam impactos superiores na produção agrícola em relação a qualquer outro nível educacional.
Palavras-chave: educação, produção agrícola, milho, Moçambique, econometria
INDEX ACKNOWLEDGEMENTS ... I ABSTRACT ... II RESUMO ... III INDEX ... IV LIST OF TABLES ... VI LIST OF FIGURES ... VI ACRONYMS ... VII 1. INTRODUCTION ... 1 2. CONTEXTUAL ANALYSIS ... 5
2.1. Brief description of the Mozambican economy ... 5
2.2. The agricultural sector ... 8
2.3. The education sector ... 10
3. LITERATURE REVIEW ... 12
4. THEORETICAL BACKGROUND ... 21
5. METHODOLOGY ... 23
5.1. Statistical method: spatial econometrics (panel data) ... 23
6. DATA ANALYSIS AND RESULTS ... 26
6.1. Description of secondary data ... 26
7. CONCLUSIONS, LIMITATIONS AND FUTURE RESEARCH ... 33 8. BIBLIOGRAPHY ... 36 APPENDIX ... 42
LIST OF TABLES
Table I: Maize production in Mozambique (tons) ... 10
Table II: Students enrollment and number of schools for 2013 ... 11
Table III: Existing studies on education and agricultural productivity and relevant findings ... 18
Table IV: Spatial models and estimation methods ... 25
Table V: Data descriptive analysis ... 27
Table VI:Results (dependent variable: maize production) ... 30
LIST OF FIGURES Figure 1: Map of Mozambique ... 6
Figure 2: Gross domestic product, current prices ... 42
Figure 3: Sectorial share of GDP, as a percentage ... 42
Figure 4: Share of agricultural exports, 2001-2009 ... 43
Figure 5: Trade balance and agricultural trade balance deficit ... 43
ACRONYMS
ABER – Associação Brasileira de Estudos Regionais e Urbanos
BoP - Balance of Payments
CAP – Censo Agro-Pecuário
FAO – Food and Agriculture Organization
FDI – Foreign Direct Investment
GDP – Gross Domestic Product
GSPRE – Generalized Spatial Random Errors
IMF – International Monetary Fund
INE – Instituto Nacional de Estatística
OLS – Ordinary Least Squares
SAC – Spatial Autocorrelation Model
SAR – Spatial Autoregressive Model
SDM – Spatial Durbin Model
SEM – Spatial Error Model
1. INTRODUCTION
The level of education of the population is one of the key aspects of economic growth. The level of education has a direct correlation with the level of labor productivity. Several studies on the importance of education in agricultural productivity find significant and positive coefficients for education variables, meaning that in many countries education can enhance agricultural productivity and thereby enhance agricultural production1.
In Mozambique, the educational system presents very low participation rates in general as well as in rural areas. This can provide negative impacts on the labor productivity in the most important sector of activity in Mozambique, as for instance, the agricultural sector. This sector is the main source of income of rural population2 and has also has a significant share in the gross domestic product as well as in the trade balance, Mosca (2012).
Therefore, the rural population income might be mostly determined by the productivity of labor. It is important to underline that the level of agricultural productivity and production is directly related with human capital (particularly farmers’ level of education) and the investment put through. This statement is the central thought of the present work.
The relevance of the topic relates to the fact that Mozambique is identified as a country with low levels of agricultural production compared to its neighboring countries and trade partners. In this sense, it is important to refer that these low levels can be explained by the lack of schooling of the rural population, since small scale farmers’
1 For example Appleton, S. & Balihuta, A. (1996), Weir, S. (1999), Reimers, M. & Klasen, S. (2012) and
others.
productivity and ability of adopting new technologies depend, partly, on their level of education.
So, it is important to study the relationship between education and agricultural production in Mozambique, as it has a great role in the economic growth and it can enhance the efficiency of the public expenditure and investment allocated towards the education sector.
This topic is relevant because of the importance of human capital on productivity, in particular in agricultural productivity and production. It has been the subject of many debates and a topic of interest since the early 60’s until the last decade.
In Mozambique, the level of agricultural productivity among the different crops has remained low for many years; consequently, the farmers attain low levels of income with negative effects over poverty that hits approximately 58% of rural population, Mosca (2012).
The low levels of education for the population practicing agriculture and also low capacity of human resources in technical and vocational courses are systematically verified. These facts result in the stagnation of agricultural productivity, which was shown by Mosca (2012), who refers that the yields by hectare are practically the same over the last decades and that the agricultural production per capita is lower by more than 40% compared to 1970.
Similarly, the levels of education of the rural population are considered low compared to those of the urban population. According to Mucavele (2012), the average level of education in rural areas for adult men and women is four to three years, respectively.
In this respect, this dissertation has the objective of studying the relationship between the level of education and the level of agricultural production in Mozambique
focusing on the most important food crop (maize). In other words, to verify the influence that human capital has in farmers’ ability and adoption of technologies and its impact in the level of production.
The general objective of the thesis is to analyze the influence of the level of education in maize production of Mozambique. In order to accomplish that the following specific objectives were established: (1) describe the context and relevance of agricultural sector in Mozambique; (2) measure the influence of the level of education over the level of maize production per province between 1992 and 2013; and, (3) verify the existence of spatial auto-correlation of the maize production among provinces between 1992 and 2013.
Based on those objectives the questions to be answered are the following: does the level of education influences the level of agricultural production (maize) in Mozambique? Does spatial auto-correlation among provinces’ agricultural production (maize) exist?
This paper innovates in the context of analyzing the relationship between maize production and education in Mozambique, with the use of a spatial panel data method.
This dissertation has been divided into eight chapters, of which this introduction is the first one. Chapter 2 presents an analysis of the contextual setting of Mozambican economy, as well as the description of its agricultural sector and educational system. Chapter 3 has been reserved for a literature review containing conclusions and references of different empirical studies about the relationship of education and agricultural productivity and production, identifying different methodologies and results. In Chapter 4 the theoretical background related to the topic is presented. Chapter 5 is dedicated to the methodology, containing the steps of elaborating this dissertation and also the description of the data and statistical method used for the investigation.
Chapter 6 has been reserved for data analysis and results, containing the empirical outputs and a brief discussion of the results. In Chapter 7 the final and general conclusions, limitations and suggestion of future research about the dissertation are presented. And, finally Chapter 8 is reserved for the bibliography.
2. CONTEXTUAL ANALYSIS
The aim of this chapter is to briefly describe the Mozambican economic contextual setting, focusing mainly in the agriculture and education. Thus, this chapter is divided into three sections.
2.1. Brief description of the Mozambican economy
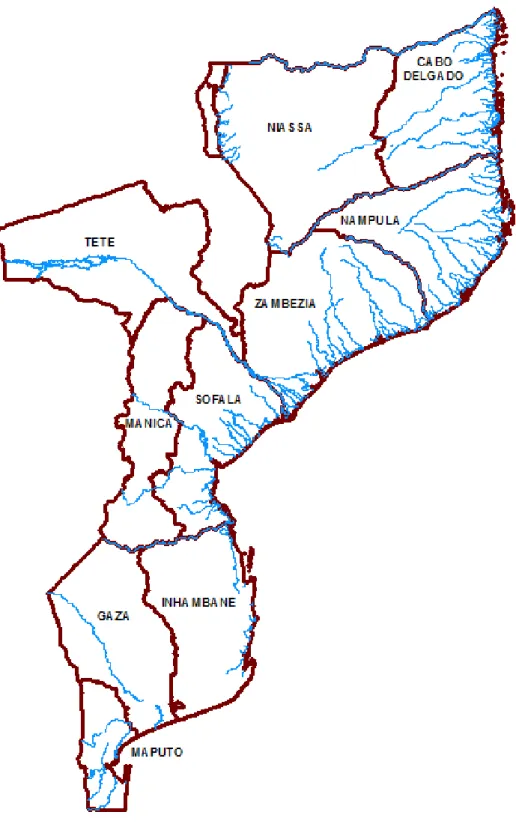
For a better understanding of this economy it is necessary to overview the structure and the administrative division of Mozambique. For that effect, the following map is presented:
Figure 1 Map of Mozambique
Scale: 1:7600000 (cm).
The map above presents the provincial borders of Mozambique and the major rivers and lakes.
Mozambique is administratively divided into three main regions (North, Center and South). Although the map only presents ten provinces, Mozambique is constituted by eleven provinces as the province of Maputo is subdivided in Maputo Cidade (national capital) and Maputo Província.
In order to understand the dynamics of the Mozambican economy, it is important to consider the behavior of its GDP. The GDP has reached in 2012 approximately 14 billion USD (see Figure 2 in Appendix). This economy has experienced considerably high rates of growth, around 7.5% (on average) since 2003. However, some authors3 consider this rapid growth to be unsustainable and based mainly on external resources.
According to Gill-Alana et al (2014) Mozambique achieved the second highest increase in the growth rate of real GDP among nonoil exporting countries in the Sub-Saharan African region. They also state that approximately two-thirds of the gross industrial output is still under state ownership.
The study conducted by Gill-Alana et al (2014) concluded that persistence (all sectors) and seasonality (food, education and restaurant sectors) characterize Mozambique’s inflation, so that effects of inflation shocks are expected to be permanent and requiring, consequently, strong policy measures to combat it.
Based on Figure 3 in the appendix, is possible to conclude that the sectors with the higher contribution of the GDP in the last decade were: (1) agriculture; (2) services; and, (3) trade, confirming the importance of the agricultural sector for the Mozambican economy. Agriculture represents approximately 24% of the total GDP of Mozambique from 2000 to 2010.
However, the sectors that present the highest rates of growth are the extractive industry and financial sector. The growth registered in the extractive industry of
Mozambique is mainly based on the extraction of natural gas since 20044. This does not include the extraction of coal in Moatize mine that started at the end of 2011.
The public deficit is mainly financed by external resources, approximately 96% of it in the period of 2001 and 2012, Mosca et al (2013).
In relation with the external sector it is possible to verify that in the last decade Mozambique’s main exports are constituted by aluminum5
, electric power, gas and some agricultural products. Mozambique is considered an importer country, being the main imports fuel, capital goods and cereals. Consequently it presents a persistent negative trade balance.
The fragility of the Balance of Payments (BoP) is reflected in the fact that the main incomes are, besides exports, debt forgiveness, donations and foreign direct investment (FDI). The deficit of the BoP is mainly and consistently financed by external resources.
2.2. The agricultural sector
Mosca (2012) shows that there has been little or no changes in the structure of this sector since before the independence, in particular, in the productive base including land occupation, infrastructure, technology and in the levels of productivity.
In Mozambique the agricultural sector is mainly composed by smallholders (family sector) as the majority of the agricultural holdings are considered to be of small scale.
According to CAP (2010) the food crops are the most cultivated in Mozambique and maize is the most produced food crop as it holds half the harvested area of basic crop and more than one quarter of food crops’ harvested area.
4 See Mosca et al (2013). 5
Imported raw from Netherlands, transformed in Mozambique by MOZAL and exported as a final product back to Netherlands.
Maize and cassava are the food crops that stand out the most. Cash crops represent 6% of harvested area and the most cultivated cash crops are sesame, tobacco and cotton, Uaiene (2012).
The level of agricultural productivity in Mozambique is considered to be low. According to Mosca (2011) the yields by hectare have been basically the same for decades and the agricultural production per capita is 40% of 1970 level.
As stated by Uaiene (2012) this can be justified by the utilization of rudimentary technology, lack of adequate machinery, level of education, inadequate infrastructure and others. Following this statement, Mapila et al (2014) refers that Mozambique had the lowest proportion of respondents using fertilizers (41.3 per cent in the 2005/06 season and 44.9 per cent in 2006/07), which the author attributed to the lack of an intensive fertilizer subsidy program.
Despite being considered the basis of the Mozambican economy the agricultural sector is losing its importance in terms of share in GDP and also in the economic policies that the Mozambican Government has been adopting. UNDP (2006) in Mosca (2012) refers that the share of agricultural sector in the GDP decreased from 30% in 1997 to 23% in 2003, which can be considered a negative phenomenon because the employment and income of more than 70% of the active population relies in this sector. Figure 3 (see Appendix) provides latest data.
Agricultural exports are rather important in the Mozambican trade balance as it represented approximately 11% of total exports6 with an increasing tendency along the years. It is important to state that tobacco represents, on average, 5% of total exports of the last decade.
6
It is important to take into account that aluminum represents more than 50% of total exports, in the last decade.
Figure 4, in the appendix, presents the distribution of agricultural exports in the last decade. It is possible to verify that the most exported agricultural products are tobacco, sugar, cotton and caju (cashew). Mozambique is a high importer in general, but has particularly large food imports, which results in a high agricultural trade balance (see Figure 5 in Appendix).
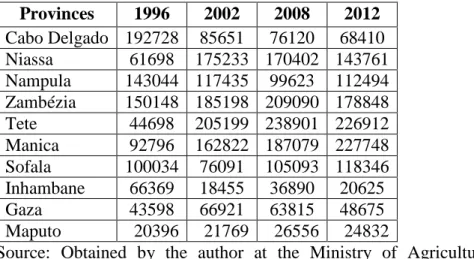
The table below summarizes the levels of maize production per province for the last decades:
Table I
Maize production in Mozambique (tons)
Provinces 1996 2002 2008 2012 Cabo Delgado 192728 85651 76120 68410 Niassa 61698 175233 170402 143761 Nampula 143044 117435 99623 112494 Zambézia 150148 185198 209090 178848 Tete 44698 205199 238901 226912 Manica 92796 162822 187079 227748 Sofala 100034 76091 105093 118346 Inhambane 66369 18455 36890 20625 Gaza 43598 66921 63815 48675 Maputo 20396 21769 26556 24832
Source: Obtained by the author at the Ministry of Agriculture of Mozambique.
2.3. The education sector
In general, the Mozambican population presents very low levels of education and high levels of illiteracy. According to the World Bank (2013) the current literacy rate is around 51%.
However, based on Figure 6 (see Appendix) it is possible to verify that the number of enrolled students is increasing a lot since 1992 and that the number of schools is also increasing. It is important to state that education is one of the sectors that receive more investment from the public budget.
However, according to UNDP (2011) the average number of years of schooling for the Mozambican population is one of the lowest in the world (1.2 years) and the expected years of schooling are about 9.2 years. This report also mentions that Mozambique has the lowest percentage of population with at least secondary education (1.5% for women and 6% for men, age 25 and above).
For the rural population this scenario only gets worse as according to CAP (2010), approximately 40% of the heads of small and medium farms are not able to read or write, 36% has primary school and only 8% has secondary school.
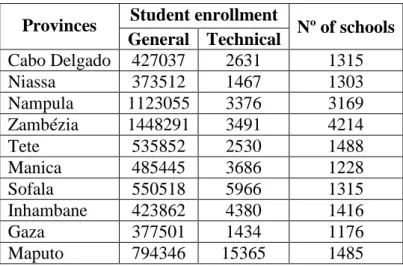
The table below presents an overview of the education sector in Mozambique and the data used in the present paper:
Table II
Students enrollment and number of schools for 2013
Provinces Student enrollment Nº of schools
General Technical Cabo Delgado 427037 2631 1315 Niassa 373512 1467 1303 Nampula 1123055 3376 3169 Zambézia 1448291 3491 4214 Tete 535852 2530 1488 Manica 485445 3686 1228 Sofala 550518 5966 1315 Inhambane 423862 4380 1416 Gaza 377501 1434 1176 Maputo 794346 15365 1485
Source: Obtained by the author at the Ministry of Education of Mozambique.
3. LITERATURE REVIEW
In this chapter, a summary is made about many relevant studies and discussions related to the impact of human capital or education on agricultural productivity and production conducted in different countries and periods.
Schultz (1990) confirmed that there is evidence that education enhances the entrepreneurial ability of farmers and he advances with the hypothesis that the schooling of farmers increases their allocative ability. Welch (1970) in Schultz (1990) states that the demand for entrepreneurship is estimated by the level of agricultural research activity; as empirical evidence Welch found that college graduates increased their earnings more 62% than those who had completed high school.
Welch (1970) in Schultz (1990) states that the value of farmers’ education in production is high as agricultural modernization occurs. Welch separated the work effect from the allocative effect of education and stated that the favorable returns to the schooling and higher education of farmers are in large measure the result of the allocative effects of education.
In the study conducted by Appleton & Balihuta (1996) is possible to identify some important findings for Uganda: (1) the primary schooling of neighboring farm workers appears to raise crop production and these external returns exceed the internal returns; (2) education complements capital and substitutes for labor; and, (3) further productivity increases arise through education increasing physical capital and purchased inputs.
In order to explain the role of education in agricultural productivity, Appleton & Balihuta (1996) distinguished cognitive and non-cognitive effects of schooling. The cognitive effects of schooling include the formation of general skills such as literacy (enabling to follow written instructions for inputs as chemicals and other aspects of
modern farm technology) and numeracy (enabling the farmer to easily handle calculations of dosages and other planning decisions).
Indeed, there is a substantial literature documenting the greater propensity of educated farmers to adopt agricultural innovations. (…) However, there may also be financing effects. If education gives access to more remunerative activities, such as formal non-agricultural employment, it may increase the funds available to the household to purchase marketed inputs and seeds.
In Appleton & Balihuta (1996), p.417 For the non-cognitive effects of schooling Appleton & Balihuta (1996) identified changes in people’s attitudes and practices, by increasing people’s achievement orientation and openness to new ideas and modern practices.
In the same line of thought Weir (1999) states that education may enhance farm productivity directly by improving the quality of labor, by increasing the ability to adjust to disequilibria, and by increasing the propensity of successfully adopting innovations. And it can enhance indirectly through its interaction with other institutional variables: schooling may substitute for access to credit by providing the skills necessary to obtain waged employment, thereby generating cash to finance agricultural investments; and, on the other hand, educated farmers are able to interact more effectively with credit agencies, because they can understand financial transactions and keep records, increasing their probabilities of obtaining credit.
Weir (1999) presented a decomposition of productivity gains through education:
Efficiency change: general skills acquired in school reduce technical and allocative inefficiencies in production.
Technical change: attitudes acquired in school encourage the adoption of new technologies which cause the production frontier to shift outward.
According to Weir (1999), in general education has a positive effect on farm productivity but it can sometimes reduce farm productivity by creating negative attitudes toward farm labor or by reducing time spent in ‘on the job training’, which leads to a negative coefficient. This can happen mainly with secondary level of schooling.
In the context of technical progress, Psacharopoulos and Woodhall (1985) and Heyneman (1983) identified the following four stages of agricultural technology adoption and the role education may play in each stage:
Stage 1: Traditional farming. Information is passed from father to son, and little or no schooling is needed. Stage 2: Single input adoption (e.g., fertilizer). Basic literacy and numeracy are very useful to farmers for understanding instructions and adjusting quantities of the new input. Stage 3: Adoption of multiple inputs simultaneously. Here, more than literacy and numeracy are necessary. Some basic science knowledge is helpful. Stage 4: Irrigation based farming. The farmer must make complex calculations of effects of changes in crops and weather. More education is needed for efficient production at this stage.
In Weir (1999), p. 8 It is important to state that schooling may also be used to determine the decision of a farmer to be an early adopter of innovations and the extent to which these will be used. And for this matter, Weir (1999) identified three reasons: (1) a more educated farmer tends to be more affluent and in less danger of starvation in case of an unsuccessful innovation; (2) educated farmers may be more likely to be contacted by agricultural extension workers to test innovations; and, (3) literate farmers are better able to acquire information about potential innovations and to make rational evaluations of the risks involved.
Reimers & Klasen (2012) refer that education has the power of enhancing people’s ability to either receive, decode, and understand information (Nelson and Phelps, 1966) or to perceive new classes of problems, to clarify such problems, and to learn ways of solving them (Schultz, 1975).
Welch (1970) in Reimers & Klasen (2012) distinguished two different phenomena among the effects of education in productivity: (1) the ability of well-educated workers to use a given amount of resources more efficiently, the so called worker effect; and, (2) the allocative effect7 which is characterized by the ability of an educated worker to sufficiently acquire and decode information about costs and productive characteristics of other inputs (the more educated the farmer is, the more efficiently he will allocate resources).
In the study conducted by Reimers & Klasen (2012) only primary and secondary schooling attainments have significant positive impacts on agricultural productivity in several countries. It was already tested empirically that education leads to higher agricultural productivity in the presence of rapid technological progress and it is higher for countries with higher levels of income.
In summary, Reimers & Klasen (2012) identify several ways in which education can affect agricultural productivity. They identified the following mechanisms8:
Improve farmers’ management skills by enhancing their decision-making skills (Asadullah & Rahman, 2009). Educated farmers are able to make better use of the information available, better identification of problems and to autonomously find solutions.
Upgrade their access to required information so that they could pay and receive better prices for inputs used and outputs sold (Jamison & Lau, 1982). Thus,
7 The allocative effect has two components: input allocation and input selection, Pudasaini (1983). 8
It is important to state that farmers’ schooling generate its productive value mainly as a consequence of the allocative effect and less from the worker effect, Reimers & Klasen (2012).
disengaging themselves from tight grips of inefficient word of mouth communication patterns.
Many empirical studies show that the better is the education of the farmers the faster they will adopt new technologies and have the first mover advantage. Farmers with less schooling will adopt new technologies later and only after its profitability is proven (by first movers).
The improvement of decision-making skills and better education results on the choice of riskier production technologies that might involve higher returns (Asadullah & Rahman, 2009). Those who adopt new technologies earlier are the ones that have lower perceived uncertainty (lower farmer aversion towards endogenous risk).
However, it is important to understand that there is complementarity of capital investments in the agricultural and educational sectors, since technical progress is needed to fully exploit the productivity-enhancing potential of schooling, Reimers & Klasen (2012).
Another study that prioritize technological progress in the process of enhancing productivity through education is the one from Alene & Manyong (2006) which states that factors that promote technology adoption (schooling, participatory technology evaluation, improved seed supply, and market access) will indirectly increase the contributions of farmer education.
Their results demonstrate that schooling not only enhances agricultural productivity in Nigeria following technology adoption but also promotes adoption itself. This means that education plays a greater role in modernizing agriculture than in traditional agriculture (better educated farmers adjust more successfully to technological changes than less educated farmers).
In the same context Pudasaini (1983), analyzing data from Nepal, concludes that education has a higher payoff to productivity in a modernizing environment rather than traditional agriculture, and also adds that the same happens with higher education. He also came to the conclusion that education contributed to agricultural production through both worker and allocative effects and that the latter was more crucial in areas of traditional agriculture as well as in areas of modernizing environment.
Asadullah & Rahman (2009) mention that educational externalities9 can arise when measuring the effect of education in agricultural productivity. The study of Appleton & Balihuta (1996) concludes that externality benefit of education is sizable: mean primary schooling of neighboring farmers enhances own farm’s productivity.
The findings of Asadullah & Rahman (2009) support the statement that basic education plays a much more important role in agriculture in comparison with higher education. This statement is complemented with findings of Weir (1999), who refers that at least four years of primary schooling are required to have a significant effect on agricultural productivity.
Ulimwengu & Badiane (2010) showed that vocational training (promotion of education schemes tailored to the specific technical needs of smallholder or poor farmers) can have greater positive effects in agricultural productivity compared to primary and secondary schooling. The farmers who benefited from it seem to enjoy greater management capacities and efficiency levels, including few illness and injury incidences.
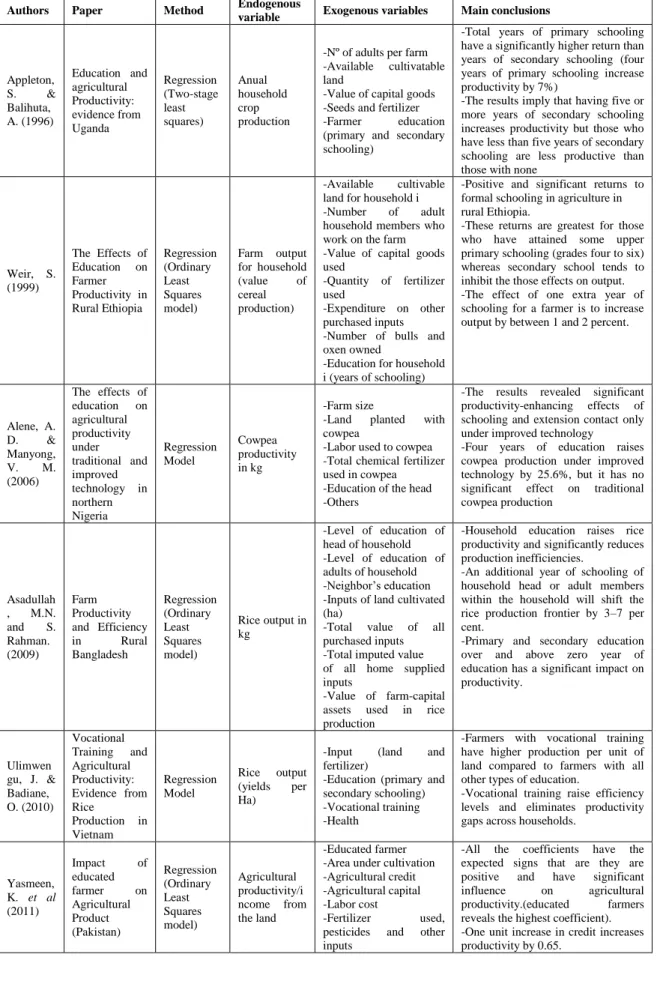
The table below summarizes the most relevant findings and methods used when determining the impact of education in agricultural productivity:
9 Educational externalities arises as uneducated farmers learn from superior production choices of other
educated farmers in the neighborhood or when educated farmers are early innovators and are copied by those with less schooling, Asadullah & Rahman (2009).
Table III
Existing studies on education and agricultural productivity and relevant findings
Authors Paper Method Endogenous variable Exogenous variables Main conclusions
Appleton, S. & Balihuta, A. (1996) Education and agricultural Productivity: evidence from Uganda Regression (Two-stage least squares) Anual household crop production
-Nº of adults per farm -Available cultivatable land
-Value of capital goods -Seeds and fertilizer -Farmer education (primary and secondary schooling)
-Total years of primary schooling have a significantly higher return than years of secondary schooling (four years of primary schooling increase productivity by 7%)
-The results imply that having five or more years of secondary schooling increases productivity but those who have less than five years of secondary schooling are less productive than those with none
Weir, S. (1999) The Effects of Education on Farmer Productivity in Rural Ethiopia Regression (Ordinary Least Squares model) Farm output for household (value of cereal production) -Available cultivable land for household i -Number of adult household members who work on the farm -Value of capital goods used
-Quantity of fertilizer used
-Expenditure on other purchased inputs -Number of bulls and oxen owned
-Education for household i (years of schooling)
-Positive and significant returns to formal schooling in agriculture in rural Ethiopia.
-These returns are greatest for those who have attained some upper primary schooling (grades four to six) whereas secondary school tends to inhibit the those effects on output. -The effect of one extra year of schooling for a farmer is to increase output by between 1 and 2 percent.
Alene, A. D. & Manyong, V. M. (2006) The effects of education on agricultural productivity under traditional and improved technology in northern Nigeria Regression Model Cowpea productivity in kg -Farm size
-Land planted with cowpea
-Labor used to cowpea -Total chemical fertilizer used in cowpea -Education of the head -Others
-The results revealed significant productivity-enhancing effects of schooling and extension contact only under improved technology -Four years of education raises cowpea production under improved technology by 25.6%, but it has no significant effect on traditional cowpea production Asadullah , M.N. and S. Rahman. (2009) Farm Productivity and Efficiency in Rural Bangladesh Regression (Ordinary Least Squares model) Rice output in kg -Level of education of head of household -Level of education of adults of household -Neighbor’s education -Inputs of land cultivated (ha)
-Total value of all purchased inputs -Total imputed value of all home supplied inputs
-Value of farm-capital assets used in rice production
-Household education raises rice productivity and significantly reduces production inefficiencies.
-An additional year of schooling of household head or adult members within the household will shift the rice production frontier by 3–7 per cent.
-Primary and secondary education over and above zero year of education has a significant impact on productivity. Ulimwen gu, J. & Badiane, O. (2010) Vocational Training and Agricultural Productivity: Evidence from Rice Production in Vietnam Regression Model Rice output (yields per Ha)
-Input (land and fertilizer)
-Education (primary and secondary schooling) -Vocational training -Health
-Farmers with vocational training have higher production per unit of land compared to farmers with all other types of education.
-Vocational training raise efficiency levels and eliminates productivity gaps across households.
Yasmeen, K. et al (2011) Impact of educated farmer on Agricultural Product (Pakistan) Regression (Ordinary Least Squares model) Agricultural productivity/i ncome from the land -Educated farmer -Area under cultivation -Agricultural credit -Agricultural capital -Labor cost
-Fertilizer used, pesticides and other inputs
-All the coefficients have the expected signs that are they are positive and have significant influence on agricultural productivity.(educated farmers reveals the highest coefficient). -One unit increase in credit increases productivity by 0.65.
Reimers, M. & Klasen, S. (2012) Revisiting the role of education for agricultural productivity Regression Model (Feasible General Least Squares Model) Output per Ha (Total value of agriculture production in $/Total agricultural area in Ha)
-Input per Ha (Labor, fertilizer, tractors and livestock)
-Average years of schooling
-An additional year of schooling for the whole population would increase agricultural productivity by approximately 3.2%
-Only primary and secondary education has a statistically significant positive impact on agricultural productivity
-The effect of education is generally smaller for the poorest countries.
Source: Elaborated by the author based on the referred studies.
This set of studies has as main sources countries from Africa and Asia and most have primary and secondary schooling as the exogenous variables to represent education. In the present work, besides primary and secondary education, the effects of technical education are also considered as well as the number of schools in agricultural production in Mozambique.
In terms of method used, it is possible to verify that the majority of studies of this topic rely in regression models. However I will be using a rather new method that is spatial econometrics.
At this point, it is very clear that education has a positive impact on agricultural productivity and production, but there are some studies that do not follow this statement.
Some studies find the returns to education to be small or even absent on agricultural productivity and production. Reimers & Klasen (2012) present the following theoretical reasons: (1) low quality of education to effectively increase individual’s cognitive abilities and, ultimately, his/her level of productivity; (2) unspecific skills provided in formal education which wouldn’t positively affect agricultural productivity; and, (3) estimates of the agricultural productivity returns to schooling may potentially be downwardly biased if authors limit their analysis to the agricultural sector, and as a consequence, they do not fully capture the returns to schooling of those educated individuals who decide to allocate at least parts of their human capital to sectors other than agriculture.
According to Reimers & Klasen (2012) education may lead to higher agricultural productivity in the presence of rapid technical progress and are highest for countries with higher levels of income, which face rapid technical changes. Or it was claimed that recent cross-country studies using sophisticated econometric methods failed to detect a statistically significant, positive impact of schooling as a consequence of inadequate proxies used to measure a country’s stock of education.
Most studies failed to account that education plays a greater role in modernizing agriculture than in traditional agriculture (better educated farmers adjust more successfully to technological changes than less educated farmers), Alene & Manyong (2006).
Asadullah & Rahman (2009) state that one of the reasons that justifies differences in findings across studies is the variation in the nature of technology underlying agricultural production. Effects of education are more likely to prevail in economies which are modernizing farm production, that is why studies that use data from Asian countries tend to find a positive return to education, generally opposite from data of Latin America and Africa (proxies may contain little information and therefore, undermine the actual returns to education).
4. THEORETICAL BACKGROUND
The theoretical background underlying this thesis is the theory of human capital developed by Theodore Schultz and complemented by Gary Becker, demonstrating that throughoutout education, human beings are capable of improving their abilities and thus productivity and production.
Although in the early 60’s it was considered offensive to look at human beings as capital goods and to consider the investment in them, Schultz (1961) recognized that skills and knowledge are considered to be capital and the investment in human capital can improve the quality of human effort and enhance productivity. In this context, Becker (1964) in Ulimwengu & Badiane (2010) state that primary and secondary schooling leads to higher income and improve overall economic development and growth.
Schultz (1972) states that investment in human capital can be classified into the following investments: (1) schooling and higher education; (2) postschool training and learning; (3) preschool learning activities; (4) migration; (5) health; (6) information; and, (7) investment in children (population).
Schultz (1990) identified Schumpeter’s approach to economic development as the one that explains the economic importance of entrepreneurs as innovators, but there are some limitations in the Schumpeter’s concept of economic development10
as the exclusion of changes in economic conditions that occur during economic modernization (changes that create disequilibria).
According to Schultz (1990) the scope and substance of human capital explain in large measure economic modernization by augmenting income (increases in income
10 Schumpeter’s concept of economic development: changes in economic life not force upon it from
without but arises by its own initiative, from within; concept restricted to entrepreneurs who carry out large new combinations of the means of production, Schultz (1990).
from the following economic events: (1) advances in technology; (2) proliferation of human capital; (3) increases in specialization; and, (4) increases in specialization induced by the other increases in income) and creating disequilibria and additional income is derived from restoring equilibrium.
In conclusion, Shultz (1990) refers that human capital enhances the productivity of both labor and physical capital, people at each skill level are more productive in high than in low human capital environments, and there is evidence that education enhances the entrepreneurial ability of farmers. The ability of individuals and families to restore equilibrium in their private economic domain is enhanced by the quantity and quality of their human capital. The productivity effects of education can be distinguished between work skills and on entrepreneurship in dealing with disequilibria.
5. METHODOLOGY
In order to elucidate the perception about the relation of education and productivity, and in particular with agricultural productivity, a literature review about the importance of education or human capital in the level of productivity of labor and other related factors was undertaken.
Afterwards, secondary data relative to many different variables that represent the evolution of the level of education of the population throughout the years of study was collected. Information relative to the productivity of the crops was also gathered. This data was collected by province, making it possible to use panel data.
The statistical method was applied in the process of secondary data treatment. This dissertation is based on spatial econometrics of panel data through the inclusion of provinces’ latitude and longitude. The program used was STATA 11.
5.1. Statistical method: spatial econometrics (panel data)
Based on the objectives and questions of the dissertation, spatial regression methods were chosen and considered consistent to analyze the data.
Spatial regression methods allow us to account for dependence between observations, which often arises when observations are collected from points or regions located in space and it can be observed that data collected for regions or points in space are spatially dependent, rather than independent, meaning that observations from one location tend to exhibit values similar to those from nearby locations, Lesage (2008).
Spatial econometrics can be defined as the following:
Spatial econometrics is a field whose analytical techniques are designed to incorporate dependence among observations (regions or points in space) that are in close geographical proximity. Extending the standard linear regression model,
spatial methods identify cohorts of « nearest neighbors » and allow for dependence between these regions/observations (Anselin, 1988, Lesage, 2005).
In Lesage (2008), p. 20 In the standard regression model, special dependence can be incorporated in two distinct ways: as an additional regressor in the form of a spatially lagged dependent variable (Wy) or in the error structure, Anselin (1988).
In this sense, Barros et al (2012) states that in order to understand the differing implications of spatial and temporal autocorrelation, it is helpful to consider Anselin’s (1988) general spatial model, that is the following:
(1)
In this model Y is an N by 1 vector of observations of the endogenous variable
Maize production. X is an N x K matrix of observations on the independent variables.
W and M are N x N spatial-weighting matrices that parameterize the distance between neighborhood states. μ are spatial correlated residuals, and are independent and identically distributed disturbances. is the spatial autoregressive parameter for the spatially lagged error term and is the spatial autoregressive parameter for the spatially correlation in the errors. The spatial error model that is consistent with attribution dependence results from setting equal to zero, Barros et al (2012).
It is possible to estimate spatial models through some of the following alternatives:
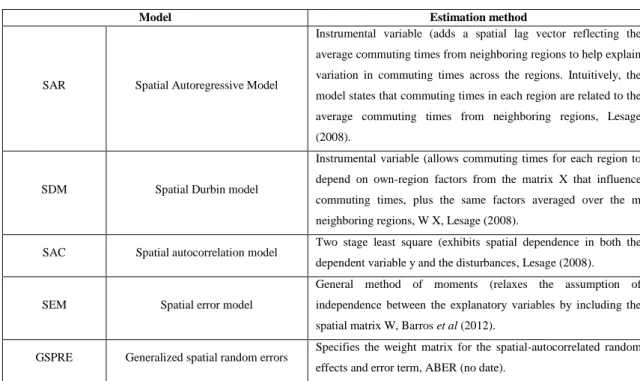
Table IV
Spatial models and estimation methods
Model Estimation method
SAR Spatial Autoregressive Model
Instrumental variable (adds a spatial lag vector reflecting the average commuting times from neighboring regions to help explain variation in commuting times across the regions. Intuitively, the model states that commuting times in each region are related to the average commuting times from neighboring regions, Lesage (2008).
SDM Spatial Durbin model
Instrumental variable (allows commuting times for each region to depend on own-region factors from the matrix X that influence commuting times, plus the same factors averaged over the m neighboring regions, W X, Lesage (2008).
SAC Spatial autocorrelation model Two stage least square (exhibits spatial dependence in both the dependent variable y and the disturbances, Lesage (2008).
SEM Spatial error model
General method of moments (relaxes the assumption of independence between the explanatory variables by including the spatial matrix W, Barros et al (2012).
GSPRE Generalized spatial random errors Specifies the weight matrix for the spatial-autocorrelated random effects and error term, ABER (no date).
6. DATA ANALYSIS AND RESULTS
This chapter contains the information about the data used in this study and the analysis of the results obtained through the application of the different spatial models. It is divided in two sections. The first section contains brief descriptions of the secondary data used in this study and the second section consists on the analysis and interpretation of the results obtained in STATA 11, with the objective of finding out if the variables of education can explain the behavior of the dependent variable (maize production) and identifying whether there is or not spatial auto-correlation in the maize production among the different provinces.
6.1. Description of secondary data
The secondary data was directly collected at several public institutions namely: Ministry of Education; Ministry of Agriculture; Instituto Nacional de Estatística (INE); Food and Agriculture Organization (FAO) and others. This data was complemented with databases available online at the International Monetary Fund (IMF) website.
Time span: 1992 – 2013; It was highly dependent on the accessibility and
existence of data. Although it was collected directly, there is no data officially available for the chosen variables or even similar ones before 1992.
Spatial dimension: The Republic of Mozambique consists of 11 provinces. But
for the data analysis 10 provinces were considered as the 10th province represent the total of two provinces (Maputo Província and Maputo Cidade), as the official records for agriculture are aggregate.
The description of the variables to be used in the spatial models is the following:
Endogenous variable:
The variable “Maize production” was selected to be the endogenous variable as it is representative of agricultural production in Mozambique because it is the most important food crop produced in Mozambique and it is produced in all provinces11.
Exogenous variables:
Student enrollment1 (primary and secondary education);
Student enrollment2 (technical education);
Number of schools;
Latitude and longitude of each province (average).
The selection of the exogenous variables was made after a brief literature review and also based on the data available for the educational sector in Mozambique. This selection is consistent with the theory of human capital by Schultz and Becker, as primary and secondary education are considered to be a way of improving human capital.
The table below presents descriptive statistics for the period of 1992 to 2013 for the variables used in the model of the current dissertation:
Table V
Data descriptive analysis
VARIABLES Mean Standard
Deviation Min Max Source
Maize (tons) 111,988.90 83,979.41 2,941.79 423,889.70 Ministry of agriculture Student enrollment1 371,993.30 272,006.20 57,555.00 1448291.00 Ministry of education Student enrollment2 2,704.04 3,082.83 158.00 18,419.00 Number of schools 983.14 684.50 0 4,214.00 Latitude (average) 18.13 4.21 12.15 25.33 INE (2009) Longitude (average) 34.92 2.15 32.24 38.45
It is possible to observe an average of 111.988,9 tons of maize produced by year by province for the whole period analyzed. On average, the number of students enrolled in basic education (primary and secondary schooling) is much higher than the number of students enrolled in technical education (Student enrollment2).
6.2. Analysis of results
Based on the questions and objectives of this dissertation, the goal of this analysis is to verify how do education variables for Mozambique influence the level of maize production and verify if there is spatial auto-correlation of the dependent variable among the different provinces.
Before estimating the spatial model, it is necessary to check for spatial dependence by calculating the Moran-I test12. This test resulted in a z value of 13.3 with p-value of 0.000, meaning that we can reject the null hypothesis that there is zero spatial autocorrelation present in the variable production of maize in Mozambique. These results enable us to accept that there is spatial autocorrelation present in the estimated models error terms.
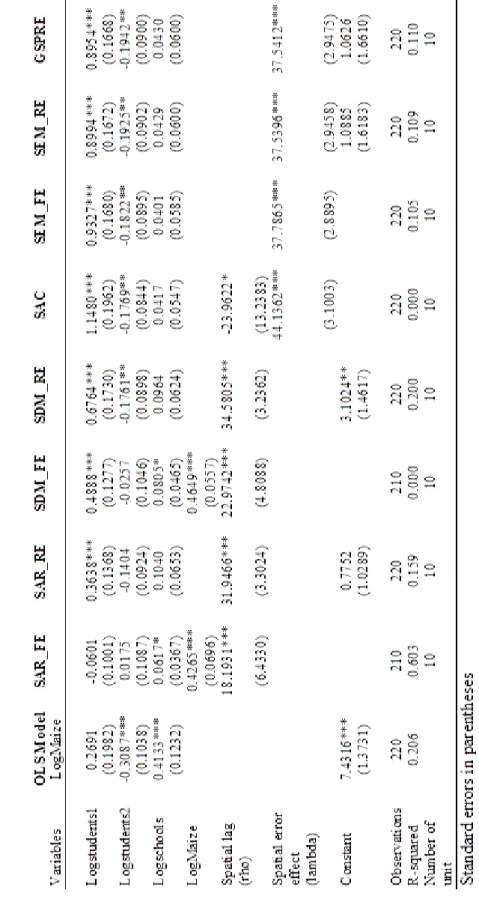
The estimation results are presented in Table VI, which contains six models of estimation, as follow: OLS model, spatial autoregressive model (SAR), spatial Durbin model (SDM), spatial autocorrelation model (SAC), spatial error model (SEM) and generalized spatial random errors (GSRE).
The first one to be presented is the OLS model which exhibits Prob > F = 0.0000, meaning that we can reject the null hypothesis and at least one of the parameters is significant and can explain the behavior of the dependent variable. Based on this model
12
The Moran’s I test is the most commonly used specification test for spatial autocorrelation. This test is derived from a statistic developed by Patrick Alfred Pierce Moran, Anselin (1988).
it is possible to conclude that the production of maize attain a negative correlation with technical education (coef. = -0.3087).
On the other hand, the number of schools exhibits a different outcome against the behavior of maize production, since it presents a positive coefficient. Lastly, for the independent variable “primary and secondary schooling” there is no evidence of the relationship with the depend variable as it is statistically insignificant.
Then, follows the estimation of the SAR. This spatial lag model relaxes the assumption of independence between the explanatory variables by including the spatial matrix W and the spatial model with the spatial matrix with a lag, Pisatti (2001) in Barros et al (2012). Afterwards, the spatial error model (SEM) is also estimated, in this case the assumption of independence between the explanatory variables is relaxed by including the spatial matrix W, Barros et al (2012).
The two models above and the others presented in Table IV show similar results. The SEM model presents a positive and statistically significant spatial error effect (lambda) with both fixed and random effect, meaning that spatial autocorrelation exists among provinces relative to maize production, and this autocorrelation is positive.
The results stated above validate the use of spatial models in the analysis of maize production, Barros et al (2012).
The SAR model results present a statistical significant and positive estimated coefficient on the spatial lag (rho) in both fixed and random effects; this implies that there is spatial lag in maize production. This result is confirmed by the SDM model. However, the SAC model does not reinforce this results as it presents a negative coefficient on the spatial lag (rho) but significant only in the level of confidence of 90%, so it is considered statistically insignificant.
Ta ble V I R esult s ( de pe nde nt va ri a ble: maiz e prod uc ti on)
Based on Table VI it is possible to verify that the exogenous variables present the same signs along the estimations of the various models and approximated parameter values13. This leads to many different conclusions. The first, is that the basic schooling (primary and secondary schooling) labeled as the variable “Logstudents1” can explain partially the increases in maize production in Mozambique.
Secondly, the variable “Logstudents2” which includes students from technical education (accounting, electricity, mechanics, etc.) present a negative and statistically significant coefficient. From that it is possible to conclude it has negative correlation with maize production in Mozambique. This is justified by the fact that the individuals who get this type of education tend to transfer their labor force to other sectors of the economy which they consider more attractive.
These two conclusions confirm the statement by Shultz and Becker (and many other authors in this field) that primary and secondary schooling have higher positive impact in enhancing agricultural production than any other level of education.
The third conclusion to be drawn is that the increases in maize production can be partially explained by the increases in number of schools in Mozambique (labeled as the variable “Logschools” in Table IV), as it present positive and statistically significant coefficient.
So, it can be said that public expenditures in education, particularly investments in primary and secondary schooling (construction of schools in rural areas and improvements of the existing ones) will have positive effects in the agricultural production, mainly maize production. The results of this analysis show the relevance of education in improving and increasing agricultural production in Mozambique. It gives
foundations to enhance the efficiency through which the public sector should direct public expenditure and investment if the agricultural sector is set as a priority.
7. CONCLUSIONS, LIMITATIONS AND FUTURE RESEARCH
The goal of the current work is to verify how do education variables for Mozambique influence the level of maize production and verify if there is spatial auto-correlation of the dependent variable among the different provinces in the period of 1992 to 2013, based on spatial econometrics.
From the many different works about the topic, it was possible to verify that there are evidences that an increase on the level of education can improve agricultural productivity and production. However, this improvement is greater in modernizing agriculture environment than in traditional ones. It is also true that basic education plays a much more important role in agricultural productivity in comparison with higher education.
The agricultural sector in Mozambique is very important as it is the sector with the highest contribution on the GDP for many decades, however the level of productivity is considered to be very low. This low level can be explained by poor technologies or by the low level of education in Mozambique and particularly in the rural areas, where approximately 40% of the heads of small and medium farms are not able to read or write.
Before estimating the spatial model, it is necessary to check for spatial dependence by calculating the Moran-I test, which enabled to accept that there is positive spatial autocorrelation present in the estimated models error terms.
So, after analyzing and interpreting the results, it is possible to conclude, based on OLS, that the production of maize attains a negative correlation with technical education (coef. = -0.3087), which can be justified by the statement above that refers that basic education plays a much more important role in agricultural productivity in comparison with higher education. The dependent variable presents a positive
relationship with the number of schools and for the variable “primary and secondary schooling” there is no evidence of the relationship with the depend variable.
From the spatial models it was possible to identify a positive and statistically significant spatial error effect (lambda) with both fixed and random effect, meaning that spatial autocorrelation exists among provinces relative to maize production, and this autocorrelation is positive.
From this analysis, it was possible to get three conclusions: (1) basic schooling (primary and secondary schooling) explains partially the increases in maize production in Mozambique; (2) technical education has negative correlation with maize production in Mozambique; and, (3) maize production can be partially explained by the increases in number of schools in Mozambique.
These results confirm the statements behind the theory of human capital and the findings that primary and secondary schooling have higher positive impact in enhancing agricultural productivity than any other level of education.
The conclusions reached in the current paper are relevant as it can lead to better management of public resources in order to improve agricultural production in Mozambique, in other words, it can help to enhance the efficiency of directing the public expenditure and investment towards educational sector that can benefit the agricultural sector.
Along the preparation of the current work, there were some difficulties that came across. The main difficulty regards the collection and availability of data in public institutions in Mozambique. Most of the data related to agriculture and education (especially by provinces) has been recorded only since 1992, which limits the time dimension used in this dissertation.
There is no data available that express exactly the level of education of each farmer along the years (years of schooling) and by province. Therefore, I considered the level of education in general which can compromise the results. With respect to agricultural data, it is very hard to find the total productivity of agricultural sector for each province that is why maize production is used.
This work can surely be used as a motivation to carry out new research in both fields, relation between agricultural productivity and education as well as using spatial econometrics.
As mentioned before, technology and innovation play a very important role in enhancing agricultural production and productivity and it is directly related to the level of education of the farmers. This statement provides a very interesting and solid suggestion for future research by including variables referring to technology and innovation.
8. BIBLIOGRAPHY
ABER (Associação Brasileira de Estudos Regionais e Urbanos) (no date). Uma Aplicação de Econometria Espacial para os Municípios Saudáveis do Brasil. Artigo nº
233. Available in
https://translate.google.pt/?hl=pt-PT&tab=wT#pt/en/disponivel%20em.
Alene, A. D. & Manyong, V. M. (2006). The effects of education on agricultural productivity under traditional and improved technology in northern Nigeria: an endogenous switching regression analysis. Empirical Economics 32:141–159.
Anselin L. (1988). Spatial Econometrics: Methods and Models. Boston: Kluwer Academic Publishers.
Asadullah, M.N., and S. Rahman. (2009). Farm Productivity and Efficiency in Rural Bangladesh: The Role of Education Revisited. Applied Economics 41(1):17–33.
Appleton, S. & Balihuta, A. (1996). Education and Agricultural Productivity: Evidence from Uganda. Journal of International Development. Vol. 8, No. 3,415-444.
Banco de Moçambique (several years). Relatório anual. Maputo.
Barros, C. P., Faria, J. R. & Araújo Jr., A. F. (2012). Brazilian Land Tenure Conflicts: a Spatial Analysis. Journal of International Development.
Becker, G.S. (1964) Human Capital: A Theoretical and Empirical Analysis, with
Special Reference to Education. New York: Columbia University Press.
Brito, L. (2009). Moçambique: de uma economia de serviços a uma economia de renda. IESE, IDEIAS, Boletim Nº 13.
CAP (Censo Agro-Pecuário) (2010). CAP 2009-2010: Resultados definitivos. Instituto Nacional de Estatística. Maputo, Moçambique.
FAO (Food and Agriculture Organization) (2013). FAOSTAT [Database]. November, 2013. Available in: http://faostat.fao.org/site/342/default.aspx
INE (2009). Anuário estatístico, Statistical yearbook 2009. Maputo, Moçambique.
Gill-Alana, L. A., Barros, C. & Faria, J. R. (2014). Inflation in Mozambique: empirical facts based on persistence, seasonality and breaks. Applied Economics. Vol. 46, Iss. 21.
International Monetary Fund (2014). World Economic Outlook Database [Database].
April, 2014. Available in:
http://www.imf.org/external/pubs/ft/weo/2014/01/weodata/download.aspx
Heyneman, S. P. (1983). Improving the quality of education in developing countries.
Jamison, D.T., and L.J. Lau. (1982). Farmer Education and Farm Efficiency. Baltimore, MD: Johns Hopkins University Press.
Lesage, J. (2008). An introduction to spatial econometrics. Revue d’économie
industrielle, n° 123, 2008.
Mapila, M., Njuki, J., Delve, R. J., Zigore, S., Matibini, J. (2012). Determinants of fertiliser use by smallholder maize farmers in the Chinyanja Triangle in Malawi, Mozambique and Zambia. Agrekon: Agricultural Economics Research, Policy and
Practice in Southern Africa. 51:1, 21-41.
Mosca, J. (2011). Políticas Agrárias de (em) Moçambique (1975-2009). Maputo: Escolar Editora.
Mosca, J. (2012). Políticas agrárias e mudanças na agricultura de Moçambique (1975-2009). In Mosca, J. et al (Eds.) Contributos para o debate da agricultura e do
desenvolvimento rural, Maputo: Escolar Editora.
Mosca, J., Barreto, G., Abbas, M. & Bruna, N. (2012). Competitividade da economia
moçambicana. Maputo. Escolar Editora.
Mosca, J., Abbas, M. & Bruna, N. (2013). Economia de Moçambique 2001-2010: Um
Mucavele, F. (2012). O Papel da Agricultura no Desenvolvimento de Moçambique: Agenda para Moçambique. In: Mosca et al. Contributos para o Debate da Agricultura e
do Desenvolvimento Rural. Maputo: Escolar Editora, pp 159-171.
Nelson,R.R. & Phelps, E.S. (1966). Investment in Humans, Technological Diffusion, and Economic Growth. The American Economic Review. 56 (1/2):69–75.
Pisatti, M. (2001). sg162 Tools for spatial data analysis. Stata Technical Bulletin, 60, March; 21–36.
Penzhorn, N. & Arndt, C. (2010). Maize markets in Mozambique: Testing for market integration. Agrekon: Agricultural Economics Research, Policy and Practice in Southern
Africa. 41:2, 146-159.
Psacharopoulos, G. & Maureen, W. (1985). Education for Development: An Analysis of
Investment Choices. Oxford: Oxford University Press.
Pudasaini, S. P. (1983). The Effects of Education in Agriculture: Evidence from Nepal.
American Journal of Agricultural Economics. Vol. 65, No. 3: 509-515
Reimers, M. & Klasen, S. (2012). Revisiting the Role of Education for Agricultural Productivity. American Journal of Agricultural Economics. 95(1): 131–152.
Schultz, T. W. (1961). Investment in Human Capital. The American Economic Review. 51 (1): 1-17.
Schultz, T. W. (1972). Human Capital: Policy Issues And Research Opportunities.
Economic Research: Retrospect and Prospect Vol 6: Human Resources. UMI.
Schultz, T.W. (1975). The Value of the Ability to Deal with Disequilibria. Journal of
Economic Literature 13(3):827–46.
Schultz, T. W. (1990). Restoring Economic Equilibrium: Human Capital in the
Modernizing Economy. Basil Blackwell.
Uaiene, R. (2012). Estrutura, conduta e desempenho da agricultura familiar em Moçambique. In: Mosca et al. Contributos para o Debate da Agricultura e do
Desenvolvimento Rural. Maputo: Escolar Editora, pp 49-67.
Ulimwengu, J. & Badiane, O. (2010). Vocational Training and Agricultural Productivity: Evidence from Rice Production in Vietnam. The Journal of Agricultural
Education and Extension. 16:4, 399-411.
UNDP (United Nations Development Programme) (2006). Beyond scarcity: Power, poverty and the global water crisis.
UNDP (United Nations Development Programme) (2011). Human development report 2011: Sustainability and equity, a better future for all.
Yasmeen, K., Abbasian, E & Hussain, T. (2011). Impact of Educated Farmer on Agricultural Product. Journal of Public Administration and Governance. Vol. 1, No. 2, 158-164.