(Annals of the Brazilian Academy of Sciences) ISSN 0001-3765
www.scielo.br/aabc
Sensitive and rapid titrimetric and spectrophotometric methods for the
determination of stavudine in pharmaceuticals using
bromate-bromide and three dyes
KANAKAPURA BASAVAIAH1, VEERAIAH RAMAKRISHNA2, CHIKKASWAMY SOMASHEKAR1 and URDIGERE R. ANIL KUMAR1
1Department of Chemistry, University of Mysore, Manasagangotri, Mysore, 570006, India 2Department of Drugs Control, Government College of Pharmacy, Bangalore, 560027, India
Manuscript received on November 1, 2006; accepted for publication on September 5, 2007; presented byFERNANDOGALEMBECK
ABSTRACT
Four sensitive and rapid methods for the determination of stavudine (STV) in bulk drug and in dosage forms were developed and optimized. In titrimetry, aqueous solution of STV was treated with a known excess of bromate-bromide in HCl medium followed by estimation of unreacted bromine by iodometric back titration. Spectrophotometric methods involve the addition of a measured excess of bromate-bromide in HCl medium and subsequent estimation of the residual bromine by reacting with a fixed amount of methyl orange, indigocarmine or thymol blue followed by measurement of absorbance at 520 nm (method A), 610 nm (method B) or 550 nm (method C). In all the methods, the amount of bromate reacted corresponds to the amount of STV. Calculations in titrimetry were based on a 1:0.666 (STV : KBrO3) stoichiometry and the method was found to be applicable over 3.5-10 mg range. A linear increase in absorbance with concentration of STV was observed in the spectrophotometric methods, and the Beer’s law was obeyed over the concentration ranges 0.125-1.75, 1-10 and 1-9.0µg mL−1STV for method A, method B and method C, respectively. The methods when applied to the determination of STV in tablets and capsules were found to give satisfactory results.
Key words:Stavudine determination, titrimetry, spectrophotometry, bromate-bromide, dyes, pharmaceuticals.
INTRODUCTION
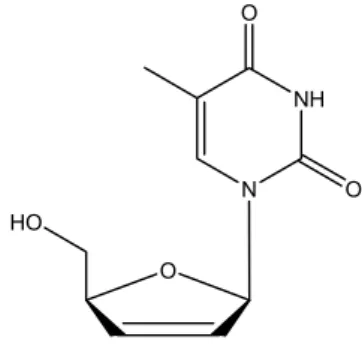
Stavudine (STV), chemically known as 21-31
-didehydro-21-31-dideoxythymidine (Fig. 1), is a nucleoside analog reverse transcriptase inhibitor (NARTI) active against HIV (The Merck Index 1996). STV is converted in-tracellularly to triphosphate which stops the DNA syn-thesis of retroviruses through competitive inhibition of reverse transcriptase and incorporation into viral DNA. It is the fourth antiretroviral drug in the market and is used in the treatment of HIV infection. The drug is of-ficial in United States of Pharmacopoeia (The United States Pharmacopoeia 2006). which describes high per-formance liquid chromatography as assay procedures for bulk drug and tablets, respectively.
Correspondence to: Basavaiah K. E-mail: [email protected]
determi-nation of STV in pharmaceuticals. The drug has also been assayed by mass spectrometry (Soldin 2004) and UV-spectrophotometry (Sankar et al. 2002a).
O HO
N NH O
O
Fig. 1 – Structure of drug.
Despite its long history and established versatility, no titrimetric method has yet been reported for the de-termination of STV in pharmaceuticals. Visible spectro-photometry, because of its simplicity, speed, sensitivity, reasonable accuracy and precision, and cost-effective-ness, continues to be the preferred technique in labora-tories of developing and underdeveloped nations, which can illafford expensive chromatographic and related techniques. Three procedures (Sarma et al. 2002a) have been reported for the assay of STV in pharmaceuticals using KMnO4-Fast green FCF,
permanganate/periodate-MBTH and iron(III)chloride-ferricyanide as reagents. The same authors (2002b) have used three more reagents, NBS-celestine blue, cobalt thiocyanate and ammonium molybdate for the spectrophotometric determination of STV. A method based on oxidative-coupling reaction (Sankar et al. 2002b) involving the use of iron (III)-MBTH is also found in the literature. But, these methods suffer from one or the other disadvantage like poor sensi-tivity, heating or extraction step and/or use of expensive chemical/organic solvent.
This paper reports the use of bromate-bromide re-agent and three dyes-methyl orange, indigocarmine and thymol blue for rapid and sensitive determination of STV. The methods are based on the bromination/oxidation of the drug byin situgenerated bromine followed by es-timation of residual bromine by either iodometric back titration or by reacting with a fixed quantity of dye and measuring the change in absorbance. The methods on ap-plying to tablets and capsules yielded satisfactory results and were comparable with those of a reference method.
MATERIALS AND METHODS
Apparatus:A Systronics Model 106 digital spectropho-tometer provided with matched 1-cm quartz cells was used for all absorbance measurements. All chemicals used were of analytical reagent grade and distilled water was used to prepare all solutions.
Reagents and standards: Bromate-bromide mixture (4 mmol L−1KBrO3−40×10−3mmol L−1KBr) was
prepared by dissolving accurately weighed 0.668 g of KBrO3 (Sarabhai M Chemicals, Baroda, India) and
4.76 g of KBr (Indian Drugs and Pharmaceuticals Ltd, Hydrabad, India) in water and diluting to 1 litre in a calibrated flask, and the reagent was used in titrimetric work. A 0.024 mol L−1 sodium thiosulphate solution
was prepared by dissolving about 5.96 g of chemical (Sisco Chem. Industries, Mumbai, India) in 1 litre of water. A 10% potassium iodide solution was prepared by dissolving 10 g of salt (Merck Chemicals, Mumbai, India) in 100 mL of water. To prepare 1% starch indica-tor, 1 g of soluble starch (S.d. Fine Chem., Mumbai, India) was made into paste in water and poured into 100 mL boiling water, boiled for 1 min and cooled. For spectrophotometric investigations, a bromate-bromide solution equivalent 1000µg mL−1KBrO3and 10- fold
excess of KBr was prepared by dissolving accurately weighed 100 mg of KBrO3and 1 g of KBr in water and
di-luting to the mark in a 100 mL calibrated flask. This was then diluted stepwise to obtain working concentrations of 10, 30 and 50µg mL−1KBrO
3for use in method A,
1000µg mL−1stock standard solution of thymol blue was first prepared by dissolving accurately weighed 100 mg of dye (Loba. Chemie. Mumbai. India, 100% dye content) in water and diluting to volume in a 100 mL calibrated flask. The solution was then diluted five fold to get the working concentration of 200µg mL−1.
Standard drug solution: Pharmaceutical grade STV was received from Cipla India Ltd., (99.8% pure), as gift and was used as received. A stock standard solution containing 1 mg mL−1STV was prepared by
dissolv-ing accurately weighed 250 mg of pure drug in water and diluting to the mark in a 250 mL calibrated flask. This solution was used for titrimetric work, and for spec-trophotometric work, the same was diluted appropriately with water to get a working concentration of 5µg mL−1 for method A, and 20 and 40µg mL−1 for method B and method C, respectively.
0 0.1 0.2 0.3 0.4 0.5 0.6 0.7
0 0.5 1 1.5 2 2.5
A
bs
orba
nc
e
Concentration of drug,µg mL−1
Fig. 2 – Beer’s law curve for method A.
0 0.1 0.2 0.3 0.4 0.5 0.6 0.7 0.8
0 5 10 15
A
bs
orba
nc
e
Concentration of drug,µg mL−1
Fig. 3 – Beer’s law curve for method B.
PROCEDURES
Titrimetry:A 10 mL aliquot of pure drug solution con-taining 3.5-10 mg of STV was accurately measured and
0 0.1 0.2 0.3 0.4 0.5 0.6 0.7 0.8 0.9
0 5 10 15
A
bs
orba
nc
e
Concentration of drug,µg mL−1
Fig. 4 – Beer’s law curve for method C.
transferred into a 100 mL Erlenmeyer flask. The solution was acidified by adding 3 mL of 2 mol L−1 hydrochlo-ric acid and diluted to 15 mL with water. Ten mL of bromate-bromide reagent (4 mmol L−1w.r.t. KBrO3)
was pipetted into the flask, the flask was stoppered, the contents mixed and let stand for 10 min with occasional swirling. Finally, 5 mL of 10% potassium iodide so-lution was added, and the liberated iodine was titrated against 0.024 mol L−1thiosulphate solution using starch as indicator towards the end point. A blank titration was performed, and the amount of drug in the mea-sured aliquot was calculated from the amount of KBrO3
reacted with drug.
Spectrophotometric method A: Different aliquots (0.25, 1.0, 1.5,. . . 3.5 mL) of a standard 5 µg mL−1
STV solution were transferred into a series of 10 mL calibrated flasks by means of a micro burette and the total volume was adjusted to 4 mL by adding ade-quate quantity of water. To each flask were added 1 mL each of 5 mol L−1 HCl and bromate-bromide solution (10µg mL−1in KBrO3), the last being measured
ac-curately. The flasks were stoppered, content mixed and let stand for 20 min with occasional shaking. Finally, 1 mL of 50µg mL−1methyl orange solution was added (accurately measured) and the volume was diluted to the mark with water and mixed well. The absorbance of each solution was measured at 510 nm against a reagent blank after 5 min.
Spectrophotometric method B: Varying aliquots (0.5,1.0,. . . 5.0 mL) of a standard 20 µg mL−1 STV
volume was brought to 5 mL by adding water. To each flask were added 1 mL of 5 mol L−1hydrochloric acid and 1.5 mL of bromate-bromide solution (30µg mL−1 in KBrO3)by means of a micro burette. The content was mixed well and the flasks were kept aside for 10 min with intermittent shaking. Finally, 1 mL of 200µg mL−1indigo carmine solution was accurately measured
and added to each flask, the volume was diluted to the mark with water, mixed well and absorbance measured against a reagent blank at 610 nm after 5 min.
Spectrophotometric method C: Different aliquots (0.25, 0.5, 1.0,. . .2.25 mL) of a standard 40µg mL−1 STV solution were transferred into a series of 10 mL calibrated flasks by means of a micro burette and the total volume was adjusted to 3 mL by adding ade-quate quantity of water. To each flask were added 1 mL each of 5 mol L−1 HCl and bromate-bromide solution
(50µg mL−1in KBrO3), the last being measured
accu-rately. The flasks were stoppered, content mixed and let stand for 15 min with occasional shaking. Finally, 1 mL of 200µg mL−1thymol blue solution was added (accu-rately measured) and the volume was diluted to the mark with water and mixed well. The absorbance of each so-lution was measured at 550 nm against a reagent blank after 5 min.
In all the three spectrophotometric method, a stan-dard graph was prepared by plotting the absorbance ver-sus the concentration of STV. The concentration of the unknown was read from the calibration graph or com-puted from the regression equation derived using Beer’s law data.
PROCEDURE FORDOSAGEFORMS
Procedure for tablets/capsule:Twenty tablets/contents of capsules were weighed and ground into a fine powder. An amount of powder equivalent to 250 mg of STV was weighed into a 250 mL calibrated flask, 60 mL of water added and the mixture shaken for 20 min; then the vol-ume was made up to the mark with water, mixed well and filtered using a Whatman No. 42 filter paper. First 10 mL portion of the filtrate was discarded and a suit-able aliquot was then subjected to analysis by titrimetric method. The tablet extract (1 mg mL−1)was diluted
suit-ably with water to get working concentrations of 5, 20 and 40µg mL−1for method A, method B and method C,
respectively before subjecting to analysis by spectropho-tometric methods.
RESULTS AND DISCUSSION
The acidified solution of bromate and bromide behaves as an equivalent solution of bromine and has been widely used for the determination of many organic and inor-ganic substances. The present methods make use oxidis-ing/brominating ability, and bleaching action ofin situ
generated bromine on the dyes used.
The proposed spectrophotometric methods are in-direct and are based on the determination of the residual bromine (in situgenerated) after allowing the reaction between STV and a measured amount of bromine to be complete. The bromine was determined by reacting it with a fixed amount of methyl orange, indigo carmine or thymol blue dye. The methods make use of bleaching action of bromine on the dyes, the decolouration being caused by the oxidative destruction of the dyes.
METHODDEVELOPMENT
Titrimetry: Direct titration of STV with in situ gen-erated bromine was not successful. However, the reac-tion between the two was found to occur when the two were allowed to stand for some time, thus enabling the indirect titrimetric determination of STV. Hence, sev-eral factors like nature of acid and its concentration, re-action time, and the excess of reagent were optimized. Reproducible and stoichiometric results were obtained when 0.16 to 0.32 mol L−1hydrochloric acid concen-tration was maintained. Hence, 0.24 mol L−1acid con-centration for the oxidation step and the iodometric back titration was used in the assay. Reaction was complete in 10 min and yielded stoichiometry of 1:0.666 (STV: KBrO3), and contact times up to 20 min had no effect on the stoichiometry of the reaction. A constant molar-ratio was obtained when excess of reagent was not more than 2 times the theoretical amount. Under the optimum conditions, 3.5-10 mg of STV could be determined with good accuracy and precision with reaction stoichiometry of 1:0.666.
bromine. When a fixed concentration of dye is added to decreasing concentrations of bromine, a concomitant increase in the concentration of dye results. Conse-quently, a proportional increase in the absorbance at the respectiveλmaxis observed with increasing concentra-tion of STV.
Preliminary experiments were performed to fix the upper concentrations of the dyes that could be deter-mined spectrophotometrically, and these were found to be 5, 20 and 20 µg mL−1 for methyl orange, indigo carmine and thymol blue respectively. A bromate con-centration of 1 µg mL−1 in the presence of excess of bromide was found to bleach the red colour due to 5µg mL−1methyl orange whereas 4.5 and 5.0µg mL−1
bromate was required to destroy the blue and violet col-our due to 20µg mL−1each of indigocarmine and thy-mol blue, respectively. Hence, different concentrations of STV were reacted with 1 mL of 10µg mL−1KBrO3
in method A, 1.5 mL of 30µg mL−1KBrO3in method
B and 1 mL of 50µg mL−1KBrO3in method C
respec-tively, followed by determination of residual bromine as described under the respective procedure.
For both steps, i.e., the reaction between STV and bromine, and the determination of the latter by reacting with the dye, HCl medium was found to be ideally suited. One mL of 5 mol L−1acid in a total volume of about 5-7 mL was used in all the methods and the same quantity of acid was maintained for the bleaching step. Reaction times of 20, 10 and 15 min are not critical for method A, method B and method C. respectively, and any de-lay up to 30 min did not affect the absorbance reading. A 5 min standing time was found necessary for the com-plete bleaching of the dye colour by the residual bromine. The absorbance of each dye colour was constant for sev-eral hours even in the presence of reaction product.
Analytical data: A linear correlation was found be-tween absorbance atλmaxand concentration of STV in
the ranges given in Table I. The graphs showed negligi-ble intercept as described by the regression equation:
Y =a+b X
(where Y = absorbance of 1-cm layer of solution; a = intercept; b = slope and X = concentration in µg mL−1). Regression analysis of the Beer’s law data
us-ing the method of least squares was made to evaluate
the slope (b), intercept (a) and correlation coefficient (r) for each system and the values are presented in Table I. The optical characteristics such as Beer’s law limits, mo-lar absorptivity and Sandell sensitivity values of all the three methods are also given in Table I. The limits of detection (LOD) and quantitation (LOQ) calculated ac-cording to ICH guidelines (ICH Harmonised Triplicate Guideline 1996) are also presented in Table I and reveal the very high sensitivity of the methods.
Method validation:To evaluate the accuracy and intra-day precision of the methods, pure drug solution at three different levels (concentrations) was analysed, each de-termination being repeated seven times. The relative er-ror (%) and relative standard deviation (%) were less than 3.0 and indicate high accuracy and precision of the meth-ods (Table III). For a better picture of reproducibility on a day-to-day basis, a series of experiments was performed in which standard drug solution at three different levels was determined each-day for five days with all solutions being prepared afresh each day. The day-to-day relative standard deviation values were in the range of 2.0-3.5% and represent the best appraisal of repeatability of the proposed methods.
APPLICATION
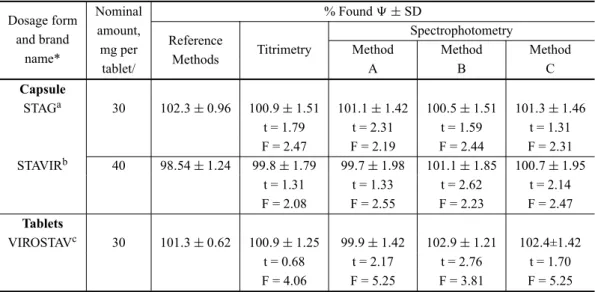
Three brands of STV tablets/capsules in 30 and 40 mg strength are currently available in the Indian market. The validity of the methods was checked by applying them to assay in two brands of capsules and one brand of tablets. Table IV gives the results of assay and reveal that there is close agreement between the results obtained by the proposed methods and the label claim. The results were also compared statistically with those obtained by a literature method (Sankar et al. 2002a) by applying Stu-dent’s t-test for accuracy and F-test for precision. At the 95% confidence level, the calculated t- and F-values did not exceed the tabulated values (t = 2.77 and F = 6.39) suggesting that the proposed methods are as accurate and precise as the literature method.
TABLE I
Comparison of performance characteristics of proposed methods with the existing spectrophotometric methods.
Sl
Reagent* λmax, Linear range, ∈, L mol−1cm−1 Remarks Ref.
No. nm µg mL−1
1. a) KMnO4-FG FCF 640 1–8 1.28×10⁴ Uses an oxidant, which Sarma et al. 2002a
is unstable in solution b) NaIO4-MBTH 620 0.6–6.0 2.02×10⁴ Use an expensive chemical
c) Iron (III)-ferricyanide 740 9.0–75.0 1.24×10³
2. a) NBS-celestine blue 540 0.7–6.0 1.6×10⁴ Uses an unstable solution Sarma et al. 2002b b) Cobalt thiocyante 610 1.5–15.0 7.7×10³ Involves extraction step
with organic solvent c) Ammonium molybdate 700 11–150 1.0×10³ Requires heating;
least sensitive
3. Iron (III)-MBTH Sankar et al. 2002b
4. a) BrO−3-Br−-Methyl orange 520 0.125–1.75 3.94×10⁴ No heating or
b) BrO−3-Br−-Indigo carmine 610 1–10 1.45×10⁴ extraction step, uses Present methods c) BrO−3-Br−-Thymol blue 550 1–9 1.99×10⁴ stable solution
*FGFCF = Fast green FCF; MBTH = 3-methylbenzothiazolinone hydrazone; NBS = N-bromosuccinimide.
TABLE II
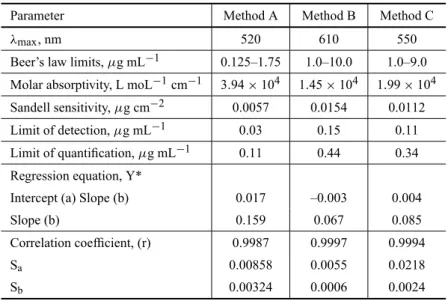
Quantification and regression characteristics of spectrophotometric methods.
Parameter Method A Method B Method C
λmax, nm 520 610 550
Beer’s law limits,µg mL−1 0.125–1.75 1.0–10.0 1.0–9.0 Molar absorptivity, L moL−1cm−1 3.94×10⁴ 1.45×10⁴ 1.99×10⁴ Sandell sensitivity,µg cm−2 0.0057 0.0154 0.0112 Limit of detection,µg mL−1 0.03 0.15 0.11 Limit of quantification,µg mL−1 0.11 0.44 0.34 Regression equation, Y*
Intercept (a) Slope (b) 0.017 –0.003 0.004
Slope (b) 0.159 0.067 0.085
Correlation coefficient, (r) 0.9987 0.9997 0.9994
Sa 0.00858 0.0055 0.0218
Sb 0.00324 0.0006 0.0024
*Y = a+bX, where Y is the absorbance and X concentration inµg mL−1. Sa= Standard
deviation of intercept. Sb= Standard deviation of slope.
drug added was quantitative (97.7-104.2%) and re-vealed that co-formulated substances such as talc, starch, gelatin, gum acacia, calcium carbonate, calcium gluconate, calcium dihydrogen orthophosphate, sodium alginate and magnesium stearate did not interfere in the determination.
CONCLUSIONS
TABLE III
Intra-day accuracy and precision of the methods.
Method* STV STV Range Relative SD SEM RSD, CL
taken found, ** error, % %
4.0 3.93 0.14 1.75 0.033 0.013 0.84 3.93±0.031 Titrimetry 6.0 5.85 0.18 2.50 0.134 0.051 2.29 5.85±0.124 9.0 8.82 0.12 2.00 0.054 0.020 0.61 8.82±0.049 Spectro- 0.5 0.49 0.07 1.70 0.005 0.002 0.96 0.49±0.010 photometric 1.0 0.98 0.05 1.48 0.008 0.003 0.85 0.98±0.021 method A 1.5 1.47 0.07 1.45 0.017 0.006 1.14 1.47±0.025 Spectro- 3.0 2.93 0.07 2.33 0.033 0.013 1.13 2.93±0.031 photometric 6.0 5.85 0.05 2.45 0.064 0.024 1.09 5.85±0.059 method B 9.0 8.89 0.07 1.18 0.076 0.029 0.85 8.89±0.070 Spectro- 2.0 1.95 0.07 2.50 0.029 0.011 1.49 1.95±0.027 photometric 4.0 3.89 0.05 2.75 0.036 0.014 0.93 3.89±0.033 method C 8.0 7.92 0.07 1.03 0.065 0.025 0.82 7.92±0.060
*In titrimetry taken/found/range, SD and SEM are in mg while in spectrophotometric methods the they are in µg mL−1. **Mean value of seven determinations SD = Standard deviation; SEM = Standard mean of error; RSD = Relative standard deviation; and CL = Confidence limits at 95% confidence level for six degrees of freedom.
TABLE IV
Results of assay of STV in dosage forms by proposed methods and statistical comparision with reference method.
Dosage form Nominal % Found±SD
and brand amount, Spectrophotometry
name* mg per
Reference
Titrimetry Method Method Method
tablet/ Methods A B C
Capsule
STAGa 30 102.3±0.96 100.9±1.51 101.1±1.42 100.5±1.51 101.3±1.46 t = 1.79 t = 2.31 t = 1.59 t = 1.31 F = 2.47 F = 2.19 F = 2.44 F = 2.31 STAVIRb 40 98.54±1.24 99.8±1.79 99.7±1.98 101.1±1.85 100.7±1.95
t = 1.31 t = 1.33 t = 2.62 t = 2.14 F = 2.08 F = 2.55 F = 2.23 F = 2.47
Tablets
VIROSTAVc 30 101.3±0.62 100.9±1.25 99.9±1.42 102.9±1.21 102.4±1.42 t = 0.68 t = 2.17 t = 2.76 t = 1.70 F = 4.06 F = 5.25 F = 3.81 F = 5.25
TABLE V
Results of recovery study via standard-addition method.
Method Tablet STV in Pure STV Total Pure STV studied formulation added found recovered*, %
Titrimetry VIROSTAV
3.03 2.0 5.08 102.5
30 3.03 4.0 7.08 101.2
3.03 6.0 8.95 98.6
Spectro- 5.00 3.0 8.08 102.5
photometric 5.00 7.0 12.08 101.2
method A 5.00 9.0 13.87 98.6
Spectro- 20.58 20.0 40.52 99.7
photometric 20.58 40.0 59.90 98.3
method B 20.58 80.0 101.06 100.6
Spectro- 10.24 20.0 30.88 103.2
photometric 10.24 40.0 49.52 98.2
method C 10.24 80.0 90.64 100.5
*Mean value of three determinations. In titrimetry STV in dosage form/pure STV added are in mg. In spectrophotometric methods the same are inµg.
for stavudine and are superior to the existing HPLC and UV-spectrophotometric methods. They rely on the use of simple and cheap chemicals, and inexpensive techniques but provide a sensitivity comparable to that achieved by sophisticated and expensive technique like HPLC. These advantages coupled with good accuracy and precision make the methods highly suitable for routine use in lab-oratories as a part of industrial quality control.
ACKNOWLEDGMENTS
The authors express their gratitude to Cipla India Ltd., Bangalore for supply of pure stavudine as gift. Three of the authors (VRK, BCS and URA) thank the author-ities of the University of Mysore, Mysore, for facilauthor-ities. VRK is grateful to the Principal Secretary, Department of Health and Family Welfare, Government of Karnataka, Bangalore, for permission.
RESUMO
Este trabalho descreve quatro métodos rápidos e sensíveis
para a determinação de estavudina (STV) na matéria-prima
ou em produtos formulados. Soluções aquosas de STV po-dem ser tituladas tratando-as com excesso de bromato-brometo
em meio ácido clorídrico, seguido da determinação iodimétrica
de bromo em excesso. Métodos espectrofotométricos também
envolvem a adição de excesso de bromato-brometo à
amos-tra, seguida da determinação de bromo residual por adição de
uma quantidade fixa de alaranjado de metila, índigo-carmim
ou azul de timol, e de medidas de absorbância nos
comprimen-tos de onda apropriados: 520, 610 ou 550 nm. Em todos os
métodos, a quantidade de bromato consumida corresponde à quantidade de STV e os resultados da sua aplicação à
determi-nação de STV em comprimidos e cápsulas são satisfatórios.
Palavras-chave:determinação de estavudina, titulometria,
es-pectrofotometria, bromato-brometo, corantes, fármacos.
REFERENCES
BAZY V, MORIN P, COURBE P, LELEU G AND AGRO
-FOGLIO L. 2005. Simultaneous analysis of several an-tiretroviral nucleosides in rat-plasma by high performance liquid chromatography with uv using acetic acid/hydro-xylamine buffer. J Chromatogr B 821: 132–143.
COMPAINS, SCHLEMMERD, LEVIM, PRUVOSTA, GOU
-JARDC, GRASSIJANDBENECHH. 2005. Development and validation of a liquid chromatographic/tandem mass spectrometric assay for the quantitation of nucleoside HIV reverse transcriptase inhibitors in biological matrices. J Mass Spectro 40: 9–18.
CONTRERAS J, GONZALEZ H MA, MENENDEZ R AND
anal-ysis of D and T (stavudine) in rat plasma. J Chromatogr B 801: 199–203.
DJURDJEVIC P, LABAN A, MARKOVIC S AND JELIKIK -STANKOV M. 2004. Chromometric optimization of a RP-HPLC method for the simultaneous analysis of aba-cavir, lamivudine and zidovudine in tablets. Anal Lett 37: 2649–2667.
DUNGE A, SHARDA N, SINGH B AND SINGH S. 2005. Establishment of inherent stability of stavudine and de-velopment of a validated stability-indicating HPLC assay method. J Pharm Biomed Anal 37: 1115–1119.
FAN B ANDSTEWART JT. 2002. Determination of stavu-dine/didanosine/saquinavir and stavudine/didanosine/efa-virenz in human serum by micellar electrokinetic chro-matography. J Liq Chromatogr Rel Technol 25: 937–947.
FANB. BARTLETTMGANDSTEWARTJT. 2002. Determi-nation of lamivudine/stavudine/efavirenz in human serum using liquid chromatography/electrospray tandem mass spectrometry with ionization polarity switch. Biomed Chromatogr 16: 383–389.
HUANG Y, ZURLINDEN E, LIN E, LI X, TOKUMOTO J, GOLDEN J, MURR A, ENGSTORM J AND CONTE J. 2004. Liquid chromatographic-tandem mass spectromet-ric assay for the simultaneous determination of didanosine and stavudine in human plasma, Branchoalveolar lavage fluid, alveolar cells, periphera blood mononuclear cells, seminal plasma, cerebrospinal fluid and tonsil tissue. J Chromatogr B 799: 51–61.
KAULN, AGARAWALH, PARADKARARANDMAHADIK
KR. 2005. The ICH guideline in practice: Stress degra-dation studies on stavudine and development of a vali-dated specific stability-indicating HPTLC assay method. J Chromatogr Sci 43: 4016–415.
PAINRANDDESAIAS. 2003. Simultaneous estimation of some antiretroviral drugs from tablets by reverse phase HPLC method. Indian Drugs 40: 111–114.
PEREIRAEA, MKKEGAANDTAVARESMFM. 2005. De-termination of antiretroviral agents in human serum by capillary electrophoresis. J Chromatogr A 1091: 169– 176.
RAICESRSL, SALVADORIMC, ESTRELARCE, DEAQUIN
NETOFR ANDSQUREZ-KURTZ G. 2003. Determina-tion of stavudine in human serum by on-line solid-phase extraction coupled to HPLC with electrospray ionization tandem mass spectrometry: application to a bioequiva-lence study. Rapid commun Mass Spectro 17: 1611–1618. REZK NL, TIDWELL RR, RICHARD R AND KASHUBA
ADM. 2003. Simultaneous determination of six HIV
nucleoside analogue reverse transcriptase inhibitors and nevirapine by HPLC with ultraviolet absorbance detec-tion. J Chromatogr B 791: 137–147.
SABLONM, CONTRERASJ, DIAZO, PEREZR, VELEZH
ANDRODRIGUEZ-TANTYC. 2004. Quantification of an antiviral drug (d 4T) by an HPLC procedure. Acta Pharma Bona 23: 81–88.
SANKAR DG, REDDY MVVN, KUMAR JMR AND
MURTHYTK. 2002a. uv spectrophotometric determina-tion of some anti-HIV drugs. Asian J Chem 14: 433–436.
SANKAR DG, REDDY MVVN, KUMAR JMR AND
MURTHYTK. 2002b. Spectrophotometric determination of lamivudine and stavudine. Indian J Pharm Sci 64: 504–506.
SARMACSN, SASTRICKANDSASTRYCSP. 2002a. Sim-ple oxidimetric methods for determination of stavudine or lamivudine. Asian J Chem 14: 683–690.
SARMACSN, SASTRICKANDSASTRYCSP. 2002b. De-termination of stavudine and lamivudine by visible spec-trophotometry. Acta Ciencia Indica Chem 28: 221–225.
SOLDINSJ. 2004. Anti-retroviral analysis by mass spectrom-etry. PCT Int Appl Patent No. Wo 2004089182.
THEMERCKINDEX. 1996. 12th ed., Merck and Co. Inc, White House Station. NJ, p. 1502.
THE UNITED STATES PHARMACOPOEIA. 2006. United States Pharamcopoeial Convention Inc., Rockville, p. 2005–2007.
TRAN TT, ROBBINS BL, PINKERTON FH, FERRUA B, GRASSIJANDFRIDLANDA. 2003. A new sensitive car-tridge-RIA method for determination of stavudine (D4T) triphosphate in human cells in vivo. Antiviral Res 58: 125–129.
VERWEIJ-VAN WISSEN CPWGM, AARNOUTSE REAND
BURGERDM. 2005. Simultaneous determination of the HIV nucleoside analogue reverse transcriptase inhibitors lamivudine, didanosine, stavudine, zidovudine and aba-cavir in human plasma by reverse phase HPLC. J Chro-matogr B 816: 121–129.
VOLOSOV A, ALEXANDER C, TING L ANDSOLDIN SJ. 2002, Simple rapid method for quantification of antiretro-virals by liquid chromatography-tandem mass spectrome-try. Clin Biochem 35: 99–103.
WIESNERJL, SUTHERLANDFCW, SMITMJ,VANESSEN
GH, HUNDTHKL, SWARTKJANDHUNDTAF. 2002. Sensitive and rapid liquid-chromatography-tandem mass spectrometry method for the determination of stavudine in human plasma. J Chromatogr B 773: 129–134.
ZHANGMANDCENJ. 2003. Determination of stavudine and its related substances by HPLC. Zhongguo Yiyao Gongye Zazhi 34: 402–403.