Influence of crystalline structure on the luminescence properties
of terbium orthotantalates
Kisla P.F. Siqueira
a, Alexandre P. Carmo
b, Maria J.V. Bell
c, Anderson Dias
a,naDepartamento de Quı´mica, Universidade Federal de Ouro Preto, Campus Morro do Cruzeiro, ICEB II, Ouro Preto 35400-000, Minas Gerais, Brazil
bInstituto Federal Fluminense, Campus Cabo Frio, RJ 28909-971, Brazil
c
Departamento de Fı´sica, Universidade Federal de Juiz de Fora, Juiz de Fora 36036-330, MG, Brazil
a r t i c l e
i n f o
Article history:
Received 22 October 2012 Received in revised form 30 January 2013 Accepted 6 February 2013 Available online 14 February 2013
Keywords:
Terbium orthotantalates Luminescence Crystal structures Spectroscopic properties
a b s t r a c t
Terbium orthotantalate powders were produced with M-fergusonite type (I2/a) and M0-fergusonite type (P2/a) structures. The samples were studied by X-ray diffraction, Raman scattering, and photoluminescence measurements (emission and decay curves). The results showed that crystalline materials were obtained with all the 18 Raman-active modes predicted by group theory calculations. Also, it was observed through photoluminescence decay curves that the Tb3þions occupies only one-symmetry site in both crystallographic arrangements. Photoluminescence emission curves exhibited some variation in spectral shape, peak position, and relative intensity as a consequence of their different crystalline arrangements. The dominated emission of Tb3þ (5D
4-7F5) is centered with a maximum intensity at 549.2 nm (M-type) and 543.0 nm (M0-type). Fluorescence lifetimes for M-TbTaO4and M0-TbTaO4were determined as 33.4ms and 1.25 ms, respectively. M0-type materials seems to be the most suitable for luminescent devices and could be a potential green luminescent material due to the strongest emission if compared with the M-fergusonite type.
&2013 Elsevier B.V. All rights reserved.
1. Introduction
The development of luminescent inorganic materials has been subject of extensive research in the past years because of their applications in devices involving the artificial production of light[1]. In this respect, rare earths are good candidates for luminescence center due to their special 4f intra-shell transitions[2]. Particularly, terbium ions are widely used as efficient emission centers in many oxide-based compounds, having relatively high transition probabil-ities originating from the 4f electron configuration[3]. The strong green emission with high glow purity and stability make terbium-doped phosphors to be suitable for many technological applications, such as cathode-ray tubes, fluorescence lamps, X-ray image devices, scintillators, light emitting diodes, and field emission displays[4]. Then, a large number of studies have been devoted to terbium-doped oxide matrices[5–12]. Among them, Tb3þ activated tanta-lates have attracted much attention because it is a promising alternative phosphor for X-ray intensifying screen[13]. The fluor-escent properties of rare earth tantalates and niobates were firstly reported in[14]. Undoped tantalates and niobates themselves have been well known as self-activated luminescent materials [15]. Nevertheless, to the best of our knowledge, no work concerning terbium orthotantalates in self-activated materials was previously reported in the literature so far.
In the present work, M-TbTaO4 and M0-TbTaO4 self-activated ceramics were prepared by solid-state reaction. It is well known that the synthesis parameters strongly influence on the degree of the crystalline order of the ceramics and in the same cases it might results in different structural arrangements [16,17]. Furthermore, the crystal structure is directly related with the luminescence performance of the materials[6]. In this work, specific conditions of temperature and time were employed to compounds crystallized in monoclinic structures with two different arrangements in agree-ment with the previous work by Siqueira et al.[16]. In this case, the compounds crystallize in M-fergusonite (M-type) structure with space group I2/a (#15) when processed at high temperatures, and M0-fergusonite (M0-type) with space group P2/a (#13) for
com-pounds obtained at low temperatures. The crystalline structures were investigated by X-ray diffraction (XRD) and Raman scattering. Furthermore, the photoluminescence (PL) properties of each sample were studied in detail by both PL emission and decay time measurements, in order to correlate these characteristics with the corresponding crystalline structures. Finally, we will compare the optical properties of self-activated terbium orthotantalates studied in this work with other Tb3þ-doped materials.
2. Experimental
TbTaO4 ceramic powders were prepared by solid-state reac-tion. The starting materials employed were Tb4O7 and Ta2O5 (499.9% Sigma-Aldrich), which were thoroughly mixed in a
Contents lists available atSciVerse ScienceDirect
journal homepage:www.elsevier.com/locate/jlumin
Journal of Luminescence
0022-2313/$ - see front matter&2013 Elsevier B.V. All rights reserved. http://dx.doi.org/10.1016/j.jlumin.2013.02.016
n
Corresponding author. Tel.:þ55 31 35591716; fax:þ55 31 35591707.
E-mail addresses:anderson_dias@iceb.ufop.br,
mortar according to the desired stoichiometric ratio. The experi-mental processing conditions were 13001C/6 h to produce M-TbTaO4, and 12001C/6 h to obtain M0-TbTaO4. The crystalline structures of the as-synthesized samples were studied by XRD using a Shimadzu D-6000 diffractometer with graphite mono-chromator and a nickel filter in the range of 10–6012
y
(15 s/step of 0.0212y
), operating with FeKaradiation (l
¼0.1936 nm), 40 kVand 20 mA (the results were automatically converted to CuKa
radiation for data treatment and manipulation).
Raman spectra of the as-synthesized powders were collected in backscattering configuration using an Horiba/Jobin-Yvon LABRAM-HR spectrometer with the 632.8 nm line of a helium-neon laser (effective power of 6 mW at the sample’s surface) as excitation source, diffraction gratings of 600 and 1800 grooves/ mm, Peltier-cooled CCD detector, confocal Olympus microscope (100objective), and experimental resolution typically 1 cm1 for 10 accumulations of 30 s. Appropriate interference filter for rejecting laser plasma lines, edge filter for stray light rejection were used. All resulting spectra were corrected by Bose–Einstein thermal factor[18].
The emission spectra were acquired at room temperature on a DIGIKROM480 Tzerny Turner monochromator with resolution of 1 nm, excited by a He–Cd laser (325 nm, 40 mW). The lumines-cence signal was acquired by a photomultiplier model (R928), operating in the range from 400 to 900 nm or an InGaAs detector, in the range from 800 to 1700 nm. Signal was amplified by a SRS 530 lock-in with reference signal provided by an optical chopper (SR540), operating in the range from 5 to 4000 Hz and collected by a computer. Luminescence decay curves were obtained in the same experimental setup of the luminescence experiments, where the SRS lock-in was substituted by a SR445A 350 MHz Preamplifier and the amplified signal was collected by a computer. The excitation laser was pulsed by the use of a chopper, with frequencies in the range from 10 to 100 Hz.
3. Results and discussion
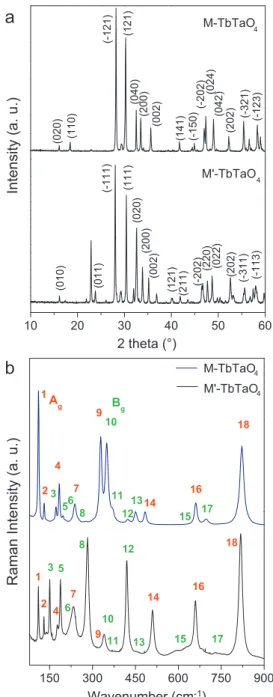
The terbium orthotantalates produced were studied through XRD and Raman scattering and the results are presented inFig. 1. The samples crystallized in fergusonite-type structures, but with different arrangements as a function of the synthesis temperature
(Fig. 1a). At high temperatures (13001C), the powders exhibited the
M-type structure, belonging to the space group I2/a (C6
2h, #15), with Z¼4. On the other hand, at low temperatures (12001C) the powders exhibited the M0-type structure, space group P2/a (C4
2h, #13), and Z¼2. XRD patterns were indexed according to ICSD-109187 and ICSD-415434 for M-TbTaO4 and M0-TbTaO4, respectively. For the polymorphs studied in this work, it is well known that the atoms occupy different Wyckoff positions. For the M-TbTaO4(I2/a, #15) material, the atoms Tb and Ta occupy the position 4ewhile the two oxygen occupy the 8f sites. For the M0-TbTaO
4ceramic (P2/a, #13), the Wyckoff positions are as follows: Tb¼2f, Ta¼2e, O(1) and O(2)¼4g. Due to these occupation sites, the Raman-active modes for these two systems can be decomposed according to the irreducible representation (i.r.) of the C2point-group. Then, using the site-group
method of Rousseau et al.[19]we obtained the same distribution of the degrees of freedom at Brillouin-zone center in terms of the i.r. for the two arrangements, as following:
G
TOTAL¼8Agþ10Bgþ8Auþ10Bu ð1ÞFig. 1b presents the Raman spectra for the samples
investi-gated: the blue spectrum corresponds to the M-TbTaO4ceramic, while the black spectrum is related to the M0-TbTaO
4 sample. Although the materials exhibited an equal number of Raman-active modes, they present different Raman signatures. All the 18
active modes can be visualized and were numbered (Fig. 1b) for better visualization and assignment: red numbers correspond to theAgmodes, while green numbers correspond to theBgmodes. If
we compare the spectra of M- and M0-TbTaO
4, we can observe a change of the relative intensities of the modes through the transition from M-fergusonite to M0-fergusonite. This difference
could be attributed to the new structural arrangement assumed by the sample when it changes from one structure to another. Furthermore, if we observe the assignment to the active Raman modes of these fergusonite-type structures (seeFig. 1b), we can assume that the crystalline arrangement regarding the M-type structure seems to favor the Ag modes, while the arrangement
observed in M0-type structures seems to favor theB gmodes.
(020)
(-113)
(-311)
(202)
(022)
(220)
(-202)
(121) (211)
(002)
(200)
(020)
(111)
(-111)
(011)
(010)
M'-TbTaO4
2 theta (°)
(-123)
(-321)
(202)
(042)
(024)
(-202)
(-150)
(141)
(002)
(200)
(040)
(121)
(-121)
(110)
M-TbTaO4
Intensity (a. u.)
10 20 30 40 50 60
150 300 450 600 750 900
18
17
16
15
14
13 12
11 10
9
8
7
6 5
4
3
2 1
M'-TbTaO4
Wavenumber (cm
-1)
BgA g
18
17
16
15
14
13 12 11 10
9
8
7
6 5
4
3
2 1
M-TbTaO4
Raman Intensity (a. u.)
Fig. 1.(a) XRD patterns for M-TbTaO4 and M0-TbTaO4 with the respective
crystallographic planes indexed. (b) Raman spectra for the M-type (blue) and M0-type (black) compounds in the region 60–900 cm1
. The Raman-active modes are numbered for better visualization and assignment. Red numbers represent the
Agmodes, while green numbers correspond to theBgmodes. (For interpretation of
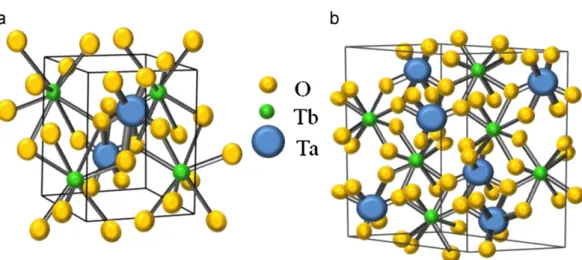
The main difference between the two arrangements M- and M0-type is in the coordination of Ta atom, which is four for the
M-type structure and six for M0-type structure. Thus, in the M-type
structure the Ta atoms have a tetrahedral coordination, while a distorted octahedron is observed in M0-type structures [8,16].
Furthermore, the average Ta–O distance is longer in the M-type structure, which results in a higher unit cell volume for this arrangement. Table 1 presents the lattice parameters calculated and unit cell volumes for both samples. Aiming a better comparison between the two arrangements,Fig. 2presents a schematic repre-sentation for both structures: (a) M0-TbTaO
4, and (b) M-TbTaO4. The atomic distribution inside the M-TbTaO4structure is as follows: four Tb atoms, four Ta atoms and sixteen oxygen atoms. On the other hand, for the M0-TbTaO
4 materials, the atoms inside the structure are distributed as follows: two Tb, two Ta and eight oxygen.
Now, we will discuss the photoluminescence emission beha-vior of the terbium orthotantalate powders. Terbium ions are efficient emission centers (mainly of green light), but generally they are used as a dopant in a host lattice, e.g., GdTaO4:Tb3þ, YTaO4:Tb3þ, and LuTaO4:Tb3þ[2,5,7]. In this work, we decided to investigate the behavior of M-TbTaO4and M0-TbTaO4 materials, which can be denominated self-activated compounds. In these systems, Tb3þ ions are not dopants and new emission centers resulting of the presence of other lanthanides could not be created. The systems containing terbium ions generally have three kinds of energy transitions: f–f intra-configurational transi-tions from Tb3þ; 4fn
-4fn15d inter-configurational transitions
and charge transfer transitions (CT). In this last case, the TaO43 group can absorb the excitation energy through O2
-Ta5þ
charge transfer transitions (called Charge Transfer Band) and transfer the energy to the Tb3þ ion.
For the Tb3þions with 4f8electronic configuration, the ground states are7F
6. When one electron is promoted to the 5d shell, it
gives rise to two 4f75d excitation states: the high-spin state with 9D
J configuration or the low-spin state with 7DJ configuration.
Obviously, 9D
J states will be lower in energy according to the
Hund’s rule, and the transitions between 7F
6 and 7DJ are
spin-allowed, while the transitions between 7F
6 and 9DJ are
spin-forbidden. Therefore, Tb3þ
in a specific host lattice usually exhibits two groups of 4f-5d transitions: the spin-allowed
4f-5d transitions are strong and occur at higher energy, while
the spin-forbidden 4f-5d transitions are weak and occur at
lower energy[20]. In this work, PL excitations were not carried out because the focus of our work is related to samples with practical applications on the visible (VIS) spectral range. Thus, the behavior of high energy bands related with terbium orthotanta-lates will be reported in future works.
Fig. 3 presents the luminescence emission spectra of the
M-type (Fig. 3a) and M0-type structures (Fig. 3b) in the range
from 450 nm to 750 nm (
l
em¼325 nm). He–Cd laser spectrum is also included to eliminate its contribution. The emission peaks are composed by typical transitions of Tb3þ, in agreement with other Tb3þ-doped materials also reported in the literature [2,5,7]. Excitation in the green and red regions is achieved by near UV excitation of the5D3level at 325 nm. After, non radiative decays to the5D
4level, transitions to the7FJ(J¼6, 5, 4, 3, 2) manifolds
results in the emissions centered at about 490, 545, 580, 620 and 658 nm, as identified in theFig. 3. All the transitions observed in these spectra are result of f–f intra-configurational transitions from Tb3þ. The spin-forbidden 4f
-5d transition of Tb3þ at
longer wavelengths was not observed because this transition is too weak to be observed (Fig. 3). Also, the blue emission at wavelengths below 489 nm originating from the5D
3-7FJ
transi-tion of Tb3þ
ions have not been observed. This can be explained by the well-know cross-relaxation between the 5D
3 and 5D4 of Tb3þ at higher Tb3þ doping concentration[20,21]. As the Tb3þ concentration in M- and M0-TbTaO
4is high, the cross-relaxation mechanism produces rapid population of the 5D4 state at the expense of5D
3, giving rise to the strong green emission at around 545 nm[21].
Fig. 4presents the emission spectra for the M0-TbTaO
4(black lines) and M-TbTaO4(red lines) ceramic powders. In this figure, three different transitions were analyzed: 5D
4-7F6 (Fig. 4a),
5D
4-7F5 (Fig. 4b), and 5D4-7F3 (Fig. 4c). The spectra were
normalized for a comparison purpose between relative intensity of samples (see the intensity scales). The dominant emission under 325 nm excitation corresponds to the 5D
4-7F5 green transition. This transition has a maximum located at 543.0 nm in M0-type and at 549.2 in M-type sample. For the other
Table 1
Lattice parameters and unit cell volumes for the terbium orthotantalates in two crystallographic arrangements (M- and M0-type).
Polymorphic form
Synthesis temperature (1C)
Lattice parameters V ( ˚A3 )
a ( ˚A) b ( ˚A) c ( ˚A) b (1)
M0-TbTaO 4P2/a
(#13)
1200 5.333 5.489 5.136 96.7 150.37
M-TbTaO4I2/a
(#15)
1300 5.066 11.009 5.042 92.3 281.18
Fig. 2.Schematic representation of the basic structures to terbium orthotantalates: (a) M0-TbTaO
transitions (5D4-7F6 and 5D4-7F3), the maxima can also be easily visualized inFig. 4. We can observe that some distinction in the peak position occurs, and blue shifts could be observed in
the M0-type spectra in comparison with the M-type spectra. A
significant difference between the relative intensity is observed for the5D
4-7F3 transitions (seeFig. 4c). We believe that these shifts in the peak positions as well as all the variation in spectral shape and relative intensity could be caused by the differences in the crystallographic structures. According to the literature, the structural characteristics of the M0-type arrangements favor the
crystalline field that result in a more efficient energy transfer for the M0-type when compared to the M-type samples[8].
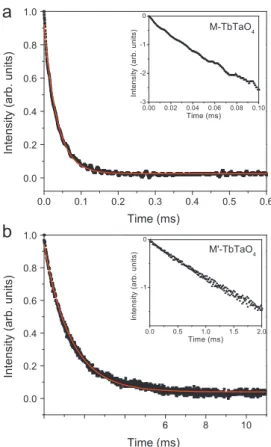
PL decay curves were obtained from kinetic measurements and they are also an important parameter for luminescence materials. The decay of the PL intensity was monitored after the excitation interruption and, on the basis of the exponential formula, the fluorescence lifetime was determined, i.e., the time after which the intensity is dropped to1
e from the initial value.
Fig. 5 shows the PL decay curves for M-TbTaO4 (Fig. 5a) and
M0-TbTaO
4 (Fig. 5b). The monitored emission wavelength was
547 nm. The transition5D
4-7F5was chosen since it presents the best signal/noise relation. Both decay curves can be fitted by single-exponential function:
I¼I0exp
t
t
, ð2Þ
whereI0 is the initial intensity att¼0 and
t
is the lifetime. Theinsets inFig. 5show the luminescence decay in logarithmic scale. As the best fits for our samples were the first-order exponential curves, it can be considered that the terbium ions occupy only one symmetry site C2 in both structures [22]. Such result is also in
agreement with results from Raman scattering, which assumes a unique symmetry as a basis for group theory calculations. Fluores-cence lifetimes for M-TbTaO4and M0-TbTaO4ceramic powders were Fig. 3.Photoluminescence emission spectra in the range 450–750 cm1
with
lexc¼325 nm. (a) M-TbTaO4(blue line); (b) M0-TbTaO4(black line). He–Cd laser
lines are also shown (red line) for comparison purposes. (For interpretation of the references to color in this figure legend, the reader is referred to the web version of this article.)
0.2 0.3 0.4 0.2 0.3 0.4
5
D4 7F6
612 616 620 624 628 632
483 486 489 492 495 498
540 544 548 552 556
0.3 0.6 0.9
5
D4 7
F5
5
D4 7
F3
Intensity (a.u.)
Wavelength (nm)
Fig. 4.Normalized emission spectra for M0-TbTaO
4(black lines) and M-TbTaO4
(red lines). (a)5D
4-7F6transition; (b)5D4-7F5transition; (c)5D4-7F3transition.
(For interpretation of the references to color in this figure legend, the reader is
referred to the web version of this article.) Fig. 5. Decay curves for the monitored emission wavelengths 547 nm (lexc¼325 nm). (a) Decay curve for M-TbTaO4; (b) decay curve for M0-TbTaO4.
determined as (33.470.9)
m
s and (1.2570.07) ms, respectively. Error in the lifetime results is estimated of about 10%. The lifetime of the M0-TbTaO4 sample is expressively higher than that for the M-TbTaO4ceramic. This can be attributed to the crystal field of the M0-type material, as already discussed previously.
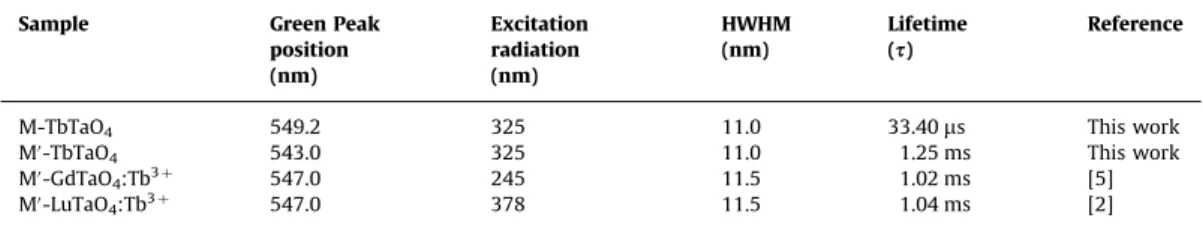
Table 2 presents a comparison of some optical properties of
self-activated orthotantalates studies in this work (M- and M0-type) and other orthotantalates materials doped with Tb3þ (M0-GdTaO
4:Tb3þand M0-LuTaO4:Tb3þ) for comparison purposes. It is important to mention that all compounds presented in
Table 2are in a powder form. This is relevant since it was already
shown that fluorescence lifetime of Tb3þ can be affected by kind of host (crystals, films, fibers, powders), which can modify the crystalline field and, consequently, the lifetimes. For instance, the GdTaO4:Tb3þphosphor presents lifetime given by 1.02 ms, 0.79 ms and 0.901 ms in powder, film and single crystal forms, respectively
[5,10]. According toTable 2, the self-activated M0-TbTaO
4samples present the higher lifetimes, while the M-TbTaO4 exhibits shorter lifetimes. It can be concluded that even in compounds where new emission centers are not created (by the addition of other lanthanides), i.e., in self-activated materials, efficient emission can be observed. In accordance with our studies, we can suggest that the new self-activated materials (like M0-TbTaO
4) can be a potential green luminescent material for applications in luminescent devices.
4. Conclusions
Terbium orthotantalates (M- and M0-type structures) were
successfully synthesized by solid-state reaction. XRD and Raman results have proved the crystallinity of the samples and all the 18 Raman-active modes were identified and assigned, in agreement with group theory calculations. For the first time, the behavior of Tb3þ ions in self-activated orthotantalates was reported. XRD, Raman scattering and PL measurements (emission and decay curves) have shown that our samples present different structures and, consequently, different optical properties. The emission spectra of the ceramic powders under 325 nm excitation were obtained and the emission peaks are composed by typical transi-tions of Tb3þ from5D
4level to7FJ(J¼6, 5, 4, 3, 2). Differences in
the Stark splitting and fluorescence lifetimes of M- and M0-TbTaO
4 were evidenced. PL emission spectra (
l
exc¼325 nm)exhibited green emission with maximum position at around 549.2 and 543.0 nm for M- and M0-type structures, respectively,
corresponding to the5D
4-7F5 transitions. The fluorescence life-times were determined as 33.4
m
s for M-TbTaO4and 1.25 ms for M0-TbTaO4. It was verified that Tb3þ ions occupy only one-symmetry site (C2) in the two different arrangements, in
agree-ment with our spectroscopic results. It can be concluded that in the new self-activated TbTaO4materials efficient emission can be observed. Furthermore, M0-type samples are the most suitable for
luminescent devices and they could be a potential green lumi-nescent materials due to the strongest emission if compared with the M-type fergusonite.
Acknowledgements
The authors acknowledge the financial support from CNPq, FINEP and FAPEMIG.
References
[1] P.F.S. Pereira, M.G. Matos, L.R. Avila, E.C.O. Nassor, A. Cestari, K.J. Ciuffi, P.S. Calefi, E.J. Nassar, J. Lumin. 130 (2010) 488.
[2] W. Liu, Q. Zhang, L. Ding, D. Sun, J. Luo, S. Yin, J. Alloys Compd. 474 (2009) 226. [3] E.-J. Popovici, M. Nazarov, L. Muresan, D.Y. Noh, L.B. Tudoran, E. Bica,
E. Indrea, J. Alloys Compd. 497 (2010) 201.
[4] S. Bangaru, G. Muralidharan, J. Lumin. 130 (2010) 343.
[5] M. Gu, L. Zhu, X. Liu, S. Huang, B. Liu, C. Ni, J. Alloys Compd. 501 (2010) 371. [6] E.-J. Popovici, M. Nazarov, L. Muresan, D.Y. Noh, M. Morar, E. Bica, E. Indrea,
Radiat. Meas. 45 (2010) 300.
[7] I. Arellano, M. Nazarov, C.C. Byeon, E.-J. Popovici, H. Kim, H.C. Kang, D.Y. Noh, Mater. Chem. Phys. 119 (2010) 48.
[8] H. Zhang, Y. Wang, L. Xie, J. Lumin. 130 (2010) 2089. [9] K. Tonooka, O. Nishimura, J. Lumin. 87-89 (2000) 679.
[10] W. Liu, Q. Zhang, W. Zhou, C. Gu, S. Yin, IEEE Trans. Nucl. Sci. 57 (2010) 1287. [11] L.H. Brixner, H.-Y. Chen, J. Electrochem. Soc. 130 (1983) 2435.
[12] B. Li, Z. Gu, J. Lin, M.-Z. Su, Mater. Res. Bull. 35 (2000) 1921. [13] B. Li, Z. Gu, J. Lin, M.-Z. Su, J. Mater. Sci. 35 (2000) 1139. [14] L.H. Brixner, J. Electrochem. Soc. 111 (1964) 690.
[15] M. Nazarov, D.Y. Noh, in: New Generation of Europium and Terbium Activated Phosphors: From syntheses to applications, Pan Stanford, USA, 2011, p. 146.
[16] K.P.F. Siqueira, G.B. Carvalho, A. Dias, Dalton Trans. 40 (2011) 9454. [17] I. Hartenbach, F. Lissner, T. Nikelski, S.F. Meier, H.M-. Munz, T. Schleid,
Z. Anorg. Allg. Chem. 631 (2005) 2377.
[18] W. Hayes, R. Loudon, Scattering of Light by Crystals, Wiley, New York, 1978. [19] D.L. Rousseau, R.P. Bauman, S.P.S. Porto, J. Raman Spectrosc. 10 (1981) 253. [20] C. Duan, Z. Zhang, S. R ¨osler, S. R ¨osler, A. Delsing, J. Zhao, H.T. Hintzen, Chem.
Mater. 23 (2011) 1851.
[21] D.J. Robbins, B. Cockayne, B. Lent, J.L. Glasper, Solid State Commun. 20 (1976) 673. [22] J.L. Ferrari, A.M. Pires, M.R. Davolos, Mater. Chem. Phys. 113 (2009) 587.
Table 2
Comparison between the green peak positions, half width at half maxima (HWHM) and fluorescence lifetimes for the terbium orthotantalates and other lanthanide tantalate materials doped with Tb3þ.
Sample Green Peak
position (nm)
Excitation radiation (nm)
HWHM (nm)
Lifetime (s)
Reference
M-TbTaO4 549.2 325 11.0 33.40ms This work
M0-TbTaO
4 543.0 325 11.0 1.25 ms This work
M0-GdTaO
4:Tb3þ 547.0 245 11.5 1.02 ms [5]
M0-LuTaO