http://dx.doi.org/10.1590/S1984-46702013000500005
The great variety of beach seines reported in fish fauna characterizations in the literature hampers a comparison be-tween distinct studies. One important element of beach seines, their size, was tested by MONTEIRO-NETO & MUSICK (1994), who concluded that there is a direct relationship between the size of a net and the number of fish it catches: larger nets retain a greater number of individuals because they sample a larger area. The importance of a second element, mesh size, was discussed by JENNINGS et al. (2001). Further, GIBSON et al. (1993) discussed the importance of different sampling techniques to get a full characterization of the fish assembly at any given environment. The selection of appropriate sampling methods is a pre-requisite for the design of surveys detailing nekton assemblages. Fish populations in the littoral zone are often monitored with traditional sampling gears such as beach seines (PIERCE et al. 1990, LAPOINTEet al. 2006). A seine net of appropriate design is a simple, yet effective tool for sampling in waters where unre-movable snags are not a problem (BAYLEY & HERENDEEN 2000). However, a variety of beach seine nets have been reported in publications, contrasting with the fewer numbers of studies comparing their performances in marine (MONTEIRO-NETO & MUSICK 1994), estuarine (STEELE et al. 2006) and freshwater en-vironments (DELACY & ENGLISH 1954, RÍHA et al. 2008). Com-parisons among samplers are needed to reveal systematic sampling errors and to achieve a full assessment of fish ecol-ogy. Differences in the composition of catches when different
samplers are used have been studied by several authors (HAYES 1989, GROWNS et al. 1996, ROZAS & MINELLO 1997, BRIND’AMOUR & BOISCLAIR 2004, CLAVERO et al. 2006, ERÖS etal. 2009), and only direct comparisons among sampling gears can clarify the ad-vantages and disadad-vantages of each and the sampling bias they produce (GROWNS et al. 1996, OLIN et al. 2009). For this reason, we endeavored to compare, in the present work, species com-position, numeric dominance, and size structure of fish cap-tured with two beach seines that have distinct structural characteristics.
MATERIAL AND METHODS
A broad, non-vegetated, low-declivity sandy beach was selected at Mirim Lake (32°15’S, 52°46’W), located near the São Gonçalo Channel (Fig. 1). The area is favors the use of the two samplers (explained below), allowing for standardized and entanglement-free sampling.
The Mirim Lake was linked to the Patos Lagoon estuary via São Gonçalo Channel until 1977, when a Dam was built to avoid the entrance of saline waters, allowing the riceculture and freshwater supply to the local communities.
The experiments took place at daytime on November 22, 2008, March 27, 2009, and July 9, 2009. We used two distinct seines, operated with two rods at the ends of each wing of the seine. The first seine (BS-9m) is a straight, bagless net, 9 m in
Looking through a dirty glass: how different can the characterization of a
fish fauna be when distinct nets are used for sampling?
Gianfranco Ceni
1,2& João Paes Vieira
11 Laboratório de Ictiologia, Departamento de Oceanografia, Universidade Federal do Rio Grande. Caixa Postal 474,
96201-900 Rio Grande, RS, Brazil.
2 Corresponding author. e-mail: [email protected]
length by 1.5 m in height. It has a 5 mm multifilament mesh on its central portion (3 m long), and a 12 mm mesh on its side wings. The second seine (BS-30m) is also a straight, bagless net, measuring 30 m x 1.8 m, with 12 mm uniform mesh manu-factured with monofilament nylon wire. Between the body of this net and the lead line, a 30 cm strip (manufactured with multifilament wire) was sewn in order to give strength to the net and to protect it from the rough substrate.
We alternated the use of the two seines. First, we drew a 10 m shoreline mark and had the net operators get into the water until they reached a water level that allowed them to drag the nets. The samples were taken perpendicularly to the shoreline using the mark as reference, thus avoiding juxtapo-sition in the seining path, and allowing standardization among samples. A total of 30 hauls were performed with both the BS-9m and 30 with the BS-30m beach seine nets (10 hauls for each month). The fish samples collected were fixed in 10% formalin, and identified to the lowest possible taxonomic level. The total length of each specimen was recorded in millime-ters. Specimens were collected under the ICMBio license num-ber 17762-1 and the research was financially supported by PELD program (Brazilian Long Term Ecological Program). All the species collected have voucher specimens deposited at “Coleção Ictiológica da FURG”.
In order to compare the abundance of fish (N) between nets, the total abundance of each sample was logarithmized (Log10x +1) to reach normal distribution and variances
prox-imity, then a t-test was performed to evaluate the null hypoth-esis that the samples collected with the BS-9m and BS-30m nets are equivalent.
In order to assess the relative importance of fish species collected by each sampling gear, the frequency of occurrence (FO%) and numeric percentage (N%) of each species were com-pared with their respective means (xFO%; xN%). A species was
considered abundant in either sampling gear when the N% was greater than or equal to 100/S (S= the total number of species captured in each sampling gear), and frequent when the FO% was greater than or equal to ⌺FO%/S. According to BURNS et al. (2006), GARCIA et al. (2006) and ARTIOLI et al. (2009) fish species were grouped into the following categories: fre-quent and abundant (%FO ⭓⌺%FO/S, %N ⭓ 100/S), frequent but not abundant (%FO ⭓⌺%FO/S, %N < 100/S), not frequent but abundant (%FO < ⌺%FO/S, %N ⭓ 100/S) and present (%FO < ⌺%FO/S, %N < 100/S). Species identified as abundant and frequent were considered dominant (GARCIA & VIEIRA 2001).
In order to calculate species richness for each seine inde-pendently of total abundance (N), the rarefaction technique (E[S]) was performed (SANDERS 1968, HURLBERT 1971, KREBS 1989) using the Software PAST ver. 2.12 (HAMMER et al. 2001).
Odontesthes was represented by three species and Astyanax
by four species. However, when individuals of those two gen-era were smaller than 60 mm CT, we were not able to identify them to species. Therefore, we did not include their abundance scores in the following statistics: the faunal similarity analy-sis, based on a species’ presence/absence relationship between samplers, was calculated through the Jaccard index (JI), using the following equation: JI = a/(b+c+a), where ‘a’ is the number of species caught by both nets, ‘b’ is the number of species caught only by BS-9m and ‘c’ is the number of species caught only by BS-30m (MAGURRAN 1988). Faunal similarity, based on species’ relative abundances, was obtained through the Per-cent Similarity Index (PSI) using the following equation: PSI = ⌺i minimum (p1i, p2i), where p1i is the species ‘i’ relative abun-dance in net 1, and p2i = relative abunabun-dance of species ‘i’ in net 2 (KREBS 1989). This methodology was used to test if the species co-occurring in both samplers had similar proportional abundances (ARTIOLIet al. 2009).
Besides applying the JI and PSI indexes, we also performed the ANOSIM (Analysis of Similarities) (Software PAST 2.12), using abundance data standardized to percentages of the total catch of all species in that sample, with 10,000 permutations, using Bray-Curtis distance as significance measurement (BRAY & CURTIS 1957, CLARKE 1993).
In order to assess the size structure of the fish captured by each net, we established 10 mm total length (TL) classes. We then arranged species according to their abundance in each total length class (Abundance-TL) and compared the distribu-Figure 1. Map of South America and Brazil, highlighting the state
tion of their size frequencies between the two samplers (GARCIA & VIEIRA 2001, VIEIRA 2006).
A comparison of the relative size structure between the samplers was performed using the Percentage Similarity Index (PSI-SC), were species’ relative abundances were substituted with their class size relative abundances. In order to statisti-cally assess the size structure of the fish collected by each beach seine net, we used the Mann-Whitney test. In this analysis, the lengths of fish caught by both seines were compared in three distinct groups: 1) species caught by both gears; 2) spe-cies exclusive of either gear; and 3) spespe-cies with at least 20 fish caught by each gear – Astyanax aff. fasciatus (Cuvier, 1819) and
Astyanax jacuhiensis (Cope, 1894).
For each of the 10 mm size classes that co-occurred in both samplers, the similarity index (JI-SC and PSI-SC) was cal-culated and, sequentially, the binomial test (P) was performed (Software BIOESTAT 5.0), in order to test the success rate, or frequency, of catches of each size class between the samplers. To test the randomness or non-randomness of each simi-larity index (JI, PSI, PSI-TL, JI-SC and PSI-SC), the samples from both nets were resampled (with replacement) 5,000 times. At each resampling (of a regarding index), the index was calcu-lated and recorded, totaling 5,000 values, which achieved the random distribution index. As a significance measure of the index values to their random distribution, a probabilistic test was applied according the following equation: P = (⌺(ri ⭐ ci) + 1)/(N + 1), where P is the sum of the number of random index values (ri) lower or equal than the value of the calculated in-dex (ci) divided by the number of resamplings (N = 5000) plus one regarding to the index tested (GOOD 2005). Using this meth-odology we aimed to verify whether the index obtained through the data collected in nature corresponds either to a non-random value (“realistic”; p < 0.05) or a random value.
RESULTS
A total of 849 fish were captured, comprising 36 taxa; of these, 34, distributed in 13 families and 6 orders, were identi-fied to species (Table I), and the other two taxa, usually smaller than 60 mm TL, as juveniles of Astyanax spp. and Odontesthes
spp. The BS-9m net captured almost half the number of indi-viduals (N = 291; 34.3%) than the BS-30m (N = 558; 65.7%); however, no significant differences (P = 0.1283) were found per sample between seines in the total the abundance of fish, using the t-test (log-transformed Log10x+1).
Both samplers had the same number of nominal species (n = 24), though only 14 co-occurred (Table I). The mean num-ber of species per sample is not statistically different (t-test; p = 0.082). The difference in fish composition between seines was high (ANOSIM, R = 0.2309, p < 0.0001). The faunal similarity between both seines was also calculated by the Jaccard Index and resulted in a similarity value of 0.41, non-randomized by resampling probabilistic test (P = 0.0002).
Figures 2-3. Curve of cumulative number of species by the num-ber of samples captured (2), and the numnum-ber of individuals (3).
The cumulative curves of the number of species per sample (Fig. 2) were very similar for both seines, suggesting the same rate of species increase per sample. Although each seine captured 24 species, the BS-9m net sampled less than half the number of individuals captured by the BS-30m; and the cumulative curves of the number of species per individuals collected (Fig. 3) did not stabilize for the BS-9m, suggesting that there are differences in the species accumulation rate per individuals collected. The results of the rarefaction technique at n = 148 suggest that BS-9m {E[S] = 21.8 (sd 1.27)} sampled more species than BS-30m {E[S] = 17.4 (sd 1.6)}.
The four species defined as dominant for BS-30m –
Platanichthys platana (Regan, 1917), A.aff. fasciatus, A. jacuhiensis, and Hyphessobrycon luetkenii (Boulenger, 1887) – were also classified as dominant for BS-9m. However, the higher equitability observed for BS-9m allowed other four taxa – 2
Odontesthes mirinensis Bemvenuti, 1995, Cyanocharax alburnus
(Hensel, 1870), Cheirodon ibicuhiensis Eigenmann, 1915, and
Odontesthes spp. – to be also classified as dominant (Table I). The dominance pattern between seines resulted in a low Per-centage Similarity Index (PSI = 0.46, resampling P = 0.0002).
The greater difference between both seines was the size of the individuals captured (Fig. 4). Individuals caught by the BS-9m and which were smaller than 60 mm TL accounted for 86.9% of the yield of this seine, whereas the BS-30m mostly captured individuals that were larger than 60 mm TL. This
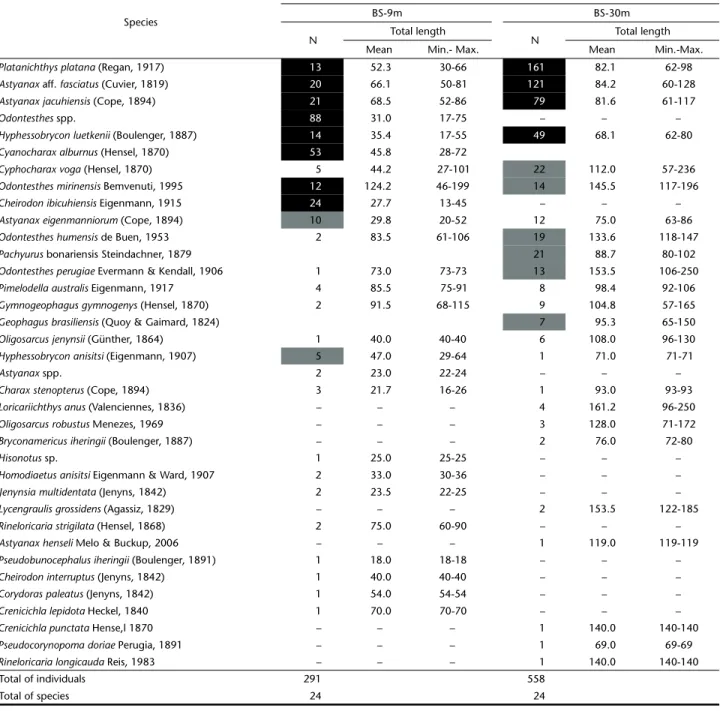
dif-Table I. Comparative list of absolute abundance (N), structure size (minimum, maximum total length (Min-Max.) and total length mean (Mean)) and the relative importance (based on the FO% and N%), where: (black) frequent and abundant (gray) frequent and not abundant, and (colorless) present species caught with distinct beach seine nets. The fishes grouped on Genera were not counted as species.
Species
Beach seine net
BS-9m BS-30m
N Total length N Total length
Mean Min.- Max. Mean Min.-Max.
Platanichthysplatana (Regan, 1917) 13 52.3 30-66 161 82.1 62-98
Astyanax aff. fasciatus (Cuvier, 1819) 20 66.1 50-81 121 84.2 60-128
Astyanaxjacuhiensis (Cope, 1894) 21 68.5 52-86 79 81.6 61-117
Odontesthes spp. 88 31.0 17-75 – – –
Hyphessobryconluetkenii (Boulenger, 1887) 14 35.4 17-55 49 68.1 62-80
Cyanocharaxalburnus (Hensel, 1870) 53 45.8 28-72
Cyphocharaxvoga (Hensel, 1870) 5 44.2 27-101 22 112.0 57-236
Odontesthesmirinensis Bemvenuti, 1995 12 124.2 46-199 14 145.5 117-196
Cheirodonibicuhiensis Eigenmann, 1915 24 27.7 13-45 – – –
Astyanaxeigenmanniorum (Cope, 1894) 10 29.8 20-52 12 75.0 63-86
Odontestheshumensis de Buen, 1953 2 83.5 61-106 19 133.6 118-147
Pachyurus bonariensis Steindachner, 1879 21 88.7 80-102
Odontesthesperugiae Evermann & Kendall, 1906 1 73.0 73-73 13 153.5 106-250
Pimelodellaaustralis Eigenmann, 1917 4 85.5 75-91 8 98.4 92-106
Gymnogeophagusgymnogenys (Hensel, 1870) 2 91.5 68-115 9 104.8 57-165
Geophagusbrasiliensis (Quoy & Gaimard, 1824) 7 95.3 65-150
Oligosarcusjenynsii (Günther, 1864) 1 40.0 40-40 6 108.0 96-130
Hyphessobryconanisitsi (Eigenmann, 1907) 5 47.0 29-64 1 71.0 71-71
Astyanax spp. 2 23.0 22-24 – – –
Charaxstenopterus (Cope, 1894) 3 21.7 16-26 1 93.0 93-93
Loricariichthysanus (Valenciennes, 1836) – – – 4 161.2 96-250
Oligosarcusrobustus Menezes, 1969 – – – 3 128.0 71-172
Bryconamericusiheringii (Boulenger, 1887) – – – 2 76.0 72-80
Hisonotus sp. 1 25.0 25-25 – – –
Homodiaetusanisitsi Eigenmann & Ward, 1907 2 33.0 30-36 – – –
Jenynsiamultidentata (Jenyns, 1842) 2 23.5 22-25 – – –
Lycengraulisgrossidens (Agassiz, 1829) – – – 2 153.5 122-185
Rineloricariastrigilata (Hensel, 1868) 2 75.0 60-90 – – –
Astyanaxhenseli Melo & Buckup, 2006 – – – 1 119.0 119-119
Pseudobunocephalusiheringii (Boulenger, 1891) 1 18.0 18-18 – – –
Cheirodoninterruptus (Jenyns, 1842) 1 40.0 40-40 – – –
Corydoraspaleatus (Jenyns, 1842) 1 54.0 54-54 – – –
Crenicichlalepidota Heckel, 1840 1 70.0 70-70 – – –
Crenicichlapunctata Hense,l 1870 – – – 1 140.0 140-140
Pseudocorynopomadoriae Perugia, 1891 – – – 1 69.0 69-69
Rineloricarialongicauda Reis, 1983 – – – 1 140.0 140-140
Total of individuals 291 558
ference was corroborated by the low value of PSI-TL (0.23, resampling P = 0.0002) calculated between the total length classes of the two gears.
As expected, the pattern of size differences is repeated for species individually (Table I). Small individuals such as juve-niles of Odontesthes, and small species as C. alburnus and C.
ibicuhiensis were exclusive to the BS-9m, which has mesh sizes smaller than 75 mm TL. Dominant species, which co-occur in the yields of both seines, present distinct size distributions. For instance, P. platana ranged from 30 to 66 mm (x = 52.3 mm TL)
in the BS-9m and from 62 to 98 mm TL (x = 82.1 mm TL) in the
BS-30m. The Mann-Whitney test applied to the size structure of the three distinct groups: (1) the species caught by both gears; (2) the species exclusive of each gear; and (3) the species with at least 20 fish caught by each gear (A. fasciatus and A. jacuhiensis) resulted in a significant difference among them (p < 0.0001).
Only among size classes ranging from 50 to 130 mm (Fig. 4, Table II) there is a continuous superposition of catches of both seines, although the faunal similarity indexes (JI-SC and PSI-SC) for those size classes are low (<42%) and statistically significant (non-randomized). Among those classes, only the 60 mm TL did not show a significant difference by the binomial test. In the classes of 160 and 190 mm TL the faunal similarity scores found were lower than 50% but non-significant (considered ran-domized by resampling probabilistic test), which probably are related to the low number of species and individuals captured.
DISCUSSION
It is well know that a single sampler is not sufficient to mirror the ecological attributes (richness; abundance; domi-nance; size structure) of a fish community (GROWNS et al. 1996, PAUKERT 2004, SUNDELL 2005, SUTELA et al. 2008, EGGLETON et al.
2010). The two-seine comparison (BS-9m and BS-30m) con-ducted in this work revealed that both seines are complemen-tary in terms of the size structure of the individuals captured and general faunal composition. When used together, the two seines are more likely to give a realistic picture of the littoral ichthyofauna of the lake than either one used alone.
Despite the fact that the number of samples captured by both nets was the same, the BS-30m net (N = 558) captured almost twice as many individuals than the BS-9m (N = 305). Corroborating the findings of MONTEIRO-NETO & MUSICK (1994), the larger BS-30m captured more individuals than the small BS-9m. Seine size differences, however, do not necessarily ac-count for the differences in the size of the fish captured. Size selectivity is attributed to mesh size (BAYLEY & HERENDEEN 2000), because small individuals can pass through large meshes, and larger individuals are better at escaping the net because they are faster swimmers (DELACY & ENGLISH 1954, RÍHA et al. 2008).
Table II. Indexes of faunistic similarity (Jaccard Index – JI and Percent Similarity Index – PSI) with significance values (resampling with replacement; N = 5000), comparative values of richness (spp) and absolute abundance (N) and significance on success rate (Binomial p) of size classes with catch overlap between beach seine nets.
Class JI- SC JI-SC PSI-SC PSI-SC BS-9m BS-30m Binomial p
Resampling p Resampling p spp N spp N
50 0.00 – 0.00 – 9 47 2 2 <0.0001
60 30.77 <0.01 33.21 <0.01 9 27 8 62 0.3000 ‡
70 12.50 <0.01 40.30 <0.01 7 15 11 133 0.0200
80 20.00 <0.01 41.21 <0.01 3 8 9 182 <0.0001
90 8.33 <0.01 6.76 <0.01 3 3 10 74 <0.0001
100 11.11 <0.01 28.00 0.05 2 2 8 25 <0.0100
110 0.00 – 0.00 – 1 1 7 13 0.0100
120 14.28 <0.01 20.00 0.02 1 4 7 15 0.0100
130 20.00 <0.01 9.52 <0.01 1 2 5 21 <0.0010
160 50.00 0.80 25.00 0.44 † 2 2 4 4 0.1600 ‡
190 50.00 0.77 † 50.00 0.70 † 1 1 2 2 0.5500 ‡
† illustrates values without significant differences between index and its random distribution, while ‡ illustrates values without differences between BS-9m and BS-30m through the Binomial test.
The BS-30m, which is able to drag from the shore up to 1.8 m deep, usually captured individuals larger than 60 mm TL, since the homogeneous 12 mm monofilament nylon mesh allows small individuals to escape. Meanwhile, the BS-9m net is more efficient in capturing small species or juveniles of larger species (20-30 mm TL), since it is made with a multifilament mesh, and has a 5 mm mesh in the central portion. Such fea-tures probably make the gear more operational in shallower waters (1.5 m). LIMA & VIEIRA (2009), in a surf zone, using the same seines as in the present study, recorded the same pattern of smaller individuals (<50 mm TL) being caught by the BS-9m, and larger individuals (>100 mm TL) by the BS-30m. Such results support the conclusion that these two seines are comple-mentary, each being more efficient to catch specific size classes and at different depths.
When we analyzed the number of species captured by each seine, we found that they captured a similar number of species per sample (Fig. 3), 24 species each. However, when we summed the total number of species caught by both seines, the resulting number was 34 (14 spp. co-occur), resulting in low levels of fau-nal similarity between seines. Also, considering that the fish captured by either seine have different sizes, we suggest that there is faunal segregation in the littoral zone, from a very shal-low area (<0.5 m) where the BS-9m net is more efficient, up to at least 1.8 m, depth, where the BS-30m is more efficient. This finding corroborates the hypothesis that individuals of a spe-cies segregate according to their ontogenetic stage at different depths, there is, small individuals utilize the shallow part of the Littoral Zone to escape from pelagic predators, whereas larger fish avoid shallower areas, reducing predation by birds or ter-restrial predators (GODIN 1997, HELFMAN et al. 2009). Our results are consistent with those of GARCIA et al. (2006) and ARTIOLI et al. (2009), for the Mirim-Taim wetland system, and have also been generalized by POWER (1987) for fish fauna of shallow waters.
It is also important to note that both samplers had the same number of nominal species (n = 24), though only 14 co-occur. With rare exceptions – the exotic Pachyurus bonariensis
Steindachner, 1879 and Geophagus brasiliensis (Quoy & Gaimard, 1824) – the species collected exclusively with the BS-30m are neither frequent nor abundant. The cumulative curves of num-ber of species per individuals collected does not stabilize for the BS-9m, suggesting that if more individuals had been collected, those occasional species caught by the BS-30m might also be collected by the BS-9m. This aspect gives an additional advan-tage to BS-9m over BS-30m in terms of sampling biodiversity.
The greatest contribution of the present study is that the structural characteristics of each seine determined expres-sive differences in composition, relative abundance and, most importantly, in the size structure of the individuals collected. We would like to point out, however, that besides the net size, mesh size and the material used to make it, it is also important to consider the seine’s operationality in the comparison (ROZAS & MINELLO 1997). It is worth mentioning that during two
addi-tional field incursions made in the area (August 23, 2009 and January 21, 2010), we were not able to use the BS-30m net because the water level in the Mirim Lake was too high to op-erate it. When the lake’s water level was up to the vegetated margin, the sand beach area was reduced and the BS-30m net got entangled. However, the same situation did not prevent us from using the BS-9m net, which is smaller and structurally more robust. This adversity allowed us to assert that the BS-9m net has a greater operational reliability in restricted condi-tions such as lower beach areas, presence of obstacles and water level changes, and should be used in field work that require standardization of sampling methods.
ACKNOWLEDGMENTS
We thank the research team of FURG’s Ichthyology Labo-ratory, specially to Mauricio L. dos Santos, Fábio L. Rodrigues, Fabio B. Nogari, Renata M.B. Giovanini, Pryscilla M. Lombardi, who were very helpful with sampling procedures and Leonardo E. Moraes, who helped on discussions about statistical analyses either. We also thank the Coordenação de Aperfeiçoamento de Pessoal de Nível Superior and Conselho Nacional de Desenvol-vimento Científico e Tecnológico for the research grant.
LITERATURE CITED
ARTIOLI, L.G.S.; J.P. VIEIRA; A.M. GARCIA & M.DEA. BEMVENUTI. 2009. Distribuição, dominância e estrutura de tamanhos da assem-bléia de peixes da lagoa Mangueira, sul do Brasil. Iheringia Série Zoologia99 (4): 409-418.
BAYLEY, P.B. & R.A. HERENDEEN. 2000. The Efficiency of a Seine Net. Transactions of the American Fisheries Society129: 901-923. BRAY, J.R. & J.T. CURTIS. 1957. An ordination of the upland forest communities of Southern Wisconsin. Ecological Monographs 27: 325-349.
BRIND’AMOUR, A. & D. BOISCLAIR. 2004. Comparison between two methods to evaluate the structure of fish communities in the littoral zone of a Laurentian lake. Journal of Fish Biology65: 1372-1384.
BURNS, M.D.M.; A.M. GARCIA; J.P. VIEIRA; M.A. BEMVENUTI; D.M.L.M. MARQUES & V. CONDINI. 2006. Evidence of habitat fragmen-tation affecting fish movement between the Patos and Mi-rim coastal lagoons in southern Brazil. Neotropical Ichthyology 4 (1): 69-72.
CLARKE, K.R. 1993. Non-parametric multivariate analyses of changes in community structure. Australian Journal of Ecology 18: 117-143.
CLAVERO, M.; F. BLANCO-GARRIDO & J. PRENDA. 2006. Monitoring small fish populations in streams: a comparison of four passive methods. Fisheries Research 78: 243-251. DELACY, A.C. & T.S. ENGLISH. 1954. Variations in Beach Seine
EGGLETON, M.A.; J.R. JACKSON & B.J. LUBINSKI. 2010. Comparison of gears for sampling littoral-zone in floodplain lakes of the lower White River, Arkansas. NorthAmericanJournal of Fisheries Management30: 928-939.
ERÖS, T.; A. SPECZIAR & P. BIRO. 2009. Assessing fish assemblages in reed habitats of a large shallow lake-A comparison between gillnetting and electric fishing. FisheriesResearch 96: 70-76.
GARCIA, A.M. & J.P. VIEIRA. 2001. O aumento da diversidade de peixes no estuário da Lagoa dos Patos durante o episódio El Niño 1997-1998. Atlântica, Rio Grande23: 133-152. GARCIA, A.M.; J.P. VIEIRA; M.A. BEMVENUTI; D.M.L. MOTTA MARQUES;
M. BURNS; A. MORESCO & V. CONDINI. 2006. Checklist comparison and dominance patterns of the fauna at Taim Wetland, South Brazil. NeotropicalIchthyology4 (2): 261-268.
GIBSON, R.N.; A.D. ANSELL & L. ROBB. 1993. Seasonal and annual variations in abundance and species composition of fish and macro crustacean communities on a Scottish sandy beach. Marine Ecology Progress Series98: 89-105. GODIN, J.J. 1997. Evading Predators, p. 191-226. In: J.J. GODIN
(Ed.). Behavioural ecology of teleost fishes. Oxford, Oxford University Press, 384p.
GOOD, P.I. 2005. Resampling methods: a practical guide to data analysis. Boston, Birkhäuser, 218p.
GROWNS, I.O.; D.A. POLLARD & J.H. HARRIS. 1996. A comparison of electric fishing and gillnetting to examine the effects of anthropogenic disturbance on riverine fish communities. Fisheries Management and Ecology 3: 13-24.
HAMMER, Ø.; D.A.T. HARPER & P.D. RYAN. 2001. PAST: Paleontological Statistics software package for education and data analysis. PaleontologiaEletronica4 (1): 1-9.
HAYES, J.W. 1989. Comparison between a fine mesh trap net and five other fishing gears for sampling shallow-lake fish communities in New Zealand. New Zealand Journal of Marine and FreshwaterResearch23: 321-324.
HELFMAN, G.S.; B.B. COLLETTE; D.E. FACEY & B.W. BOWEN. 2009. The diversity of fishes. Oxford ,Wiley-Blackwell, 2nd ed., 720p.
HURLBERT, S.H. 1971. The nonconcept of species diversity: a cri-tique and alternative parameters. Ecology52: 577-586. JENNINGS, S.; M.J. KAISE & J.D. REYNOLDS. 2001. Getting the data:
stock identity and dynamics, p. 178-204. In: S. JENNINGS, M.J. KAISE, & J.D. REYNOLDS (Eds). Marine Fisheries Ecology. London, Wiley-Blackwel, 432p.
KREBS, C.J. 1989. Ecological Metodology. New York, Harper and Row, 654p.
LAPOINTE, N.W.R.; L.D. CORKUM & N.E. MANDRAK. 2006. A comparison of methods for sampling fish diversity in shallow offshore waters of large rivers. North American Journal of Fisheries Management 26: 503-513.
LIMA, M.S.P & VIEIRA, J.P. 2009. Variação espaço-temporal da ictiofauna da zona de arrebentação da Praia do Cassino, Rio Grande do Sul (Brasil). Revista Brasileira de Zoologia 26: 499-510.
MAGURRAN, A.E. 1988. Ecological diversity and its measurement. New Jersey, Princeton University Press, 179p.
MONTEIRO-NETO, C. & J.A. MUSICK. 1994. Effects of beach seine size on the assessment of surf-zone fish communities. Atlân-tica 16: 23-29.
OLIN, M.; T. MALINEN & J. RUUHIJÄRVI. 2009. Gillnet catch in estimating the density and structure of fish community – Comparison of gillnet and trawl samples in a eutrophic lake. Fisheries Research96: 88-94.
PAUKERT, C.T. 2004. Comparison of electrofishing and trammel netting variability for sampling native fishes. Journal of Fish Biology 65: 1643-1652.
PIERCE, C.L.; J.B. RASMUSSEN & W. C. LEGGETT. 1990. Sampling littoral fish with a seine: corrections for variable capture efficiency. Canadian Journal of Fisheries and Aquatic Sciences 47: 1004-1010.
POWER, M.E. 1987. Predator avoidance by grazing fishes in temperate and tropical streams: Importance of stream depth and prey size, p. 333-351. In: W.C. KERFOOT & A. SIH (Eds). Predation: Direct and indirect impacts on aquatic communities. Hanover, University Press of New England, 386p.
ROZAS, L.P. & T.J. MINELLO. 1997. Estimating densities of small fishes and decapod crustaceans in shallow estuarine habitats: a review of sampling design with focus on gear selection. Estuaries20 (1): 199-213.
RÍHA, M.; J. KUBECKA; T. MRKVICKA; M. PRCHALOVÁ; M. CECH; V. DRASTÍK; J. FROUZOVÁ; M. HLADÍK; E. HOHAUSOVÁ; O. JAROLÍM; T. JUZA; M. KRATOCHVÍLL; J. PETERKA; M. TUSER & M. VASEK. 2008. Dependence of beach seine net efficiency on net length and diel period. Aquatic Living Resources21: 411-418. SANDERS, H.L. 1968. Marine benthic diversity: a comparative
study. American Naturalist102: 243-282.
STEELE, M.A.; S.C. SCHROETER & H.M. PAGE. 2006. Experimental evaluation of biases associated with sampling estuarine fishes with seines. Estuaries and Coasts29 (6B): 1172-1184. SUNDELL, J. 2005. Comparison of two sampling methods, the beach seining and the plexiglas trapping, to investigate littoral fish fauna. Memoranda Societatis pro Fauna et Flora Fennica 81: 89-96.
SUTELA, T.; M. RASK; T. VEHANEN & A. WESTERMARK. 2008. Comparison of electrofishing and Nordic gillnets for sampling littoral fish in boreal lakes. Lakes and Reservoirs: Research and Management 13: 215-220.
VIEIRA, J.P. 2006. Ecological analogies between estuarine bottom trawl fish assemblages from Patos Lake, Rio Grande do Sul, Brazil and York River, Virginia, USA. Revista Brasileira de Zoologia 23 (1): 234-247.