Rev. CEFAC. 2014 Jul-Ago; 16(4):1239-1254
FINGER KAZOO
: SPECTROGRAPHIC ACOUSTIC
MODIFICATIONS AND VOCAL SELF-ASSESSMENT
Finger kazoo
:
modiicações vocais acústicas
espectrográicas e autoavaliação vocal
Carla Aparecida Cielo(1), Mara Keli Christmann(2)
(1) Speech therapy Department, of the Federal University of
Santa Maria, Santa Maria, Rio Grande do Sul, Brazil.
(2) Federal University of Santa Maria, Santa Maria, Rio Grande
do Sul, Brazil.
Resources: CAPES/FAPERGS, CNPq.
Conlict of interest: non-existent
In these cases, the Speech therapist is the professional that possesses the capacity to act in the vocal rehabilitation and improvement. Because of this, it is a must to have the anatomic and physi-ologic knowledge of the phonation system, besides its acoustic, aerodynamics and correlation among emotive estates and neurological conditions with the voice, as well as having mastered the techniques which comprise all the phonation process11-13.
Due to technological advances in laryngology and the availability of modern tools for voice
assessment and the veriication of the effects of
various vocal techniques, studies regarding voice have shown a progress in an attempt to deepen their understanding and thus increase the effectiveness of speech-language intervention2,8,13-15. However,
some vocal techniques have not yet presented
suficient evidence of its effects, making it critical to
perform studies like this that seeks to describe the vocal changes after FK.
The spectrograms analysis is one way to check the effect of vocal techniques 6,13-15. This analysis
provides data that are related to the vibratory pattern of the vocal folds, the shape of the vocal tract and their changes in time, and their interpretation
INTRODUCTION
The nonlinear theory of voice production suggests
that the vocal tract, in addition to exercising ilter
function of the sound produced in the glottal source,
also acts as a modiier of the patterns of vocal fold
vibration by modifying the acoustic impedance. Thus
there is a biofeedback between ilter and source, promoting the inluence of the ilter on the source 1-4
Voice therapy is indicated for patients with
voice disorders at both the source and at ilter
level (resonance), as for those who wish to improve voice4-8. The semi-occluded vocal tract
exercises (SOVTE), category in which is included the inger kazoo (FK) technique, have been widely
used as features in speech therapy and voice Improvement2,3,9,10.
ABSTRACT
Purpose: to correlate the spectrographic vocal modiications and self-evaluation after inger kazoo. Methods: visual spectrographic analysis of the vowel /a:/ of 46 adult women, without vocal complaints or laryngeal alterations and self-evaluation before (Moment 1 – M1), after inger kazoo (M2) and after
ive minutes of silence (M3). Kappa, Chi-square and Spearman tests. The parameter for improving the voice was the statistical signiicance of the results after the inger kazoo. Results: improvement
of darkening tracing of the formant (F) and high frequencies, of tracing regularity and deinition of
the harmonics. Best voice self-reported as increasing of intensity of the tracing darkening of F3,
improvement of tracing deinition and number of harmonic and replacement of harmonics with noise
in medium frequencies. Conclusions: after the inger kazoo, there was an increase of darkening,
regularity and deinition of the spectrographic tracing and best voice self-reported.
evaluations; alcoholism and smoking habits, which
are aggressive to the larynx, and can generate
laryngeal disorders2,5,8,13,15,18,21,23; have done
speech-language and/or otorhinolaryngological therapy to rule out the possibility that the individual had any laryngeal disorder (even already treated) or vocal habituation due to treatment or training, knowledge of the studied vocal technique; hearing loss by interfering in the voice self-monitoring5,8,13,15,20,23,24
changes in the stomatognathic system that could interfere in the implementation of the technique or in vocal assessment5,7,8,13,15,20; inability to perform
the FK technique; being a singer or singing in choirs regularly (at least once a week) in order to avoid the individual already had notions of vocal techniques or had his voice trained13,15.
An interview was carried out covering some
inclusion and exclusion criteria. After that, the
individuals performed a visual inspection of the
larynx with an otorhinolaryngologist for the appli
-cation of an exclusion criterion based on the
presence of laryngeal disorders5,7,8,13,18,23. It was
also carried out an evaluation of the stomatognathic
system and its functions, to exclude individuals
with any disorder that could jeopardize the imple-mentation of the FK technique5,7,8,13,20, as well as a
hearing screening test, through the scanning of the 500, 1000, 2000, 4000 25 dB frequencies by air in an acoustically treated booth (Fonix audiometer, FA 12 Digital) 5,8,13,20,23,24.
Subjects studied
Of the 58 volunteers, in the interview, one was excluded for being in the menstrual period on the
day of evaluations, one for being a singer, and two for being male. During the othorrinolaringological
evaluation, one was excluded for the presence of
an oedema in the vocal folds, one for the presence of microweb, one for the presence of a vocal fold sulcus, and one for vocal nodules. During the
hearing screening, one was excluded for reduction of hearing; and three were excluded because
they did not perform all stages of selection. Thus, the sample was formed by 46 adult women, aged between 18 and 39 years (average 23,2 years), blinded in respect to the research objectives.
Procedures for data collection
During data collection, it was requested to each individual, in the orthostatic position to issue the vowel /a:/ 5,6,8,10,12,13,15-17,21,22,25,26. Emissions were
captured with a microphone (stereo condenser, unidirectional, 96KHz, 16 bit, 50% of the input recording level), coupled to a professional digital
varies with age, sex, type of phonation and vocal
training 5,16,17. It becomes also important, the studies
of self-assessment of the voice of the subjects after performing the voice techniques 2,14, which have
considered the point of view of the patient about his voice, contributing more generally to the under-standing of the effects of vocal techniques.
Thus, the present study’s aim was to correlate
the spectrography acoustic vocal modiications and
the vocal self-evaluation occurred immediately after
the execution of the FK phonotherapeutic technique and after ive minutes of absolute silence in female
adults without vocal complaints and without laryngeal disorders.
METHODS
The research was characterized for being an analytical cross-sectional observational study of a quantitative nature, approved by the Ethics Committee of Research of the home institution (016945/2010-76). Participants received the
necessary clariications about the study and signed
the Statement of Informed Consent (IC), as recom-mended by the standard 196/96 of The National Commission of Ethics in Research.
Inclusion and exclusion criteria
The target population was composed of individuals who sought the voice sector of a clinical school of speech-language pathologist for performing vocal improvement during the period June 2010 to June 2011. Inclusion criteria: IC signature, females, since the literature shows a greater number of studies with this population 2,13,15,18-21; ages between 18 and
40 years, because it comprises an age range free from hormonal and structural changes during the period of vocal change or aging8,13,15,20-22; complete
glottic closure or presence of a triangular slit after
the otorhinolaryngological exam, for representing
the female laryngeal standard with no negative impact on the voice5,23.
Exclusion criteria: vocal complaints, since this
may signal some kind of organic or functional voice disorder5,7,8,13,15,21,23; medical diagnosis of
laryngeal disorders5,7,8,13,15,18,23; history of
neuro-logical, endocrinoneuro-logical, psychiatric, gastric or
respiratory diseases that could inluence the
vocal performance or understanding of the orders for the performed procedures4,5,7,8,13,15,23; reports
of hormonal changes, such as those typical of pregnancy, menstrual or premenstrual period; being
with a lu and/or with respiratory allergies, because
Rev. CEFAC. 2014 Jul-Ago; 16(4):1239-1254
Immediately upon completion of the technical series, prior to any another emission, the individuals had the vowel /a:/ taken on the same pre-technical conditions. Shortly they answered to an enclosed questionnaire of self-evaluation on the global effect of FK technique, in which they should mark on one of three options: “better voice”, “equal voice” or
“worse voice”. It was considered the irst emission,
prior to the technique, as a base for self-judgement
4,30,31. After ive minutes after the execution of the
FK technique, during which the individual remained seated and in complete silence the individuals had the vowel /a:/ taken on the same pre-technical conditions /a:/ and the same questionnaire was completed2,32.
Procedures for the analysis of collected data
For the acoustic analysis of voice, it was elimi-nated the vocal attack from the vowel /a:/ and the
end of utterance for those excerpts not to alter the signal analysis, since the end of extended emissions
typically show amplitude and frequency decreases. From this edition, it was standardized the interval of four seconds for the analysis window (corre-sponding to the shortest edited time of all vowel supports done by the group) 2,5,13,15-17,25.
For the spectographies, it was used the Real
Time Spectrogram program from Kay Pentax®,
installed in a computer that was adequated to all
manufacturer’s speciications in a bandwidth ilter of 100 points (646,00Hz) and in a narrowband ilter
of 1024 points (63,09Hz), with a sampling rate of 11KHz e 16bits in the resolution of 5KHz, and the results were compared with the literature6,13,14,33,34.
In the bandwidth spectrography (SBW), the
formants (F) were visually classiied according to
the following aspects: the tracing darkening of the F (F1, F2, F3 and F4); tracing darkening of the high-frequency tracing; tracing darkening all over the voice spectrogram; presence of noise all over the voice spectrogram, as well as in high, medium and
low frequencies, F bandwidth; tracing deinition of F;
tracing regularity6,8,13-15,26,33,35.
In the narrowband spectrography SNB, there were considered the following aspects visually
classiied: stroke color in high frequencies, the stroke
color all over the voice spectrogram, the presence of noise between the harmonics all over the voice spectrogram, as well as in high, medium and low frequencies, replacement of harmonics with noise all over the voice spectrogram as well as in high, medium
and low frequencies, tracing deinition of harmonics,
tracing regularity, presence of sub-harmonics, and number of harmonics6,8,13-15,26,33,35.
In the evaluation of stroke color of (of F, in high frequencies and all over the spectrogram) it was of four centimetres between the microphone and
the mouth12,13,15,21,22,26. Data was collected in an
acoustically treated room, with ambient noise below 50dB sound pressure level, as measured by sound pressure meter Instrutherm, Dec-4805,6,22,26,27.
The emission of the vowel /a:/ and the technical
repetitions of FK were performed in Maximum
Phonation Time (MPT), as the MPT represents the capacity of individual resistance of the individual due to the interaction of breathing, phonation and resonance levels which vary from individual to individual3,15,21.
Thereafter, the individuals produced three series of 15 replications of the FK technique, so that each technique emission was done in MPT and was considered a repetition11,13-15,21.
For the production of FK, it must produce a breath sound, with the lips rounded and protruded, as in the emission of /u:/, with no variation in pitch
and loudness, without inlating the cheeks, with the tongue relaxed and lowered, while the index inger
should remain vertically positioned on the lips, with the same gesture used to ask for silence, touching them lightly, but without pressing them. During this production, it should be heard a secondary sound,
as a friction, corresponding to the low of air in contact with the index inger 2,28.
The technique was performed with each individual seated comfortably, without cervical dislo-cation, with an angle of 90° between the chin and the neck and with no increase in muscle contraction of the shoulder girdle and suprahyoid region, with feet
lat on the loor, back straight, keeping a constant rhythm between one exercise and another without making use of the expiratory reserve. Although,
they should make use of the
costodiaphragmatic-abdominal breathing and avoid the luctuation or
variability of pitch and loudness. A speech therapyst visually monitored those aspects5,7,12,13.
The technique was explained, demonstrated and
monitored by a speech therapyst (the same with all
participants), that veriied if each individual presented
conditions for the implementation according to the model, by making the necessary corrections so that all individuals perform the technique correctly and in a similar way2,12,14,21.
After each set of FK technique, there was a passive rest for 30 seconds, during which the individuals sat in complete silence5,11,13-15,21. During
the technique, performance it was allowed to ingest 250 ml of water 29, without this being considered
as an intervening variable in the results, since the literature indicates the intake of water from two to three hours before a vocal performance, because the hydration occurs in a systemic way, and the
There were replicated 20% of the spectog-raphies pairs, without the knowledge of the judges, for further statistical analysis of ratings reliability 30,35. Thus, there were evaluated 138 pairs
and more than 30 replicates, totalling 168 pairs evaluated by each of the judges.
Subsequently, it was performed the Kappa coefi -cient calculation to verify the intra-rater12,22 showing
values of 0,57; 0,49; and 0,53 respectively for each of the three judges. The inter-eater reliability among three judges was of 0,2, considering: 0,6 and 0,79, good; 0,4 and 0,59, moderated; 0,2 and 0,39, regular; between zero and 0,19, poor; between zero and –1, no reliability22,35. For the survey results,
there were considered the predominant answers in the assessors’ judgements12,22.
After tabulating the data, it was applied the
Chi-square test to assess the signiicance of the
results of vocal self-evaluation and of SBW and SNB between the pair M1-M2, M1-M3 and M2-M3. It was applied the correlation test of Spearman to check the correlation between vocal self- evaluation and the parameters evaluated in the SBW and in the
SNB. For all tests, it was considered the signiicance
level of 5% (p <0.05).
RESULTS
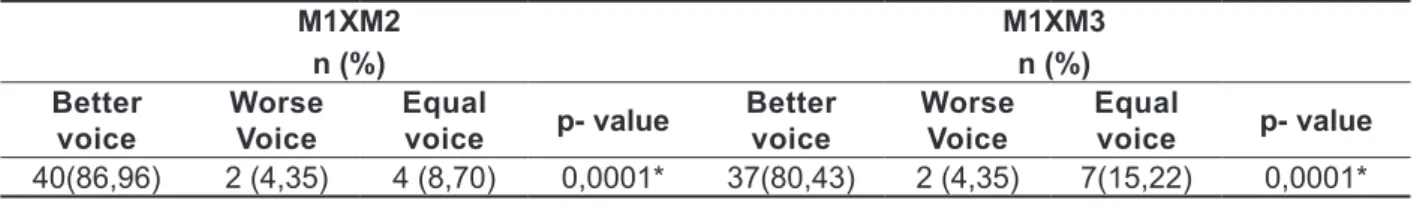
Table 1 shows the result of vocal self-assessment performed by the subjects.
2, 3, 4, 5, 6, and 7 are indicated changes observed through the analysis of SBW and SNB comparing the three stages involved in making the FK.
Tables 8 and 9 show the correlations between vocal self-assessment and SBW and SNB.
considered the level of stroke color, which can vary from black (strong stroke color) to pale grey (weak stroke color)6 and could be classiied into more
intense (improvement), less intense (worsening) or no change. The noise is presented in the spectrogram as a shaded or dotted image, according to the degree of darkening of the shading / dithering,
it could be classiied as decreased (improvement),
increased (worsened) or no changes6,35. The
F bandwidth could be classiied into wider
(improvement), less wide (worsening) or no change.
The F and the tracing deinition of harmonics was
evaluated according to their visibility, demarcation
and symmetry, deined as more (improvement), less deinite (worsening) or no change. The tracing
regularity is related to its continuity and stability and
could be classiied into more regular (improvement),
less regular (worsening) or no changes6.
The spectrographic analysis was performed individually by three speech therapysts with
experience and a master degree in the voice area,
they were not the study’s authors, they were blinded with respect to research objectives, to the technique
used, to the identiication of individuals at the time
of evaluation, to the replication of emissions, as well as to the evaluation of the other judges, being only informed that the voices belonged to adult women6,13,21,22,30.
The SBW and SNB of the three moments of the vowel /a:/ emission prior to the technique performing (Moment 1 – M1), immediately after the technique
(Moment 2 – M2), ive minutes after the technique
(Moment – M3) of each individual were paired for the comparative assessment of the judges, which
would analyze the latter relative to the irst. So, three
pairs were formed for each individual (pair M1-M2, pair M1-M3 and pair M2-M3), but were coded and randomized for the judges to be unaware of the different moments of emissions 6,31.
Table 1 – Vocal self-evaluation on the global effect of FK technique
M1XM2 n (%)
M1XM3 n (%) Better
voice
Worse Voice
Equal
voice p- value
Better voice
Worse Voice
Equal
voice p- value
40(86,96) 2 (4,35) 4 (8,70) 0,0001* 37(80,43) 2 (4,35) 7(15,22) 0,0001*
Chi Squared Test
* Statistically signiicant values (p<0,05)
Rev. CEFAC. 2014 Jul-Ago; 16(4):1239-1254
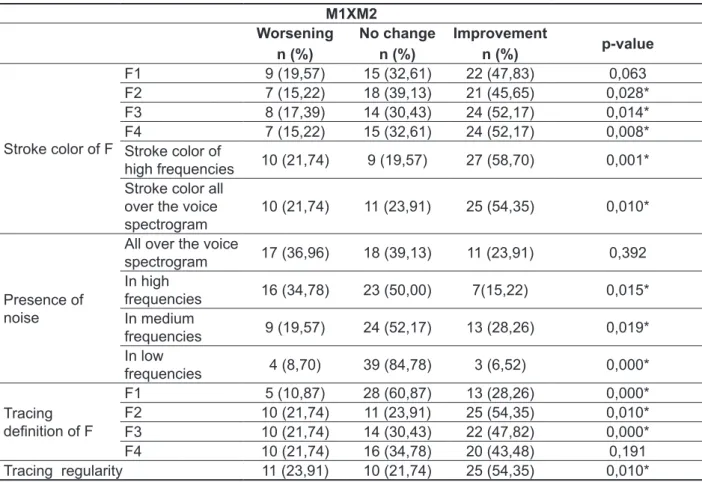
Table 2 – Acoustic vocal modiications in bandwidth spectrography between M1xM2
M1XM2 Worsening
n (%)
No change n (%)
Improvement
n (%) p-value
Stroke color of F
F1 9 (19,57) 15 (32,61) 22 (47,83) 0,063 F2 7 (15,22) 18 (39,13) 21 (45,65) 0,028* F3 8 (17,39) 14 (30,43) 24 (52,17) 0,014* F4 7 (15,22) 15 (32,61) 24 (52,17) 0,008* Stroke color of
high frequencies 10 (21,74) 9 (19,57) 27 (58,70) 0,001* Stroke color all
over the voice spectrogram
10 (21,74) 11 (23,91) 25 (54,35) 0,010*
Presence of noise
All over the voice
spectrogram 17 (36,96) 18 (39,13) 11 (23,91) 0,392 In high
frequencies 16 (34,78) 23 (50,00) 7(15,22) 0,015* In medium
frequencies 9 (19,57) 24 (52,17) 13 (28,26) 0,019* In low
frequencies 4 (8,70) 39 (84,78) 3 (6,52) 0,000*
Tracing
deinition of F
F1 5 (10,87) 28 (60,87) 13 (28,26) 0,000* F2 10 (21,74) 11 (23,91) 25 (54,35) 0,010* F3 10 (21,74) 14 (30,43) 22 (47,82) 0,000* F4 10 (21,74) 16 (34,78) 20 (43,48) 0,191 Tracing regularity 11 (23,91) 10 (21,74) 25 (54,35) 0,010*
Chi Squared Test
* Statistically signiicant values (p<0,05)
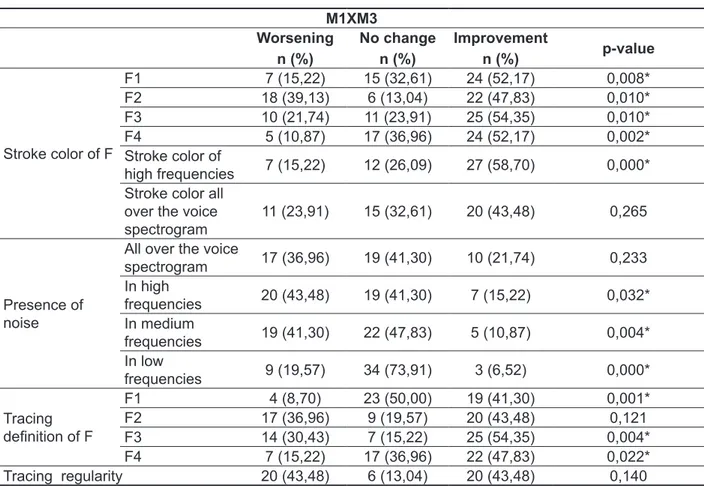
Table 3 – Acoustic vocal modiications in bandwidth spectrography between M1 e M3
M1XM3 Worsening
n (%)
No change n (%)
Improvement
n (%) p-value
Stroke color of F
F1 7 (15,22) 15 (32,61) 24 (52,17) 0,008* F2 18 (39,13) 6 (13,04) 22 (47,83) 0,010* F3 10 (21,74) 11 (23,91) 25 (54,35) 0,010* F4 5 (10,87) 17 (36,96) 24 (52,17) 0,002* Stroke color of
high frequencies 7 (15,22) 12 (26,09) 27 (58,70) 0,000* Stroke color all
over the voice spectrogram
11 (23,91) 15 (32,61) 20 (43,48) 0,265
Presence of noise
All over the voice
spectrogram 17 (36,96) 19 (41,30) 10 (21,74) 0,233 In high
frequencies 20 (43,48) 19 (41,30) 7 (15,22) 0,032* In medium
frequencies 19 (41,30) 22 (47,83) 5 (10,87) 0,004* In low
frequencies 9 (19,57) 34 (73,91) 3 (6,52) 0,000*
Tracing
deinition of F
F1 4 (8,70) 23 (50,00) 19 (41,30) 0,001* F2 17 (36,96) 9 (19,57) 20 (43,48) 0,121 F3 14 (30,43) 7 (15,22) 25 (54,35) 0,004* F4 7 (15,22) 17 (36,96) 22 (47,83) 0,022* Tracing regularity 20 (43,48) 6 (13,04) 20 (43,48) 0,140
Chi Squared Test
* Statistically signiicant values (p<0,05)
Rev. CEFAC. 2014 Jul-Ago; 16(4):1239-1254
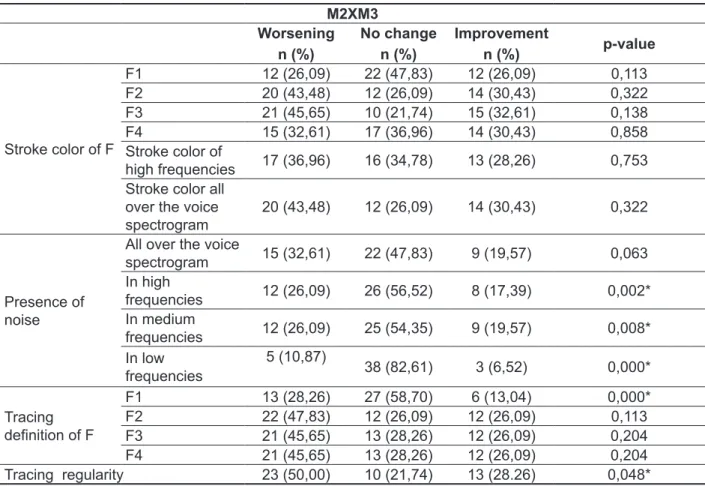
Table 4 – Acoustic vocal modiications in bandwidth spectrography between M2 e M3
M2XM3 Worsening
n (%)
No change n (%)
Improvement
n (%) p-value
Stroke color of F
F1 12 (26,09) 22 (47,83) 12 (26,09) 0,113 F2 20 (43,48) 12 (26,09) 14 (30,43) 0,322 F3 21 (45,65) 10 (21,74) 15 (32,61) 0,138 F4 15 (32,61) 17 (36,96) 14 (30,43) 0,858 Stroke color of
high frequencies 17 (36,96) 16 (34,78) 13 (28,26) 0,753 Stroke color all
over the voice spectrogram
20 (43,48) 12 (26,09) 14 (30,43) 0,322
Presence of noise
All over the voice
spectrogram 15 (32,61) 22 (47,83) 9 (19,57) 0,063 In high
frequencies 12 (26,09) 26 (56,52) 8 (17,39) 0,002* In medium
frequencies 12 (26,09) 25 (54,35) 9 (19,57) 0,008* In low
frequencies
5 (10,87)
38 (82,61) 3 (6,52) 0,000*
Tracing
deinition of F
F1 13 (28,26) 27 (58,70) 6 (13,04) 0,000* F2 22 (47,83) 12 (26,09) 12 (26,09) 0,113 F3 21 (45,65) 13 (28,26) 12 (26,09) 0,204 F4 21 (45,65) 13 (28,26) 12 (26,09) 0,204 Tracing regularity 23 (50,00) 10 (21,74) 13 (28.26) 0,048*
Chi Squared Test
* Statistically signiicant values (p<0,05)
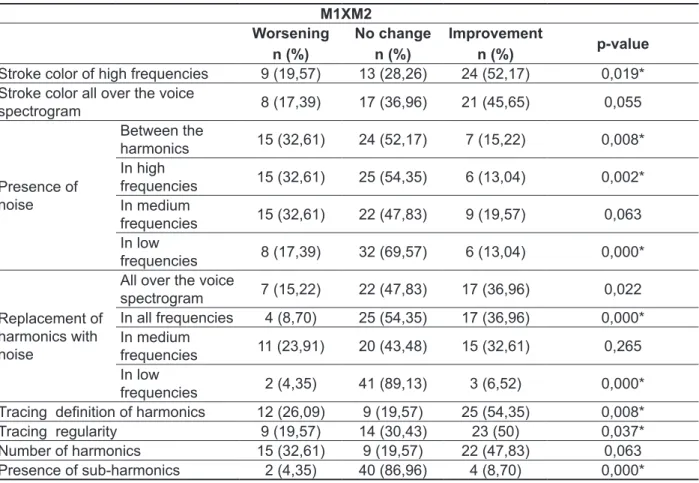
Table 5 – Acoustic vocal modiications in narrowband spectrography between the pair M1 e M2
M1XM2 Worsening
n (%)
No change n (%)
Improvement
n (%) p-value
Stroke color of high frequencies 9 (19,57) 13 (28,26) 24 (52,17) 0,019* Stroke color all over the voice
spectrogram 8 (17,39) 17 (36,96) 21 (45,65) 0,055
Presence of noise
Between the
harmonics 15 (32,61) 24 (52,17) 7 (15,22) 0,008* In high
frequencies 15 (32,61) 25 (54,35) 6 (13,04) 0,002* In medium
frequencies 15 (32,61) 22 (47,83) 9 (19,57) 0,063 In low
frequencies 8 (17,39) 32 (69,57) 6 (13,04) 0,000*
Replacement of harmonics with noise
All over the voice
spectrogram 7 (15,22) 22 (47,83) 17 (36,96) 0,022 In all frequencies 4 (8,70) 25 (54,35) 17 (36,96) 0,000* In medium
frequencies 11 (23,91) 20 (43,48) 15 (32,61) 0,265 In low
frequencies 2 (4,35) 41 (89,13) 3 (6,52) 0,000*
Tracing deinition of harmonics 12 (26,09) 9 (19,57) 25 (54,35) 0,008* Tracing regularity 9 (19,57) 14 (30,43) 23 (50) 0,037* Number of harmonics 15 (32,61) 9 (19,57) 22 (47,83) 0,063 Presence of sub-harmonics 2 (4,35) 40 (86,96) 4 (8,70) 0,000*
Chi Squared Test
* Statistically signiicant values (p<0,05)
Rev. CEFAC. 2014 Jul-Ago; 16(4):1239-1254
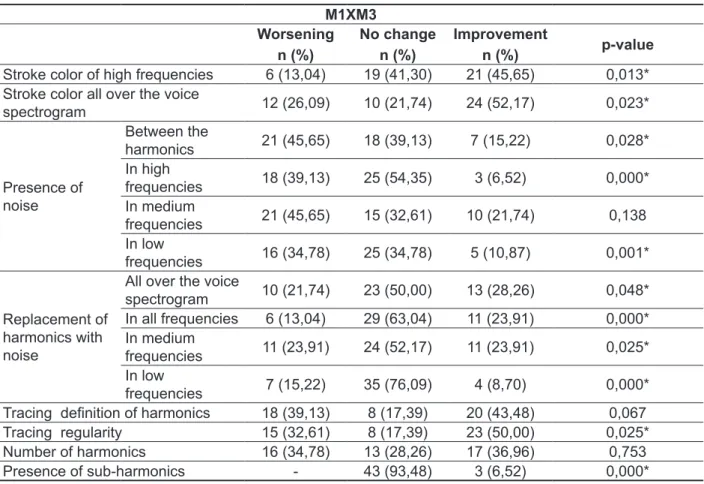
Table 6 – Acoustic vocal modiications in narrowband spectrography between the pair M1 e M3
M1XM3 Worsening
n (%)
No change n (%)
Improvement
n (%) p-value
Stroke color of high frequencies 6 (13,04) 19 (41,30) 21 (45,65) 0,013* Stroke color all over the voice
spectrogram 12 (26,09) 10 (21,74) 24 (52,17) 0,023*
Presence of noise
Between the
harmonics 21 (45,65) 18 (39,13) 7 (15,22) 0,028* In high
frequencies 18 (39,13) 25 (54,35) 3 (6,52) 0,000* In medium
frequencies 21 (45,65) 15 (32,61) 10 (21,74) 0,138 In low
frequencies 16 (34,78) 25 (34,78) 5 (10,87) 0,001*
Replacement of harmonics with noise
All over the voice
spectrogram 10 (21,74) 23 (50,00) 13 (28,26) 0,048* In all frequencies 6 (13,04) 29 (63,04) 11 (23,91) 0,000* In medium
frequencies 11 (23,91) 24 (52,17) 11 (23,91) 0,025* In low
frequencies 7 (15,22) 35 (76,09) 4 (8,70) 0,000*
Tracing deinition of harmonics 18 (39,13) 8 (17,39) 20 (43,48) 0,067 Tracing regularity 15 (32,61) 8 (17,39) 23 (50,00) 0,025* Number of harmonics 16 (34,78) 13 (28,26) 17 (36,96) 0,753 Presence of sub-harmonics - 43 (93,48) 3 (6,52) 0,000*
Chi Squared Test
* Statistically signiicant values (p<0,05)
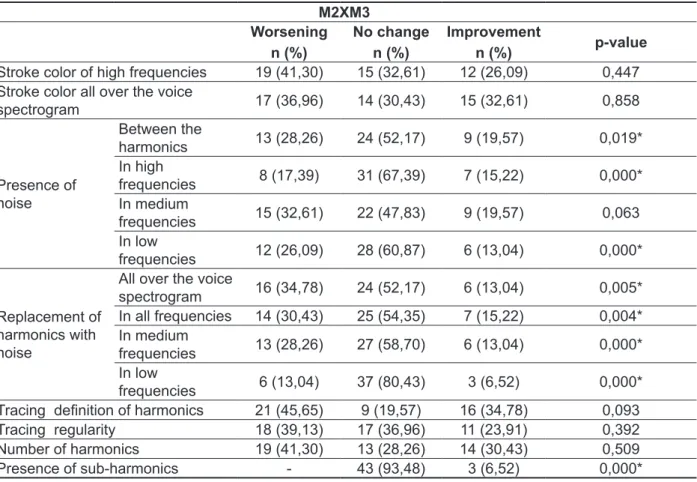
Table 7 – Acoustic vocal modiications in narrowband spectrography between the pair M2 e M3
M2XM3 Worsening
n (%)
No change n (%)
Improvement
n (%) p-value
Stroke color of high frequencies 19 (41,30) 15 (32,61) 12 (26,09) 0,447 Stroke color all over the voice
spectrogram 17 (36,96) 14 (30,43) 15 (32,61) 0,858
Presence of noise
Between the
harmonics 13 (28,26) 24 (52,17) 9 (19,57) 0,019* In high
frequencies 8 (17,39) 31 (67,39) 7 (15,22) 0,000* In medium
frequencies 15 (32,61) 22 (47,83) 9 (19,57) 0,063 In low
frequencies 12 (26,09) 28 (60,87) 6 (13,04) 0,000*
Replacement of harmonics with noise
All over the voice
spectrogram 16 (34,78) 24 (52,17) 6 (13,04) 0,005* In all frequencies 14 (30,43) 25 (54,35) 7 (15,22) 0,004* In medium
frequencies 13 (28,26) 27 (58,70) 6 (13,04) 0,000* In low
frequencies 6 (13,04) 37 (80,43) 3 (6,52) 0,000*
Tracing deinition of harmonics 21 (45,65) 9 (19,57) 16 (34,78) 0,093 Tracing regularity 18 (39,13) 17 (36,96) 11 (23,91) 0,392 Number of harmonics 19 (41,30) 13 (28,26) 14 (30,43) 0,509 Presence of sub-harmonics - 43 (93,48) 3 (6,52) 0,000*
Chi Squared Test
* Statistically signiicant values (p<0,05)
Rev. CEFAC. 2014 Jul-Ago; 16(4):1239-1254
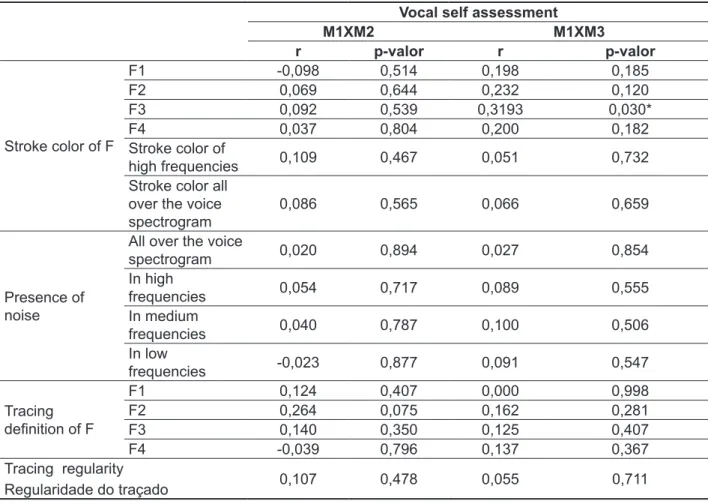
Table 8 – Correlation between vocal self-evaluation and bandwidth spectrography variables
Vocal self assessment
M1XM2 M1XM3
r p-valor r p-valor
Stroke color of F
F1 -0,098 0,514 0,198 0,185 F2 0,069 0,644 0,232 0,120 F3 0,092 0,539 0,3193 0,030* F4 0,037 0,804 0,200 0,182 Stroke color of
high frequencies 0,109 0,467 0,051 0,732 Stroke color all
over the voice spectrogram
0,086 0,565 0,066 0,659
Presence of noise
All over the voice
spectrogram 0,020 0,894 0,027 0,854 In high
frequencies 0,054 0,717 0,089 0,555 In medium
frequencies 0,040 0,787 0,100 0,506 In low
frequencies -0,023 0,877 0,091 0,547
Tracing
deinition of F
F1 0,124 0,407 0,000 0,998 F2 0,264 0,075 0,162 0,281 F3 0,140 0,350 0,125 0,407 F4 -0,039 0,796 0,137 0,367 Tracing regularity
Regularidade do traçado 0,107 0,478 0,055 0,711
Spearman correlation test
*statistically signiicant values (p<0,05)
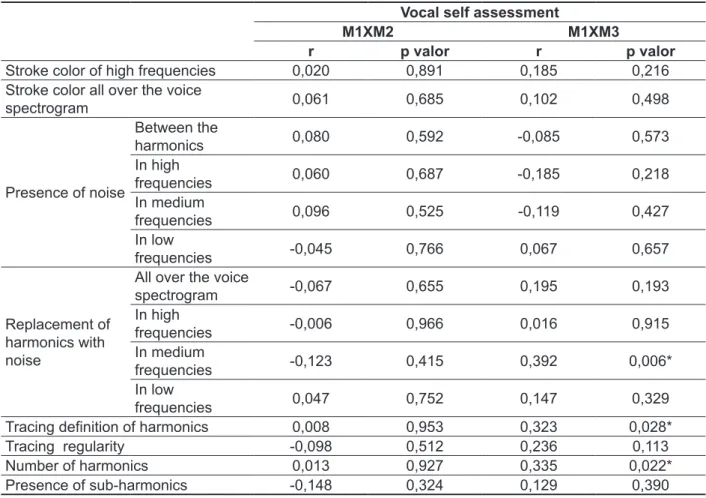
Table 9 – Correlation between vocal self-evaluation and the narrowband spectrography variables
Vocal self assessment
M1XM2 M1XM3
r p valor r p valor
Stroke color of high frequencies 0,020 0,891 0,185 0,216 Stroke color all over the voice
spectrogram 0,061 0,685 0,102 0,498
Presence of noise
Between the
harmonics 0,080 0,592 -0,085 0,573 In high
frequencies 0,060 0,687 -0,185 0,218 In medium
frequencies 0,096 0,525 -0,119 0,427 In low
frequencies -0,045 0,766 0,067 0,657
Replacement of harmonics with noise
All over the voice
spectrogram -0,067 0,655 0,195 0,193 In high
frequencies -0,006 0,966 0,016 0,915 In medium
frequencies -0,123 0,415 0,392 0,006* In low
frequencies 0,047 0,752 0,147 0,329
Tracing deinition of harmonics 0,008 0,953 0,323 0,028* Tracing regularity -0,098 0,512 0,236 0,113 Number of harmonics 0,013 0,927 0,335 0,022* Presence of sub-harmonics -0,148 0,324 0,129 0,390
Spearman correlation test
*statistically signiicant values (p<0,05)
M1- moment 1 M2- moment 2 M3- moment 3
DISCUSSION
The visual record coming from the voice analysis, through the spectroscopy, presents the distribution of energy in the frequency and in time. Also seems to be an effective tool to check the effect of vocal techniques and to evaluate the evolution of the thera-peutic process, although it is a complement analysis to auditory perceptual vocal assessment6,13,35.
The transformation of the air proceeding from the lungs in the form of acoustic energy occurs in the glottal source due to the movements of the mucosa vocal folds and to the intrinsic laryngeal muscles (abductors and tensors). That process is capable of
producing endless cycles of complex waves that are known as harmonics, so that the irst harmonic is
the fundamental frequency (f0). Certain groups of harmonics are changed and known as F, depending
allowing to distinguish the various sounds of the tongue. The F are best evidenced in the SBW 25.
In the SBW of the present study, there was
signiicant improvement in the intensity of F2, F3, F4 and high frequencies, a signiicant improvement of the deinition of F2 and F3 and accuracy of stroke
immediately after FK (M1XM2). We also found a
signiicant increase in the intensity of the stroke color of all F and high frequencies as well as signiicant improvement in the deinition of F3 and F4, after ive
minutes of absolute silence after the completion of FK (M1XM3) (Tables 2, 3 and 4).
In the SBW of the present study, there was an improvement of vocal resonance, reduction of noise, more formant and harmonic power and greater stability of the emission, suggesting a greater pneumo-phono-articulatory coordination with greater projection of the voice radiated from the
Rev. CEFAC. 2014 Jul-Ago; 16(4):1239-1254
There was also a worsening of the tracing regularity between the pair M2-M3, in contradiction
with the signiicant improvement in this aspect
immediately after FK, suggesting that this effect is more immediate and is not maintained for long periods (Table 4).
There were not changes concerning the presence of noise in high, medium and low frequencies. Also there was no change in the bandwidth of F and in the
tracing deinition of F1 during the three comparison
moments (Table 2, 3 and 4), which can be under-stood by the fact that the group does not have vocal complaints, laryngeal disorders or stomatognatical problems that could promote the presence of noise,
nasality or changes in the coniguration of vocal
tract during the emission of /a:/ used for evalua-tions. Results that meet those observed in study with individuals with adapted voices, in which there was not any change in these aspects14.
It is possible that individuals with dysphonic
voices tend to have most signiicant changes
regarding noise after phonotherapy. This possibility
converges with a work that found a signiicant noise
reduction in spectroscopy of male and female voices, with different types of dysphonia after phonotherapy, although with no description of the techniques used in each case of dysphonia6.
In SNB, there was signiicant increase in the
stroke color of high frequencies, in the tracing
deinition of harmonics, in the tracing regularity
and in the stroke color throughout all the vocal spectrogram, suggesting increased harmonic energy and reduction of the aperiodic energy of the vocal spectrogram6, although there was signiicant
worsening of the presence of noise between the harmonics, between the pair M1-M3 (Table 5, 6 and 7).
Extensive mobilization of the mucosa, that occurs due to the increased air low during the
technique, makes that the vocal folds vibrate in a more synchronized way, promoting an improvement of the laryngeal source signal, by the renewal of the mucus layer and the homogenization of the mucosa.
This favours an increase in the number of ampliied harmonics and its tracing deinition of highest, which in turn are better propagated and modiied by the
vocal tract, with improved resonance 5,25,32.
Even, in this work, there were some aspects in
which there were no signiicant changes, such as the
presence of sub-harmonics, the presence of noise between the harmonics in high and low frequencies, and the replacement of harmonics with noise all over the vocal spectrogram and in the high, medium and low frequencies (Tables 5, 6 e 7) reinforce the already mentioned fact that the group studied did
Similar indings were found in another study on SOVTE14, being not found in literature works using a
spectographic analysis with the FK technique. In a study on sonorous tongue vibration technique, also in women without vocal complaints or laryngeal disorders, using three sets of 15
repeti-tions in TMF, there was a signiicant increase in the stroke color and in the tracing deinition of F
as well as in all vocal spectrogram, apart from the improvement in the tracing regularity14.
Some authors suggest that the stroke color of the spectrographic tracing relates to the sound pressure that depends, in addition to respiratory strength, to
the resistance of the glottis (the irst point of discon -tinuity of impedance in vocal production) 6,26. In
vocal production, there are points that change the acoustic impedance, so that the two main ones are
the glottis and the vocal tract. The irst refers to the
relationship between subglottic air pressure and
air low that passes between the vocal folds, while
the second refers to the relationship between the acoustic pressure of the vocal tract and the resulting
air low1,3.
In the present study, the stroke increased color
intensity after FK may be explained due to the
increased impedance of the vocal tract, which occurs in the FK by the semi occlusion of the lips, it acts as a protective mechanism for increasing the glottis air pressure in the supraglottic region, increasing the pressure also at glottic level. This tends to move away the vocal folds and reduce the impact when in contact medially, balancing the pressures at the level of the glottis and vocal tract (interaction
source and ilter or retrolex resonance) 1-3,9,36,37.
The literature shows that this process generates a more economical speech, enabling the same vocal
production with less effort, greater vocal eficiency
and greater absorption of the impact generated during phonation 1,2,4,9,31,36.
Thus, it is conceivable to think that the FK technique has initially generated an increased impedance in the vocal tract interfering in the sound produced by the glottis, which improves the stroke color of the spectrographic elements with more economic phonation after the technique application. This effect is described by some authors as one of
the most pronounced SOVTE features1,2,4.
The increase of the stroke color can also be
related to the extensive mobilization of the mucosa
and to the increased synchronization of the vibration of vocal folds that occurs during the technique with consequent improvement of the laryngeal signal. This generates an increase and a greater
tracing deinition of the harmonic energy and an
In the current study, there was signiicant corre -lation between improvement in M1XM3 of vocal self-assessment and the increasing intensity of F3 stroke color in SBW 5,34,37, and between the improvement
of vocal self-assessment and greater deinition and
number of harmonics in the SNB (Table 8), showing the reciprocity between the subjective sensation of vocal improvement after FK and improvement in the harmonic energy in espectrographies, although the correlation with the replacement of harmonics by the medium frequency noise in SNB.
There were not found in literature works that have addressed such correlations, requiring more researches, using different assessment tools and different study groups, including dysphonic, for increasing knowledge about the effects and
effec-tiveness of the FK technique, allowing the expansion
of the discussions on this topic.
CONCLUSION
In general, after the FK, the SBW showed increased stroke color and increased F tracing
deinition, increase of high frequencies stroke color
and improvement of tracing regularity. There was no
change of F bandwidth, in F1 tracing deinition and
in the presence of noise in the high, medium and low frequencies. However, there was an increase in the presence of noise at high frequencies and a worsening of tracing regularity.
SNB showed an increased stroke color of high frequencies and of the entire spectrogram, improvement of tracing regularity, and improvement of harmonics spectrum. There was no change in the presence of noise between the harmonics of high and low frequencies, in the replacement of harmonics by noise of high, medium and low frequencies and in the entire spectrogram as well as in the presence of sub-harmonics. However, there was a worsening in the presence of noise between the harmonics. The vocal self-evaluation showed better voice after FK.
There was a positive correlation between self-evaluation of better voice and the increase of F3 in the BW stroke color and between the self- evaluation
of better voice and the increase of tracing deinition,
of the number of harmonics, despite the positive correlation with the replacement of harmonics by noise in the medium frequencies of the SNB.
It is possible that FK increases the harmonic energy, projection and stability of the emission, providing better quality voice to the subject.
not have vocal complaints, laryngeal disorders, and presented adapted voices.
The FK, as on of SOVTE, tends to produce
changes in patient’s vocal self-reports, since it alters the proprioception, by increasing the intraoral pressure related to the air outlet resistance (increase in acoustic impedance of the vocal tract), facilitating
the control and the execution of the technique and
helping the self-monitoring of voice1,4. In this study,
through voice self-assessment, it was found that
most of the subjects reported signiicant better voice
at both moments after FK (Table 1).
These facts suggest that the FK, one of
the SOVTE, generates greater comfort during
phonation, possibly due to the change in vocal fold vibration pattern that reduced the degree of adductor tension and to the balance of subglottic and supra-glottic pressure 1,2. Such results can also be related
to the improvement of resonance, displayed on the spectrographic analysis (Tables 2, 3, 4, 5, 6 and 7).
The SOVTE generate vibrations in the orofacial
structures and sometimes on the chest, and the
counterpressure in the larynx 1,2, being an important
factor to be considered in speech therapy, since they help increasing the motivation of the patient that can understand what positive changes are occurring in his voice. For this reason, the vocal self-assessment of the subject has been highly valued and described in several studies 2,4,8,14,15,31,36.
The improve in the self perception of voice after
the FK meets the literature on SOVTE 4,8. In a study
that examined the effects of the immediate execution
of a minute of the phonation technique into tubes with individuals with and without laryngeal
affec-tions, the vocal self-assessment showed signiicant
predominance of positive feelings (easier and better voice) in both evaluated study groups 4.
In the self-evaluation performed by the subjects in a study that evaluated the effect of fricative sound
/ž/ sound technique,a signiicant group majority has
noticed its voice better. Among the positive sensa-tions mentioned were “cleaner and clearer voice with greater production facility, less blurry, more regular, forcing less the emission and managing to keep the voice longer” 8.
However, in research with the performance of a minute blow with sound with seniors, most did not
notice any signiicant effect after the execution of
the technique. This was possibly due to the fact that
the execution time of one minute have been insuf
-icient to cause the perception of vocal changes by
Rev. CEFAC. 2014 Jul-Ago; 16(4):1239-1254
REFERENCES
1. Titze I. Voice training and therapy with a
semioccluded vocal tract: rational and scientiic
underpinnings. J Speech Lang Hear Res. 2006;49(2)448-59.
2. Sampaio M, Oliveira G, Behlau M. Investigação
de efeitos imediatos de dois exercícios de trato vocal semiocluído. Pró-Fono R Atual Cient.
2008;20(4):261-6.
3. Codeiro GF, Montagnoli AN, NemrNK, Menezes MHM, Tsuji DH. Comparative analysis of the closed quotient for lip and tongue trills in relation to the sustained vowel /e/. J Voice. 2011;26(1):17-22. 4. Costa CB, Costa LHC, Oliveira G, Behlau M. Immediate effects of the phonation into a straw
exercise. Braz J Otorhinolaryngol. 2011;77(4):461-5.
5. Behlau M. Voz o Livro do Especialista. Rio de Janeiro: Revinter; 2008.
6. Côrtes MG, Gama ACC. Análise visual de
parâmetros espectrográicos pré e pós-fonoterapia
para disfonias. Rev Soc Bras Fonoaudiol. 2010;15(2):243-9.
7. Colton RH, Casper JK. Leonard, R. Compreendendo os problemas de voz: uma
perspectiva isiológica ao diagnóstico e ao tratamento. Porto Alegre: Artes Médicas, 3º edição.
2010.
8. D’Avila H, Cielo CA, Siqueira MS. Som fricativo
sonoro /Ž/: modiicações vocais. Rev CEFAC.
2010;12(6):915-24.
9. Laukkanen AM, Titze IR, Hoffman HH, Finnegan E. Effects of a semioccluded vocal tract on laryngeal muscle activity and glottal adduction in a single female subject. Folia Phoniatr Logop. 2008;60(6):298-311.
10. Gaskill CS, Quinney DM. The effect of resonance tubes on glottal contact quotient with and without task instruction: a comparison of trained and untrained voices. J Voice. (In press) 2011.
11. Saxon KG, Schneider CM. Vocal exercise physiology. California: Singular Publishing Group, 1995.
12. Menezes MH, Duprat AC, Costa HO. Vocal and laryngeal effects of voiced tongue vibration technique according to performance time. J Voice. 2005;19(1):61-70.
13. Zimmer V, Cielo CA, Finger LS. Modiicações
vocais acústicas espectrográicas produzidas pela fonação reversa. Rev. CEFAC. 2010;12(4):535-42.
14. Schwarz K, Cielo CA. Modiicações laríngeas
e vocais produzidas pela técnica de vibração sonorizada de língua. Pró-Fono R Atual Cient.
2009;21(2):161-6.
15. Zimmer V. Tempo ideal de vibração lingual sonorizada e qualidade vocal de mulheres.
[dissertação]. Santa Maria (RS): Universidade
Federal de Santa Maria, Santa Maria, Programa
de Pós-Graduação em Distúrbios da Comunicação
Humana; 2011.
16. Barros APB, Carrara-de-Angelis E. Análise acústica da voz. In: Dedivitus RA, Barros APB.
Métodos de Avaliação e Diagnóstico da Laringe e Voz. São Paulo: Lovise, 2002. p. 200-21.
17. Martens JWAF, Versnel H, Dejonckere PH. The effect of visibre speech in the perceptual rating of
pathological voices. Arch Otolaryngol Head Neck
Surg. 2007;133(1):178-5.
18. Teles VC, Rosinha ACU. Análise Acústica dos
formantes e das medidas de perturbação do sinal sonoro em mulheres sem queixas vocais, não fumantes e não etilista. Arq Int Otorrinolaringol.
2008;12(4):523-30.
RESUMO
Objetivo: correlacionar modiicações vocais acústicas espectrográicas e autoavaliação após o in
-ger kazoo. Métodos: análise de /a:/ de 46 mulheres sem queixas vocais ou afecções laríngeas pelo
Real Time Spectrogram® e autoavaliaçãoantes (Momento 1 – M1), após o inger kazoo (Momento
2 – M2) e após cinco minutos de silêncio (Momento 3 – M3). Teste Kappa, Qui-quadrado, Spearman.
Resultados: melhora da intensidade do escurecimento do traçado dos formantes (F) e das altas
frequências, regularidade do traçado e deinição dos harmônicos. Melhora na autoavaliação vocal, conforme aumento da intensidade do escurecimento do traçado de F3, da deinição do traçado, do número de harmônicos e redução da substituição de harmônicos por ruídos nas médias frequências.
Conclusões: após o inger kazoo, aumentou a intensidade da cor do traçado, a regularidade e dei
-nição nas espectrograias e houve melhora na autoavaliação vocal.
29. McHenry M, Johnson J, Foshea B. The effect of
speciic versus combined warm-up strategies on the
voice. J Voice. 2008;23(5):572-6.
30. Law T, Lee KIS, Ho FNY, Vlantis AC, Hasselt AC, Tong MCF. The effectiveness of group voice therapy: A group climate perspective. J Voice. 2012;26(2):41-8.
31. Siracusa MGP, Oliveira G, Madazio G,
Behlau M. Efeito imediato do exercício de sopro
sonorizado na voz do idoso. J Soc Bras Fonoaudiol. 2011;23(1):27-31.
32. Laukkanen AM, Horácek J, Krupa P, Svec JG. The effect of phonation into a straw on the vocal tract adjustments and formant frequencies. A preliminary MRI study on a single subject completed with acoustic results. Biomedical Signal Processing and Control. 2012;7(1):50-7.
33. Nemr K, Amar A, Arahão M, Leite GCA, Köhle
J, Santos AO, Correa LAC. Análise comparativa entre avaliação fonoaudiológica
perceptivo-auditiva, análise acústica e laringoscopias indiretas
para avaliação vocal com queixa vocal. Rev Bras Otorrinolaringol. 2005;71(1):13-7.
34. Leino T, Laukkanen AM, Radolf V. Formation of the actor’s/speaker’s formant: A study applying spectrum analysis and computer modeling. J Voice. 2010; 25(2):150-8.
35. Valentim AF, Côrtes NG, Gama ACC. Análise
espectrográica da voz: efeito do treinamento visual na coniabilidade da avaliação. Rev Soc Bras
Fonoaudiol. 2010;15(3):335-42.
36. Titze IR, Laukkanen AM, Finnegan EM, Jaiswal S. Raising lung pressure and pitch in vocal warm-ups:
the use of low-resistant straws. J Singing. 2002;
58(4):329-38.
37. Titze I. How are harmonics produced at the voice source? J Sing. 2009;65: 575-6.
19. Magri A, Stamado T, Camargo Z. A. Inluência da largura de banda de formantes na qualidade vocal. Rev CEFAC. 2009;11(2):296-304.
20. Nunes RB, Souza AMV, Duprat AC, Silva MAA, Costa RC, Paulinho JG. Análise do trato vocal em
pacientes com nódulos, fendas e cisto de prega vocal. Braz J Otorhinol. 2009;75(2):188-92.
21. Brum DM, Cielo CA, Finger LS, Manfrin JA.
Considerações sobre modiicações vocais e laríngeas ocasionadas pelo som basal em mulheres sem queixa vocal. Rev Soc Bras Fonoaudiol.
2010;15(2):282-8.
22. Gama ACC, Alves CFT, Cercau JSB, Teixeira
LC. Correlação entre dados perceptivo auditivos e qualidade de vida de idosas. Pró-Fono R Atual
Cient. 2009;21(2):125-30.
23. Pinho SMR. Fundamentos em fonoaudiologia. 2 ed. Rio de Janeiro: Guanabara Koogan, 2003. 24. Andrews ML. Manual de tratamento da voz: da
pediatria à geriatria. São Paulo: Cengage Learning,
2009.
25. Pinho SMR, Camargo Z. Introdução à análise
acústica da voz e da fala. In: Tópicos em voz. Rio de
Janeiro: Guanabara Koogan, 2001. p. 19-44. 26. Mendonça RA, Sampaio TMM, Oliveira DSF.
Avaliação do programa de exercícios funcionais
vocais de Stemple e Gerdeman em professores. Rev CEFAC. 2010;12(3):471-82.
27. Gama ACC, Santos LLM, Sanches NA, Côrtes MG, Bassi IB. Estudo do efeito do apoio visual
do traçado espectrográico na coniabilidade
da análise perceptivo-auditiva. Rev. CEFAC. 2011;13(2):314-21.
28. Morrison M, Rammage L. The management of voice disorders. Singular Publishing Group, San Diego, London, 1994.
Received on: March 16, 2013 Accepted on: June 18, 2013 Mailing address:
Carla Aparecida Cielo
Rua Guilherme João Fabrin, 545