A Computer-Simulation Study on the Effects
of MRI Voxel Dimensions on Carotid Plaque
Lipid-Core and Fibrous Cap Segmentation
and Stress Modeling
Harm A. Nieuwstadt1, Zaid A. M. Kassar1,2, Aad van der Lugt2, Marcel Breeuwer3,4, Anton F. W. van der Steen1,5, Jolanda J. Wentzel1, Frank J. H. Gijsen1*
1Department of Biomedical Engineering, Erasmus MC, Rotterdam, the Netherlands,2Department of Radiology, Erasmus MC, Rotterdam, the Netherlands,3Philips Healthcare, Best, the Netherlands,
4Department of Biomedical Engineering, Eindhoven University of Technology, Eindhoven, the Netherlands,
5Department of Imaging Science and Technology, Delft University of Technology, Delft, the Netherlands
Abstract
Background
The benefits of a decreased slice thickness and/or in-plane voxel size in carotid MRI for ath-erosclerotic plaque component quantification accuracy and biomechanical peak cap stress analysis have not yet been investigated in detail because of practical limitations.
Methods
In order to provide a methodology that allows such an investigation in detail, numerical sim-ulations of a T1-weighted, contrast-enhanced, 2D MRI sequence were employed. Both the slice thickness (2 mm, 1 mm, and 0.5 mm) and the in plane acquired voxel size (0.62x0.62 mm2and 0.31x0.31 mm2) were varied. This virtual MRI approach was applied to 8 histolo-gy-based 3D patient carotid atherosclerotic plaque models.
Results
A decreased slice thickness did not result in major improvements in lumen, vessel wall, and lipid-rich necrotic core size measurements. At 0.62x0.62 mm2in-plane, only a 0.5 mm slice thickness resulted in improved minimum fibrous cap thickness measurements (a 2–3 fold reduction in measurement error) and only marginally improved peak cap stress computa-tions. Acquiring voxels of 0.31x0.31 mm2in-plane, however, led to either similar or signifi-cantly larger improvements in plaque component quantification and computed peak cap stress.
OPEN ACCESS
Citation:Nieuwstadt HA, Kassar ZAM, van der Lugt A, Breeuwer M, van der Steen AFW, Wentzel JJ, et al. (2015) A Computer-Simulation Study on the Effects of MRI Voxel Dimensions on Carotid Plaque Lipid-Core and Fibrous Cap Segmentation and Stress Modeling. PLoS ONE 10(4): e0123031. doi:10.1371/ journal.pone.0123031
Academic Editor:Heye Zhang, Shenzhen Institutes of Advanced Technology, CHINA
Received:November 12, 2014
Accepted:February 16, 2015
Published:April 9, 2015
Copyright:© 2015 Nieuwstadt et al. This is an open access article distributed under the terms of the Creative Commons Attribution License, which permits unrestricted use, distribution, and reproduction in any medium, provided the original author and source are credited.
Data Availability Statement:All data underlying the findings in our study are freely available in the manuscript.
Conclusions
This study provides evidence that for currently-used 2D carotid MRI protocols, a decreased slice thickness might not be more beneficial for plaque measurement accuracy than a de-creased in-plane voxel size. The MRI simulations performed indicate that not a reduced slice thickness (i.e. more isotropic imaging), but the acquisition of anisotropic voxels with a relatively smaller in-plane voxel size could improve carotid plaque quantification and com-puted peak cap stress accuracy.
Introduction
Carotid magnetic resonance imaging (MRI) is an established modality to image atherosclerotic plaques at the common carotid artery bifurcation [1–3]. MRI is the only currently available,
noninvasive modality to visualize the plaque fibrous cap (FC) and components such as the lipid-rich necrotic core (LRNC) with high contrast, allowing for plaque segmentation [4–6].
Segmentation data can be used to quantify plaque components and to compute the peak cap stress—a biomechanical marker for rupture risk—via finite element analysis (FEA) [7–10].
While three-dimensional (3D) carotid MRI protocols with isotropic spatial resolution have recently been introduced [11–14], the majority of current clinical protocols remain
slice-selec-tive, two-dimensional (2D) sequences [15]. In 2D protocols, anisotropic voxels are acquired with a slice thickness larger than the in-plane acquired voxel size. A slice thickness of 2–3 mm is most commonly used [3,16,17]. Acquiring anisotropic voxels can improve the signal-to-noise ratio (SNR) and/or decrease the total scan time while maintaining a small in-plane voxel size to facilitate visualization in a cross-sectional plane [6,18]. It is commonly argued that a de-creased slice thickness (or isotropic acquisition) would improve imaging by reducing the influ-ence of axial intravoxel partial volume effects caused by axial morphological variations of a plaque within a slice in the slice-select direction [12,17,19]. However, decreasing the slice thick-ness requires a sacrifice in SNR and/or scan time, so careful considerations are called for when making such trade-offs [20]. For example, a study by Balu et al. found no difference in mea-surements of the lumen area, vessel wall area and wall thickness when comparing protocols with slice thicknesses of 0.7 mm (3D, isotropic) and 2 mm (2D, anisotropic) [12]. For more crucial, vulnerable plaque parameters—being LRNC size, minimum FC thickness, and peak cap stress—the potential benefits of a decreased slice thickness in MRI have not
been investigated.
The reason why such investigations have not yet been performed lies in the fact that they re-quire a methodology that provides a direct comparison with a ground truth (i.e., the exact un-derlying geometry) and where the isolated influence of changes in the acquired voxel
dimensions can then be studied in detail. A controlled environment would be needed where other parameters (e.g., noise, motion, and image registration) are kept unaltered and where scan duration due to running many protocols do not pose severe practical limitations on pa-tient inclusion. During recent years, numerous studies presented numerical“virtual”MRI is an effective new methodology to achieve such a controlled environment [21–23]. Through model-ing MR physics (i.e., solvmodel-ing the Bloch equations) guided by scanner-properties, an input ge-ometry with pre-assigned MR properties (e.g., magnetization, relaxation times), and a pulse sequence, one can computer-simulate anin vivoMR image. Due to advances in computer power and the availability of open-source software packages, MRI simulations are increasingly being used to answer clinical image-based questions [23–25].
Effects of MRI Slice Thickness and Voxel Size on Plaque Measurements
preparation of the manuscript. The specific roles of the authors are articulated in the‘author contributions’
section.
In a previous study, we performed numerical simulations of a 2D, contrast-enhanced, T1-weighted carotid MRI protocol [25] using the Jülich Extensible MRI Simulator (JEMRIS) [26]. In this current study we adopted a similar approach. We created a set of 3D ground truth carotid plaque models from histological patient data and performed MRI simulations. We fo-cused on slice thickness and intravoxel partial volume effects which, in turn, affect segmenta-tion accuracy. We quantified the impact of a decreased slice thickness on (1) the measurement error of the lumen area, vessel wall area, LRNC area, and minimum FC thickness and (2) the error in computed peak cap stress. To study the combined influence of in-plane resolution and slice thickness, we repeated the aforementioned investigation with a reduced in-plane
voxel size.
Methods
Ethics statement
This study was approved by the Medical Ethical Committee of the Erasmus Medical Center. Written informed consent was obtained from all subjects.
Histology
Histological data were used to create a set of sufficiently realistic 3D computer models of carot-id plaque geometries to serve as ground truth input sample models for the MRI simulations. Atherosclerotic specimens, obtained at carotid endarterectomy, were decalcified and embedded in paraffin for histological processing. Cross-sectional slices of 5μm thickness were obtained at
1 mm intervals, and an Elastica van Gieson stain was applied. Histological data from eight (n = 8) patients met our requirements, which were: (1) the presence of at least three successive, largely undeformed and undamaged, cross sections which (2) covered at least one large LRNC with a FC. Micron resolution digitized microscopy images of the histology cross-sections were manually segmented for LRNC and fibrous tissue.
Geometry Reconstructions
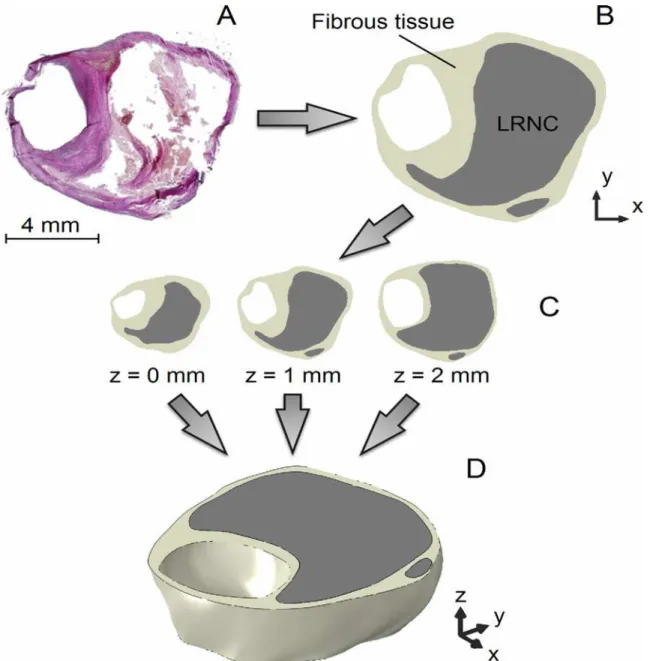
The eight 3D patient plaque models were constructed by vertically stacking the three histology segmentations with intervals of 1 mm and interpolating the contour data in the axial direction (z-direction) with smooth surfaces defined by non-uniform rational basis splines (Gambit, Flu-ent Inc., ANSYS, Canonsburg, Pennsylvania, USA) [27], as shown inFig 1. The contours were aligned by the luminal center of gravity. Prior to simulating MRI, the ground truth models were computationally inflated to 100 mmHg using 3D FEA (see section“Finite Element Analy-sis”). This deformation was applied because the histological sections were not fixated under physiological pressure.
MRI simulations
slice thicknesses were simulated: 0.5 mm, 1 mm, and 2 mm, the latter being the slice thickness of the clinically applied protocol. Because the simulated pulse sequence was not slice-selective the input 3D plaque geometries were altered to simulate MRI with a certain slice thickness: for a 2-mm slice, the entire 3D plaque ground truth model, fromz= 0 mm toz= 2 mm, was used as input. For a 1-mm slice, the 3D ground truth model only betweenz= 0.5 mm andz= 1.5 mm was used, and for a 0.5-mm slice only betweenz= 0.75 mm andz= 1.25 mm. A protocol modification with a doubling of the phase-acquisition steps resulted in a reduced in-plane ac-quisition voxel size of 0.31x0.31 mm2(0.16x0.16 mm2reconstructed). Hence, a total of 6 scan protocols were simulated in this study: two in-plane acquired voxel sizes (original protocol 0.62x0.62 mm2, modified protocol 0.31x0.31 mm2) each with three slice thicknesses (2 mm, 1 mm, and 0.5 mm). The smallest simulated acquired voxel size was 0.31x0.31x0.5 mm3(volume
Fig 1. The reconstruction procedure of a 2-mm thick 3D ground truth carotid plaque model illustrated using an example.(A) Histological section, (B) segmentation of the microscopy image, (C) combination of three cross sections, and (D) reconstructed, interpolated, 3D ground truth plaque model.
doi:10.1371/journal.pone.0123031.g001
of 0.05 mm3) which is, currently, far from achievable in a clinical setting. We chose to simulate this voxel size to also add a prospective value to our study. The largest voxel size was 16 times larger, 0.62x0.62x2 mm3(volume of 0.77 mm3), and was identical to the voxel size from the original, clinically applied protocol. Noise was superimposed in post-processing to yield an SNR of 16.7 [25]. Because we were interested insolelythe influence of voxel dimensions we chose specifically to not vary the SNR. Fibrous tissue, LRNC, and the background (sternoclei-domastoid muscle) were modeled with T1relaxation times of 680 ms, 1220 ms, and 1412 ms, respectively, and a T2of 50 ms (incorporating gadolinium uptake). Perfect blood signal sup-pression was presumed and motion effects were not simulated. The simulated MR images were presented in randomized order, on pre-set contrast-brightness settings to an experienced, blinded, MR reader (Z.K.) for manual segmentation. To avert learning-effects, the lower in-plane resolution images (original protocol) were presented first.
Finite Element Analysis
Tissues were modeled as homogeneous, isotropic, hyperelastic and incompressible using a non-linear neo-Hookean constitutive model. The material constants were 167 kPa for fibrous tissue and 1 kPa for LRNC [28]. FEA computations were performed in Abaqus (Abaqus Standard, 6.11, Dassault Systèmes Simulia Corp., Providence, Rhode Island, USA). Details on meshing and initial/boundary conditions were described previously [27]. The 3D histology-based ground truth models were deformed to anin vivoshape by loading them with a static intralum-inal pressure of 100 mmHg before they were used for MRI simulations. The contours from the MR reader segmentations on the single-slice images were converted to 2D models (plane strain formulation). For the stress computations both the 3D (ground truth) and 2D (MRI segmenta-tions) models were loaded with a systolic pressure of 125 mmHg. The initial stresses present in the MRI segmentation models were computed with the backward incremental method [29].
Analysis
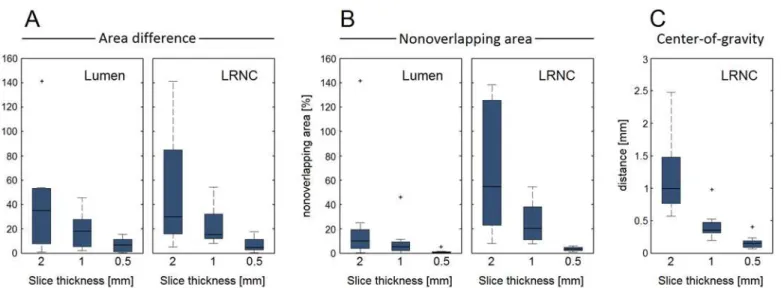
We first studied the geometries of the ground truth models. Three metrics for axial morphologi-cal variations in a given slice thickness were defined: (1) the relative area difference between the top and bottom cross sections, (2) the relative nonoverlapping area between those same top and bottom cross sections, and (3) the maximum in-plane (x,y) shift of the center of gravity. The lat-ter was applied to only the LRNC because the models were defined with an axially aligned lumi-nal center of gravity. For each metric, the absolute value was taken. We then performed the MRI simulations and obtained the lumen area, vessel wall area, LRNC area, minimum FC thickness and peak cap stress from the segmentations. To allow a comparison of a 2D segmentation with the underlying 3D ground truth we normalized for slice thickness by using the ground truth slice averaged area (i.e., volume within the simulated 3D ground truth slice divided by its thickness) instead of volumes. The minimum FC thickness was defined as the shortest distance between LRNC tissue and the lumen. The maximum principal stress was used as the scalar stress measure. For all the aforementioned parameters the relative error was computed with respect to the ground truth value, and a paired Student's t-test was applied to test for statistically significant dif-ferences in the mean (significant ifp<0.05). Data are shown as the mean ± standard deviation.
Results
Ground truth plaque models
the lumen was 13.4 ± 6.6 mm2(range 5.8–24.9 mm2), for the vessel wall 38.6 ± 11.5 mm2 (range 25.2–57.4 mm2), and for the LRNC 15.8 ± 9.7 mm2(range 6.0–34.6 mm2). The mini-mum FC thickness was 0.27 ± 0.20 mm (range 0.10–0.67 mm). InFig 3, the three metrics for axial morphological variations (area difference, nonoverlapping area, and center of gravity) are shown in box plots as a function of the slice thickness.
Plaque component measurements
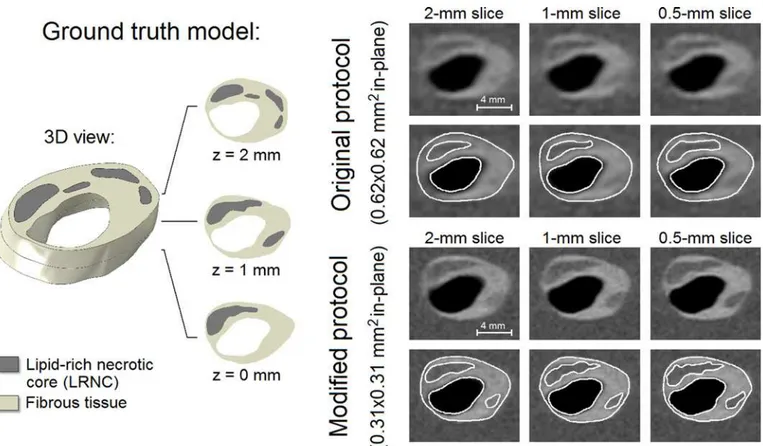
The example inFig 4shows a 3D ground truth plaque model, the simulatedin vivocarotid MR images, and their segmentations. The ground truth model encompassed one main LRNC cov-ering the entire 2-mm axial distance and various smaller LRNCs atz= 1 mm andz= 2 mm. Segmentation inaccuracies appeared to be mostly attributable to the limited in-plane resolu-tion, not the slice thickness. The modified MRI protocol (0.31x0.31 mm2in-plane) provided more in-plane detail which resulted in (1) a more accurate segmentation, (2) the positive iden-tification of one additional smaller LRNC atz= 1 mm, and (3) more profound axial partial
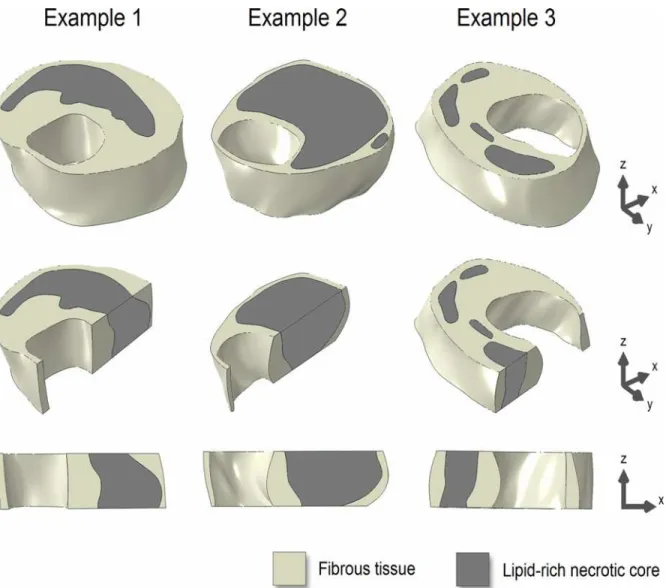
Fig 2. Three examples of the 3D ground truth plaque models (top row).Longitudinal cross-sectional views (middle and bottom rows) illustrate axial morphological variations.
doi:10.1371/journal.pone.0123031.g002
volume effects, making delineation accuracy more dependent on slice thickness. Due to re-duced axial partial volume effects when the slice thickness was decreased, the contrast between the FC and LRNC tissues locally increased, improving FC visualization.
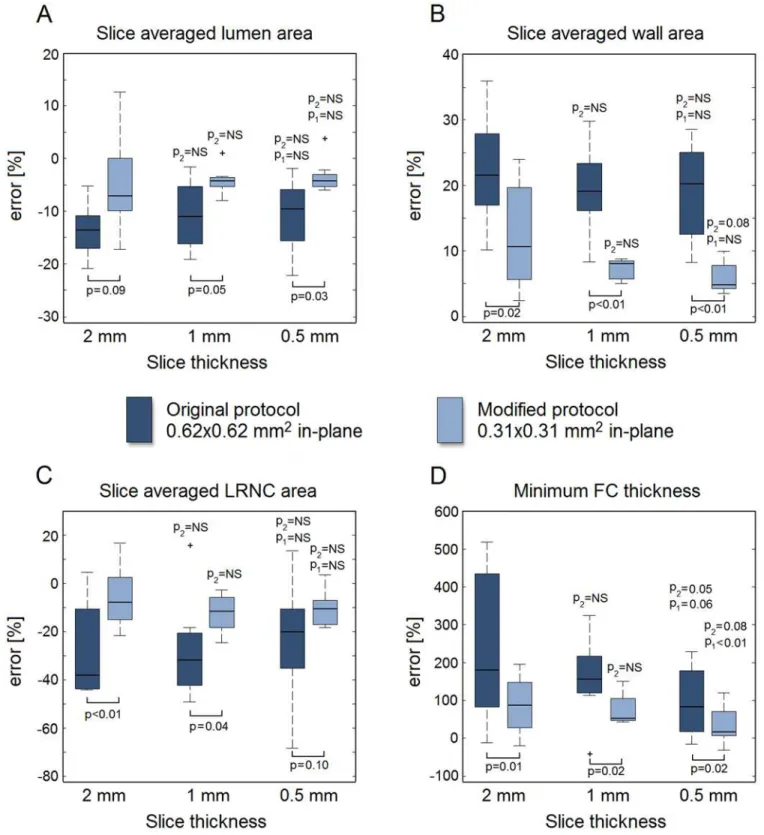
For all eight models, the measurement errors of all geometrical parameters for both in-plane voxel sizes and each slice thickness are shown in box plots inFig 5. The lumen and LRNC areas were, on average, underestimated while the vessel wall area and minimum FC thickness were overestimated. When measuring the lumen area, vessel wall area, and LRNC area, no major improvements were observed when the slice thickness was decreased (for 0.62x0.62 mm2in-plane). On the other hand, we found larger, statistically significant, improve-ments when decreasing the in-plane voxel size for any given slice thickness, as well as substan-tial reductions in error spread (i.e., increased precision) for all geometrical parameters. The minimum FC thickness was the only parameter for which the error significantly improved when only the slice thickness was reduced. This occurred for a 0.5-mm slice thickness versus a 2-mm slice for the original protocol (p= 0.05), and versus a 1-mm slice for the modified proto-col (p<0.01). The measurement error for minimum FC thickness significantly improved from
+238% ± 200% for 0.62x0.62x2 mm3voxels to only +35% ± 50% for 0.31x0.31x0.5 mm3voxels (p<0.01). We found no significant correlations between the geometrical axial variation metrics
in the ground truth models and the measurement errors in MRI.
The fact that a highly anisotropic 0.31x0.31x2 mm3voxel has the same volume (0.19 mm3) as a near isotropic 0.62x0.62x0.5 mm3voxel allowed an evaluation regarding voxel anisotropy. LRNC area measurements were far more accurate and precise when acquiring the highly aniso-tropic voxels instead of near isoaniso-tropic voxels: an error of -6% ± 13% versus -23% ± 24% (p= 0.03). Acquiring the highly anisotropic voxels also improved the mean measurement error of the lumen (-5% anisotropic versus -11% isotropic,p= 0.16) and vessel wall (+11% versus +19%,p= 0.17) areas. While not statistically significant, the lowp-values imply trends. For minimum FC thickness, there was no difference (+88% versus +96%,p= 0.77), indicating that axial and in-plane FC variations were comparable.
Fig 3. Three metrics quantify the axial geometrical variations in the ground truth models as a function of slice thickness.(A) Relative area difference between slice top and bottom cross sections for lumen and LRNC, (B) relative nonoverlapping area between slice top and bottom cross sections for lumen and LRNC, and (C) maximum in-plane shift of the center of gravity within the slice (C). Whiskers in the box plots represent maximum/minimum data points not considering outliers, which are marked by plus (+) symbols.
Plaque stress computations
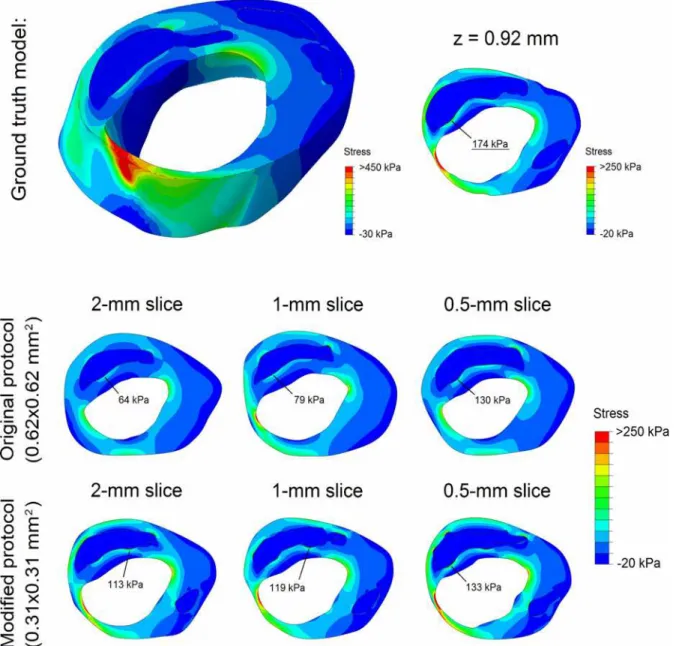
The example inFig 6shows the stress distributions in a 3D ground truth plaque model and in the corresponding 2D models based on MRI segmentations. In the 3D model a heterogeneous stress distribution was present, with high plaque stresses in the mid-cap (thin) and plaque shoulders (high luminal curvature). The ground truth peak cap stress was 174 kPa (atz= 0.92 mm). The MRI-based models exhibited a similar stress distribution, but with a severe peak cap stress underestimation. A thinner segmented FC yielded a higher stress and, in effect, a reduced underestimation. The underestimation of peak cap stress (related to FC thickness overestima-tion [28]) decreased for a reduced slice thickness and/or a reduced in-plane voxel size.
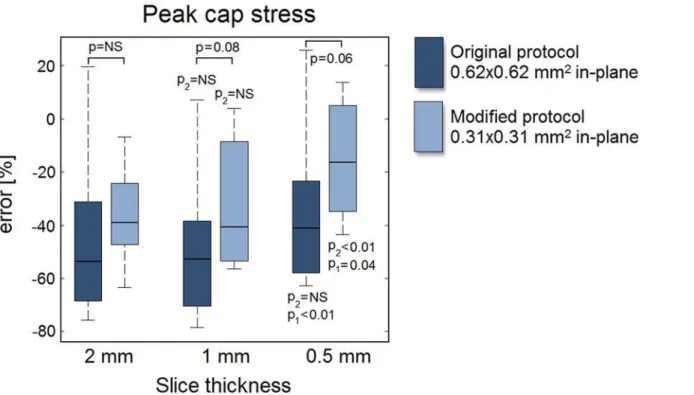
For all eight models, the error of the MRI segmentation model peak cap stress is shown in
Fig 7for both the original (0.62x0.62 mm2) and the modified protocol (0.31x0.31 mm2) as a
function of the slice thickness. The peak cap stress was severely underestimated, with a large imprecision (i.e., large error spread). The interquartile ranges indicate no improvements in pre-cision for a decreased slice thickness or in-plane voxel size. A decreased slice thickness only im-proved the mean error when 0.5-mm slices were acquired, while a reduced in-plane voxel size (for any given slice thickness) always resulted in larger improvements. The lowp-values (p= 0.08 for a 1-mm slice andp= 0.06 for a 0.5-mm slice) indicate trends. The smallest voxel size (0.31x0.31x0.5 mm3) yielded an error of -15% ± 22% versus an error of -45% ± 32% for the largest voxel size (0.62x0.62x2 mm3) (p<0.01). Interestingly, acquiring highly anisotropic
vox-els (0.31x0.31x2 mm3) instead of near isotropic voxels (0.62x0.62x0.5 mm3) with the same
Fig 4. An example of a 3D ground truth input model (left) with its 6 simulated in vivo carotid MR images with different voxel dimensions and segmentation (right).Axial domain of the simulated geometry for a 2-mm slice: z = 0 to 2 mm, for a 1-mm slice: z = 0.5 to 1.5 mm, and for a 0.5-mm slice: z = 0.75 to 1.25 mm.
doi:10.1371/journal.pone.0123031.g004
Fig 5. Relative error in measured value with respect to the ground truth for the geometrical parameters studied:(A) lumen area, (B) wall area, (C) LRNC area, and (D) minimum FC thickness. Whiskers in the box plots represent maximum/minimum data points not considering outliers, which are marked by plus (+) symbols. The p-values with respect to the 2-mm and 1-mm slice data are indicated with p2 and p1, respectively. A p-value is denoted as NS (not significant) if p>0.10.
volume had little effect on the peak cap stress error (-36% ± 18% anisotropic versus -35% ± 30% isotropic,p= 0.89).
Discussion
In this study, we investigated the degree to which axial intravoxel partial volume effects, associ-ated with acquiring a specific slice thickness, contribute to errors in atherosclerotic plaque component measurements and peak cap stress computations in carotid MRI. A simulated, vir-tual MRI approach allowed direct quantification of measurement error in a controlled environ-ment where only the voxel dimensions were varied.
Fig 6. Stress distribution in an example 3D ground truth model (top row) and the stress distributions in its 6 2D MRI segmentation models (middle and bottom rows).The location and magnitude of the peak cap stress is indicated in each model.
doi:10.1371/journal.pone.0123031.g006
General observations
Using eight 3D plaque models created from three stacked consecutive histological cross-sec-tions and performing single-slice MRI simulacross-sec-tions, we found that for an in-plane acquired voxel size of 0.62x0.62 mm2, a decreased slice thickness did not significantly improve measure-ments of the lumen, vessel wall and LRNC size, but it did have a beneficial effect on the accura-cy of minimum FC thickness measurements. Note that we did not simulate any localized scan plane angulations. Furthermore, only a 0.5-mm slice led to a relatively marginal improvement in the error in computed peak cap stress. A reduction in the in-plane voxel size to 0.31x0.31 mm2, however, led to similar or often larger improvements. LRNC measurements improved when anisotropic voxels were acquired instead of isotropic voxels of the same volume (error of -6% ± 13% versus -23% ± 24%,p= 0.03). Similar trends were observed for the other parameters studied. Our findings provide evidence that current 2D carotid MRI protocols for plaque quan-tification appropriately sacrifice axial resolution to reduce scan time and/or noise. The com-monly used argument that a standard 2-mm slice thickness limits imaging therefore only applies to small, localized features such as the FC. Consequently, 3D carotid MRI protocols could be modified by reducing the slice-select phase-encoding steps (i.e., transitioning from isotropic to anisotropic voxels), thus reducing scan time. We confirmed the reports of Balu et al. with regard to the unimproved vessel wall and lumen measurements [11,12], and, by vir-tue of our simulation methodology, studied more crucial, vulnerable plaque parameters. A ground truth comparison as employed in our study allowed a quantification of measurement accuracy, the absence of which was a limitation in most previous studies which only assessed reproducibility [9,11,12,18,30]. The observed overestimations (wall area and FC thickness) and underestimations (lumen area, LRNC area, and peak cap stress) were in line with previous
Fig 7. Relative error in the MRI segmentation model predicted peak cap stress with respect to the ground truth peak cap stress as a function of slice thickness.For details, see caption ofFig 5.
reports [25,28,31–33]. A recent study by van Wijk et al., also found that higher voxel anisotro-py improved wall measurements [18]. In a previous study, we reported the large inaccuracy in minimum FC measurements [25], while assuming a uniform axial morphology within a slice. The findings from the present study show that intraslice axial FC variations lead to a much larger inaccuracy in measured FC thickness than previously reported [25].
Axial variations rapidly decreased when the slice thickness was reduced. Although indica-tive, the axial variation metrics were quite strict when linked to MRI segmentation because they only use data on the axial boundaries of a slice. Gradual intensity changes due to partial volume effects in an MRI slice will lead to a correct‘slice-averaged’segmentation, and thus to a relatively precise measurement of the component volume. Indeed, with regard to MRI slice thickness, volumetric plaque components are inherently more forgiving than, for instance, minimum FC thickness, which is a very localized parameter both in-plane and axially. The lack of any correlation between the axial variation metrics and measurement errors also suggests that segmentation accuracy is more influenced by the in-plane voxel size than by the slice thickness.
Clinical implications
In clinical practice, alterations in voxel dimensions affect scan time and SNR. A decrease in voxel size would either result in an increased scan time, a lower SNR, or a combination of both. Scan time and SNR were not the focus of this study and therefore not investigated. A trade-off can easily become more complicated than the mere application of the standard SNR equation when considering, for example, 3D versus 2D protocols [34], motion artifacts [35], and imper-fect black-blood signal suppression [30,36]. Note that we found that, even with anunaltered
SNR, a decreased slice thickness was often not beneficial. In a previous study, we explored the trade-off between scan time, SNR and in-plane resolution, and found that SNR was less limit-ing than the resolution for manual segmentation [25]. However, Rhonen et al. investigated the effects of SNR and in-plane resolution in anex vivostudy using thin histological slices, and concluded that SNR had a large impact on automated tissue classification [20]. While our study provides relevant data, the true clinical benefit when trading-off voxel dimensions against scan time, noise, motion-artifacts and blood signal suppression needs to be investigated in further studies [31]. Additionally, in our study we did not focus on the bifurcation, and we did not incorporate angulations of the simulated vessels. This makes our findings only applica-ble to fairly straight vessels or an MRI acquisition with an imposed oblique scan plane orienta-tion in the direcorienta-tion of the vessel at the plaque locaorienta-tion. In case of large vessel angulaorienta-tions or bifurcations, the use of 3D isotropic imaging could be more beneficial. In especially elderly pa-tients, the left and right carotid arteries tend to not be parallel. Isotropic imaging could also be beneficial when imaging certain other plaque components such as small calcifications. We could not investigate this in this study due to decalcification of the histological specimens. We purposely imposed a relatively high SNR to create MR images that on the one hand were as re-alistic as possible, but in which, on the other hand, noise would not be the weakest link [25]. We restricted ourselves by focusing on only partial volume effects caused by finite voxel dimen-sions, because these effects are a critical and often addressed (but insufficiently studied) issue in carotid MRI studies [10,12,17,28,34,37]. We did therefore not study additional possible ben-efits of a decreased slice thickness in clinical practice such as improved axial image matching in longitudinal studies, improved retrospective multi-planar reformatting [11,12], easier registra-tion to histology slices [17,38], and a decreased sensitivity to a localized oblique scan plane ori-entation [32]. A reduction in slice thickness would serve a double benefit for plaque FEA since it would also increase the axial sampling resolution for 3D multislice-based plaque FEA [27].
Study limitations
Eight representative carotid plaques were used. From a statistical point of view our study was exploratory: the sample size was not sufficiently large to corroborate the statistical significance of relatively small differences between means. Nevertheless, such small changes are immaterial for practical applications, especially when considered in conjunction with the observed large spread in errors. Intraplaque hemorrhage was absent in the histological sections, and decalcifi-cation inhibited the inclusion of calcifidecalcifi-cations in the ground truth models. For small calcifica-tions, isotropic imaging can be beneficial [11,12]. The 3D ground truth models were created by interpolating histology slices which had a 1-mm axial spacing. This is a limitation considering the fact that the MRI slice thickness was in the same order of magnitude. However, the exam-ples shown in Figs1,2and4indicate the presence of axial variations on sub-millimeter scales (due to the 3D spline interpolation). In addition, the examples do not evidence critical axial under sampling. By aligning the luminal center of gravity of the histological sections, we as-sumed no oblique scan plane orientation at the slice of interest (for details, see [32]). For the MRI, the imposed SNR was relatively high, motion was neglected, and homogeneous compo-nents were used. These factors, when combined, make the errors we report in this study repre-sentative for a best-case imaging scenario. Only single-slice simulations were performed with uniform axial excitation, neglecting influences from adjacent slices. This choice was made be-cause such influences (e.g., cross talk in 2D sequences or point spread function effects in the slice-select phase direction in 3D sequences) can be highly protocol-specific. For a detailed dis-cussion regarding the MRI simulations using JEMRIS, we refer to our previous work [25]. Re-sidual stresses, heterogeneity and collagen/elastin fiber directionality were not included in the biomechanical models [39], but this did not compromise the comparisons which involved sole-ly geometrical differences.
Conclusions
This simulation study provides evidence that in the absence of intraslice vessel obliquity, mea-surements of the lumen, vessel wall or LRNC size in carotid MRI do not majorly improve when decreasing the slice thickness, even if the SNR remains unaltered. For minimum FC thickness and the closely related peak cap stress magnitude, a decreased slice thickness was beneficial, but not more than a decreased in-plane voxel size. Our simulations provide evidence that in certain cases, not a decreased slice thickness, but the acquisition of anisotropic voxels that can improve lumen, LRNC, and FC thickness quantification and computed peak cap stress accura-cy in a clinical setting. The presumed benefit of 3D isotropic voxel acquisition in other cases, such as in the presence of large vessel angulations, bifurcations, or when imaging small plaque components such as calcifications, needs to be quantified in future studies.
Supporting Information
S1 Fig. The other five 3D plaque models used in this study.3D models (top row) and their longitudinal cross-sectional views (middle and bottom rows) illustrate axial
morphological variations. (TIF)
Acknowledgments
Author Contributions
Conceived and designed the experiments: HAN ZAMK AL MB AFWS JJW FJG. Performed the experiments: HAN ZAMK. Analyzed the data: HAN. Wrote the paper: HAN ZAMK AL MB AFWS JJW FJG.
References
1. Yuan C, Mitsumori LM, Beach KW, Maravilla KR. Carotid atherosclerotic plaque: noninvasive MR char-acterization and identification of vulnerable lesions. Radiology 2001; 221:285–99. PMID:11687667
2. Cai JM, Hatsukami TS, Ferguson MS, Small R, Polissar NL, Yuan C. Classification of human carotid atherosclerotic lesions with in vivo multicontrast magnetic resonance imaging. Circulation 2002; 106:1368–1373. PMID:12221054
3. Underhill HR, Hatsukami TS, Fayad AZ, Fuster V, Yuan C. MRI of carotid atherosclerosis: clinical impli-cations and future directions. Nat Rev Cardiol 2010; 7:165–173. doi:10.1038/nrcardio.2009.246PMID: 20101259
4. Toussaint J, LaMuraglia GM, Southern JF, Fuster V, Kantor HL. Magnetic resonance images lipid, fi-brous, calcified, hemorrhagic, and thrombotic components of human atherosclerosis in vivo. Circulation 1996; 94:932–938. PMID:8790028
5. Cai J, Hatsukami TS, Ferguson MS, Kerwin WS, Saam T, Chu B, et al.In vivoquantitative measure-ment of intact fibrous cap and lipid-rich necrotic core size in atherosclerotic carotid plaque: comparison of high-resolution, contrast-enhanced magnetic resonance imaging and histology. Circulation 2005; 112:3437–3444. PMID:16301346
6. Li F, Yarnykh VL, Hatsukami TS, Chu B, Balu N, Wang J, et al. Scan-rescan reproducibility of carotid atherosclerotic plaque morphology and tissue composition measurements using multicontrast MRI at 3T. J Magn Reson Imaging 2010; 31:168–76. doi:10.1002/jmri.22014PMID:20027584
7. Cheng GC, Loree HM, Kamm RD, Fishbein MC, Lee RT. Distribution of circumferential stress in rup-tured and stable atherosclerotic lesions. A structural analysis with histopathological correlation. Circula-tion 1993; 87:1179–87. PMID:8462145
8. Li ZY, Howarth S, Trivedi RA, U-King-Im JM, Graves MJ, Brown A, et al. Stress analysis of carotid pla-que rupture based on in vivo high resolution MRI. J Biomech 2006; 39:2611–2622. PMID:16256124
9. Gao H, Long Q, Graves M, Gillard JH, Li Z. Study of Reproducibility of human arterial plaque recon-struction and its effects on stress analysis based on multispectralin vivomagnetic resonance imaging. J Magn Reson Imaging 2009; 30:85–93. doi:10.1002/jmri.21799PMID:19557850
10. Tang D, Teng Z, Canton G, Yang C, Ferguson M, Huang X, et al. Sites of rupture in human atheroscle-rotic carotid plaques are associated with high structural stresses: an in vivo MRI-based 3D fluid-struc-ture interaction study. Stroke 2009; 40:3258–3263. doi:10.1161/STROKEAHA.109.558676PMID: 19628799
11. Balu N, Chu B, Hatsukami TS, Yuan C, Yarnykh VL. Comparison between 2D and 3D high-resolution black-blood techniques for carotid artery wall imaging in clinically significant atherosclerosis. J Magn Reson Imaging 2008; 27:918–924. doi:10.1002/jmri.21282PMID:18383253
12. Balu N, Yarnykh VL, Chu B, Wang J, Hatsukami T, Yuan C. Carotid plaque assessment using fast 3D isotropic resolution black-blood MRI. Magn Reson Med 2011; 65:627–637. doi:10.1002/mrm.22642 PMID:20941742
13. Liu W, Balu N, Sun J, Zhao X, Chen H, Yuan C, et al. Segmentation of carotid plaque using multicon-trast 3D gradient echo MRI. J Magn Reson Imaging 2012; 35:812–819. doi:10.1002/jmri.22886PMID: 22127812
14. Li B, Dong L, Chen B, Ji S, Cai W, Wang Y, et al. Turbo fast three-dimensional carotid artery black-blood MRI by combining three-dimensional MERGE sequence with compressed sensing. Magn Reson Med 2013; 70:1347–1352. doi:10.1002/mrm.24579PMID:23280949
15. Watanabe Y, Nagayama M. MR plaque imaging of the carotid artery. Neuroradiology 2010; 52:253– 274. doi:10.1007/s00234-010-0663-zPMID:20155353
16. Truijman MT, Kooi ME, van Dijk AC, de Rotte AA, van der Kolk AG, Liem MI, et al. Plaque At RISK (PARISK): prospective multicenter study to improve diagnosis of high-risk carotid plaques. Int J Stroke 2014; 9:747–754. doi:10.1111/ijs.12167PMID:24138596
17. Coombs BD, Rapp JH, Ursell PC, Reilly LM, Saloner D. Structure of plaque at carotid bifurcation: high-resolution MRI with histological correlation. Stroke 2001; 32:2516–2521. PMID:11692010
18. van Wijk DF, Strang AC, Duivenvoorden R, Enklaar DJ, van der Geest RJ, Kastelein JJ, et al. Increas-ing spatial resolution of 3T MRI scannIncreas-ing improves reproducibility of carotid arterial wall dimension measurements. MAGMA 2014; 27:219–226. doi:10.1007/s10334-013-0407-2PMID:24046072
19. González Ballester MA, Zisserman AP, Brady M. Estimation of the partial volume effect in MRI. Med Image Anal 2002; 6:389–405. PMID:12494949
20. Ronen RR, Clarke SE, Hammond RR, Rutt BK. Resolution and SNR effects on carotid plaque classifi-cation. Magn Reson Med 2006; 56:290–295. PMID:16773656
21. Hackländer T, Mertens H. Virtual MRI: a PC-based simulation of a clinical MR scanner. Acad Radiol 2005; 12:85–96. PMID:15691729
22. Benoit-Cattin H, Collewet G, Belaroussi B, Saint-Jalmes H, Odet C. The SIMRI project: a versatile and interactive MRI simulator. J Magn Reson 2005; 173:97–115. PMID:15705518
23. Xanthis CG, Venetis IE, Aletras AH. High performance MRI simulations of motion on multi-GPU sys-tems. J Cardiovasc Magn Reson 2014; 4:16–48.
24. Klepaczko A, Szczypiński P, Dwojakowski G, Strzelecki M, Materka A. Computer simulation of magnet-ic resonance angiography imaging: model description and validation. PLoS One 2014; 9:e93689. doi: 10.1371/journal.pone.0093689PMID:24740285
25. Nieuwstadt HA, Geraedts TR, Truijman MT, Kooi ME, van der Lugt A, van der Steen AF, et al. Numeri-cal simulations of carotid MRI quantify the accuracy in measuring atherosclerotic plaque components in vivo. Magn Reson Med 2014; 72:188–201. doi:10.1002/mrm.24905PMID:23943090
26. Stöcker T, Vahedipour K, Pflugfelder D, Shah NJ. High-performance computing MRI simulations. Magn Reson Med 2010; 64:186–193. doi:10.1002/mrm.22406PMID:20577987
27. Nieuwstadt HA, Akyildiz AC, Speelman L, Virmani R, van der Lugt A, van der Steen AFW, et al. The in-fluence of axial image resolution on atherosclerotic plaque stress computations. J Biomech 2013; 46:689–695. doi:10.1016/j.jbiomech.2012.11.042PMID:23261242
28. Nieuwstadt HA, Speelman L, Breeuwer M, van der Lugt A, van der Steen AF, Wentzel JJ, et al. The influence of inaccuracies in carotid MRI segmentation on atherosclerotic plaque stress computations. J Biomech Eng 2014; 136:021015-1–9. doi:10.1115/1.4026178PMID:24317274
29. Speelman L, Akyildiz AC, den Adel B, Wentzel JJ, van der Steen AF, Virmani R, et al. Initial stress in biomechanical models of atherosclerotic plaques. J Biomech 2011; 44:2376–2382. doi:10.1016/j. jbiomech.2011.07.004PMID:21782179
30. Balu N, Kerwin WS, Chu B, Liu F, Yuan C. Serial MRI of carotid plaque burden: influence of subject repositioning on measurement precision. Magn Reson Med 2007; 57:592–599. PMID:17326176
31. Schär M, Kim WY, Stuber M, Boesiger P, Manning WJ, Botnar RM. The impact of spatial resolution and respiratory motion on MR imaging of atherosclerotic plaque. J Magn Reson Imaging 2003; 17:538–544. PMID:12720263
32. Antiga L, Wasserman BA, Steinman DA. On the overestimation of early wall thickening at the carotid bulb by black blood MRI, with implications for coronary and vulnerable plaque imaging. Magn Reson Med 2008; 60:1020–1028. doi:10.1002/mrm.21758PMID:18956420
33. Hofman JMA, Branderhorst WJ, ten Eikelder HMM, Cappendijk VC, Heeneman S, Kooi ME, et al. Quantification of atherosclerotic plaque components using in vivo MRI and supervised classifiers. Magn Reson Med 2006; 55:790–799. PMID:16526020
34. Luk-Pat GT, Gold GE, Olcott EW, Hu BS, Nishimura DG. High-resolution three-dimensional in vivo im-aging of atherosclerotic plaque. Magn Reson Med 1999; 42:762–771. PMID:10502766
35. Al-Kwifi O, Kim JK, Stainsby J, Huang Y, Sussman MS, Farb RI, et al. Pulsatile motion effects on 3D magnetic resonance angiography: implications for evaluating carotid artery stenoses. Magn Reson Med 2004; 52:605–611. PMID:15334581
36. Dong L, Wang J, Yarnykh VL, Underhill HR, Neradilek MB, Polissar N, et al. Efficient flow suppressed MRI improves interscan reproducibility of carotid atherosclerosis plaque burden measurements. J Magn Reson Imaging 2010; 32:452–458. doi:10.1002/jmri.22274PMID:20677277
37. Yuan C, Kerwin WS. MRI of atherosclerosis. J Magn Reson Imaging 2004; 19:710–719. PMID: 15170778
38. Groen HC, van Walsum T, Rozie S, Klein S, van Gaalen K, Gijsen FJ, et al. Three-dimensional registra-tion of histology of human atherosclerotic carotid plaques to in-vivo imaging. J Biomech 2010;
43:2087–2092. doi:10.1016/j.jbiomech.2010.04.005PMID:20444453