www.atmos-meas-tech.net/8/451/2015/ doi:10.5194/amt-8-451-2015
© Author(s) 2015. CC Attribution 3.0 License.
Multi-wavelength optical measurement to enhance thermal/optical
analysis for carbonaceous aerosol
L.-W. A. Chen1,2,3, J. C. Chow2,3, X. L. Wang2, J. A. Robles2, B. J. Sumlin2, D. H. Lowenthal2, R. Zimmermann4, and J. G. Watson2,3
1Department of Environmental and Occupational Health, University of Nevada, Las Vegas, Nevada 89154, USA 2Division of Atmospheric Sciences, Desert Research Institute, Reno, Nevada 89512, USA
3Key Laboratory of Aerosol Science & Technology, SKLLQG, Institute of Earth Environment, Chinese Academy of Sciences, Xi’an, China
4Joint Mass Spectrometry Centre, Chair of Analytical Chemistry, Institute of Chemistry, University of Rostock, Rostock, Germany
Correspondence to:L.-W. A. Chen ([email protected])
Received: 22 July 2014 – Published in Atmos. Meas. Tech. Discuss.: 10 September 2014 Revised: 11 December 2014 – Accepted: 13 December 2014 – Published: 27 January 2015
Abstract. A thermal/optical carbon analyzer equipped with seven-wavelength light source/detector (405–980 nm) for monitoring spectral reflectance (R) and transmittance (T) of filter samples allowed “thermal spectral analysis (TSA)” and wavelength (λ)-dependent organic-carbon
(OC)–elemental-carbon (EC) measurements. Optical sensing was calibrated with transfer standards traceable to absolute R and T mea-surements, adjusted for loading effects to report spectral light absorption (as absorption optical depth (τa,λ)), and
ver-ified using diesel exhaust samples. Tests on ambient and source samples show OC and EC concentrations equivalent to those from conventional carbon analysis when based on the same wavelength (∼635 nm) for pyrolysis adjustment. TSA provides additional information that evaluates black-carbon (BC) and brown-black-carbon (BrC) contributions and their optical properties in the near infrared to the near ultraviolet parts of the solar spectrum. The enhanced carbon analyzer can add value to current aerosol monitoring programs and provide insight into more accurate OC and EC measurements for climate, visibility, or health studies.
1 Introduction
Thermal/optical analysis (TOA) quantifies particulate-matter (PM) organic carbon (OC) and elemental carbon (EC) col-lected on quartz-fiber filters (Watson et al., 2005; Cao et
al., 2007; Bougiatioti et al., 2013). TOA based on the IM-PROVE_A protocol (Chow et al., 2007a, 2011) has de-termined OC and EC concentrations in tens of thousands of samples each year from long-term chemical speciation networks operated in the US (IMPROVE, 2014; U.S.EPA, 2014), Canada (Dabek-Zlotorzynska et al., 2011), and China (Zhang et al., 2012). IMPROVE_A specifies stepped heating up to 580◦C in an inert helium (He) atmosphere (>99.99 %
purity), where most organic compounds are either evaporated or decomposed (Chow et al., 1993), followed by a second stage of stepped heating to 840◦C in 98 % He/2 % O2to
re-move EC on the filter. Since some of the OC is converted to EC through pyrolysis in pure He, as evidenced by darkening of the filter, IMPROVE_A also specifies a reflectance pyrol-ysis adjustment. Reflected light at wavelengthλ=633 nm is
monitored throughout the heating (Huntzicker et al., 1982). OC and EC are defined as carbon evolved before and after the filter reflectance (R) returns to its initial level, respectively.
sig-nal is influenced by POC both on and within the filter (Chen et al., 2004; Chow et al., 2004). Unlike IMPROVE_A, which reports both ECR and ECT, other TOA protocols employ dif-ferent temperature steps, often reporting only the ECT results (Birch and Cary, 1996; Cavalli et al., 2010; NIOSH, 1999; Schauer et al., 2003; Peterson and Richards, 2002).
The R and/or T measurements as part of TOA can infer the light absorption coefficient (babs), analogous to the
prin-ciple of optical absorption monitors such as the aethalome-ter (Hansen et al., 1984), particle-soot absorption photomeaethalome-ter (PSAP; Bond et al., 1999), and the multi-angle absorption photometer (MAAP; Petzold and Schönlinner, 2004). Both the aethalometer and PSAP apply T attenuation, while the MAAP incorporates both R and T attenuations in the cal-culation ofbabs. In any case, it is necessary to compensate for multiple-scattering and loading effects of the particle-filter matrix that cause deviations from the simple Beer’s law (Chen et al., 2004; Arnott et al., 2005b; Virkkula et al., 2005). Black-carbon (BC) concentrations can be derived from babs by applying a mass- and wavelength-specific ab-sorption efficiency (MAEλ, typically in m2g−1). Many
col-located measurements show high correlations but different slopes in BC/EC comparisons (Ahmed et al., 2009; Quincey et al., 2009; Reisinger et al., 2008; Snyder and Schauer, 2007; Chow et al., 2009). This confirms the overlapping concept of EC and BC but also signifies the complex nature of carbona-ceous material and uncertainties in such measurements (An-dreae and Gelencséer, 2006; Moosmüller et al., 2009; Petzold et al., 2013; Lack et al., 2014).
While BC (or EC) absorbs light strongly across the so-lar spectrum (300–1000 nm), some organic compounds that evolve in the OC step can also absorb light, especially at shorter wavelengths (<600 nm). These compounds have
been termed “brown carbon” (BrC) and are associated with the smoldering phase of biomass burning and some end prod-ucts of secondary aerosol formation (Andreae and Gelencsér, 2006; Clarke et al., 2007; Zhang et al., 2011). The spectral dependence ofbabsis often described byα:
α(λ)= −dln(babs(λ))
dln(λ) , (1)
whereα(λ)is the absorption Ångström exponent. For BC (or
EC) with graphitic-like structure and a constant refractive in-dex,α=1 andbabsis proportional toλ−1. For BrC and
min-eral dust,αvaries withλand is mostly>1 (Moosmüller et
al., 2009; Chen et al., 2015), causingbabs to increase more rapidly towards shorter wavelengths (blue and ultraviolet) than is the case for BC. The aerosol deposit thus appears to be brown – or sometimes yellow, red, or chartreuse – as the longer wavelengths of illuminating light are reflected and the shorter wavelengths are absorbed. The multi-wavelength aethalometer has revealed different spectral patterns that are indicative of BC, BrC, dust, and their mixtures (Sandradewi et al., 2008; Favez et al., 2009; Yang et al., 2009).
Given the large number of samples per year analyzed by TOA worldwide, the optical data acquired as part of the anal-ysis could be used, in addition to OC and EC, for stud-ies relevant to source apportionment, human health, visi-bility, and climate. Described and characterized here is a retrofit of a TOA carbon analyzer that expands the single-wavelength R and T monitoring to seven single-wavelengths for the IMPROVE_A analysis, hereafter designated thermal spec-tral analysis (TSA). Equivalence of the OC and EC frac-tions from TOA and TSA is demonstrated for several source and receptor samples, and the wavelength dependence of the OC–EC split is investigated. An approach to report spectral
babs (as absorption optical depth) and αfor decoupling the
BC and non-BC components is also introduced. As an aid to readers, all abbreviations used in this paper are listed in the Supplement (Table S1).
2 Instrument design and calibration
The 633 nm He/neon (Ne) laser in the DRI Model 2001 car-bon analyzer (Chow et al., 2011; Chen et al., 2012) is re-placed with a package of seven diode lasers with wavelengths (λ)of 405, 450, 532, 635, 780, 808, and 980 nm. The use
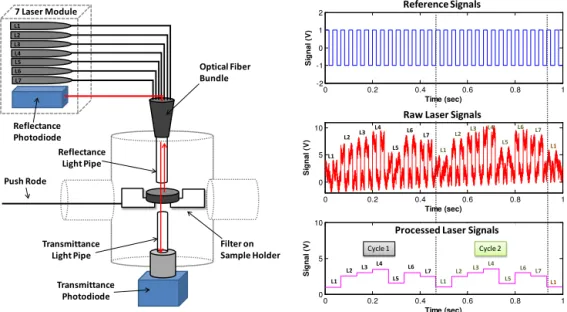
of diode lasers substantially reduces the cost of the optical module. It also provides stronger signals than using a light-emitting diode (LED) in other designs (e.g., Hadley et al., 2008), despite being limited by the wavelengths commer-cially available. While the 635 nm approximates the He/Ne laser, other wavelengths were selected to cover the visible and near-infrared regions. The lasers are alternately pulsed (2 consecutive pulses per laser, 14 pulses per cycle) and lock-in amplified at a frequency of 30 Hz, resultlock-ing lock-in two cycles and∼four pulses for each wavelength every second. The bi-furcated fiber optic for delivering the He/Ne laser to the
re-flectance light pipe is replaced with an eight-furcated optical-fiber bundle, one for each of the lasers and the last for trans-ferring the light reflected from the filter punch (0.5 cm2)to a
photodiode (Fig. 1). Another light pipe on the opposite side of the filter directs the transmitted light toward a separate photodiode detector.
Photodiode signals are acquired with an NI6216 data ac-quisition system (National Instruments, Austin, TX) at a rate of up to 100 000 data points per second. The system inte-grates the product of photodiode and reference (30 Hz square wave) signals every second to suppress noise (e.g., from 60 Hz power supply and oven glow, random noise, and base-line drift). The resulting integrals are reported as the spectral laser reflectance and transmittance (LRλ and LTλ,
respec-tively). Example thermograms with LRλ and LTλ are
illus-trated in Fig. S1 of the Supplement.
LRλ and LTλ are relative terms depending on not only
fil-0 0.2 0.4 0.6 0.8 1 0
5 10
Time (sec)
S
ig
n
a
l
(V
)
Transmittance Photodiode Reflectance Photodiode
Reflectance Light Pipe
Optical Fiber Bundle
Transmittance Light Pipe
Filter on Sample Holder 7 Laser Module
L1 L2 L3 L4 L5 L6 L7
Push Rode
0 0.2 0.4 0.6 0.8 1
-2 -1 0 1 2
Time (sec)
S
ig
n
a
l
(V
)
Reference Signals
L1 L2 L3
L5 L4
0 0.2 0.4 0.6 0.8 1
0 5 10
Time (sec)
S
ig
n
a
l
(V
)
L6 L7
L1
L2 L3
L4
L5
L6 L7
L1
Cycle 1 Cycle 2
Processed Laser Signals Raw Laser Signals
L1 L2 L3
L4
L5 L6
L7
L1
L2 L3
L4
L5
L6 L7
L1
Figure 1.Configuration of optical sensing (left) modified from the DRI Model 2001 analyzer (Chen et al., 2012). The seven-laser module
(i.e., L1-L7) represents seven diode lasers with wavelengths of 405, 450, 532, 635, 780, 808, and 980 nm. Reference (top right) and laser (middle right) signals are modulated at 30 Hz for a lock-in amplification of the reflectance or transmittance signals (bottom right). Only 30 Hz signals with the same phase as the reference are amplified at gains proportional to the reference signal voltage and number of data points integrated.
ter reflectance and transmittance (FRλ and FTλ, i.e.,
frac-tion of light reflected from or transmitted through the fil-ter, respectively), using a set of transfer standards con-sisting of eight PM2.5 quartz-fiber filters acquired using
high-volume samplers from the Fresno Supersite (Watson et al., 2000; Chow et al., 2009), with EC loadings ranging from 0.9 to 15.8 µg cm−2(Fig. S2). The high-volume filters
(406 cm2)represent well-characterized urban aerosol, while providing sufficient sample for extensive testing. FRλ and
FTλ of the transfer standards were predetermined using an
integrating-sphere spectrometer (Lambda 35, Perkin Elmer, Massachusetts, USA; see, e.g., Zhong and Jang, 2011; Chen et al., 2015) traceable to NIST (National Institute of Standard and Technology) standards for wavelengths between 300 and 1000 nm.
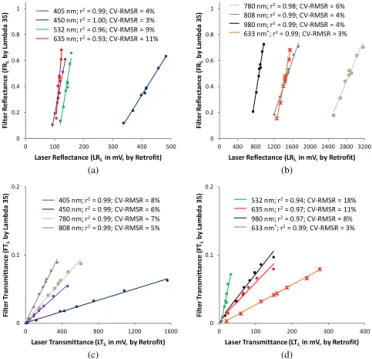
Figure 2 compares LRλ and LTλ with FRλ and FTλ,
re-spectively, for the transfer standards. Within the range of FRλ
(0.1–0.8) and FTλ (0.0001–0.1), highly significant linear
re-lationships (r2>0.9) demonstrate the stability of the LRλ
and LTλmeasurements and the feasibility of converting them
to FRλand FTλthrough calibration with a standardized
spec-trometer. Figure S1 illustrates the changes in FRλ and FTλ,
retrieved from LRλand LTλ, throughout a typical TSA. The
uncertainty of the FRλ and FTλ retrievals may be evaluated
by the coefficient of variance of the root mean square resid-ual (CV-RMSR) in the FRλ/LRλand FTλ/LTλregression,
respectively:
CV-RMSR= 1
Yobs
s P
(Ycal−Yobs)2
n−2 , (2)
whereYobsis the FRλor FTλmeasured by the
integrating-sphere spectrometer,Ycal is the FRλor FTλcalculated from
LRλ or LTλ, respectively, andn is the number of samples.
FR633 nmand FT633 nm based on the He/Ne laser of a
typi-cal Model 2001 analyzer exhibit a∼3 % uncertainty (Fig. 2). For this retrofit, FRλuncertainties range from 3 to 11 % and
FTλuncertainties range from 5 to 18 %, with the best
preci-sion shown at 450 and 808 nm. The divergence in uncertainty is attributed to the quality of the laser and the sensitivity of the photodiode detector for different wavelengths. Ongoing efforts to improve the signal-to-noise ratio of R and T mea-surements by using different lasers and averaging algorithms will be documented in subsequent papers.
3 Consistency of the OC–EC split
respec-Table 1.Comparison of TC, OCR, OCT, ECR, and ECT between the 633 nm (TOA) and 635 nm (TSA) optical splits following the
IM-PROVE_A protocol.a
Sample type Optical split (nm)b Sample no. and avg.c Corr. Deming regression:y=m×x+b RD: 2(y−x)/(y+x)
x y n x y r2 mc(±1σd) bc(±1σd) mean±1σ pe
TC
Fresno Supersite 635 633 10 20.30 20.05 1.00 0.97±0.05 0.38±0.75 −0.01±0.04 0.56
Reno wildfire 635 633 14 30.69 30.21 1.00 0.91±0.06 2.14±1.18 0.04±0.09 0.15
Prescribed burn 635 633 9 19.27 20.11 1.00 1.06±0.09 −0.32±1.12 0.01±0.14 0.91
Diesel exhaust 635 633 11 8.10 7.78 0.97 0.99±0.05 −0.26±0.48 −0.06±0.15 0.21
All 635 633 44 20.34 20.23 0.99 0.95±0.07 0.89±1.00 0.00±0.12 0.85
OCR
Fresno Supersite 635 633 10 16.02 15.91 0.99 0.97±0.06 0.44±0.76 0.00±0.05 0.85
Reno wildfire 635 633 14 27.62 26.99 1.00 0.90±0.07 2.09±1.27 0.03±0.09 0.30
Prescribed burn 635 633 9 17.22 18.25 1.00 1.07±0.06 −0.12±0.76 0.03±0.13 0.65
Diesel exhaust 635 633 11 4.08 3.91 0.52 0.95±0.35 0.04±1.35 −0.04±0.17 0.46
All 635 633 44 16.97 16.91 0.99 0.94±0.08 0.90±0.99 0.00±0.12 0.68
OCT
Fresno Supersite 635 633 10 17.80 17.82 1.00 1.01±0.03 −0.17±0.43 0.00±0.04 0.85
Reno wildfire 635 633 14 29.07 28.64 1.00 0.92±0.06 1.93±1.19 0.03±0.08 0.14
Prescribed burn 635 633 9 18.11 18.92 1.00 1.07±0.05 −0.37±0.72 0.01±0.13 0.65
Diesel exhaust 635 633 11 4.42 4.14 0.46 1.01±0.46 −0.33±1.91 −0.07±0.20 0.32
All 635 633 44 18.10 18.07 0.99 0.96±0.07 0.74±0.94 −0.01±0.13 0.75
ECR
Fresno Supersite 635 633 10 4.28 4.15 1.00 0.99±0.06 −0.11±0.17 −0.06±0.08 0.06
Reno wildfire 635 633 14 3.07 3.22 0.99 1.04±0.07 0.02±0.15 0.12±0.23 0.14
Prescribed burn 635 633 9 2.05 1.86 0.88 0.92±0.18 −0.03±0.34 −0.13±0.25 0.25
Diesel exhaust 635 633 11 4.02 3.87 0.99 0.97±0.07 −0.03±0.23 −0.17±0.30 0.12
All 635 633 44 3.37 3.31 0.99 1.00±0.03 −0.05±0.08 −0.04±0.25 0.17
ECT
Fresno Supersite 635 633 10 2.50 2.23 0.99 0.78±0.12 0.29±0.22 −0.07±0.14 0.13
Reno wildfire 635 633 14 1.62 1.57 0.98 0.82±0.02 0.24±0.07 0.10±0.30 0.33
Prescribed burn 635 633 9 1.16 1.18 0.85 0.87±0.10 0.17±0.13 0.07±0.30 0.50
Diesel exhaust 635 633 11 3.68 3.64 0.99 0.92±0.13 0.24±0.30 −0.08±0.33 0.70
All 635 633 44 2.24 2.16 0.98 0.90±0.03 0.14±0.06 0.01±0.28 0.74
aTC: total carbon; OCR: organic carbon by reflectance; OCT: organic carbon by transmittance; ECR: elemental carbon by reflectance; and ECT: elemental carbon by transmittance
following the IMPROVE_A thermal/optical carbon analysis protocol (Chow et al., 2007a). TOA: thermal/optical analyses; TSA: thermal/spectral analyses.bxis by retrofitted seven-wavelength carbon analyzer;yis by conventional single-wavelength (633 nm) DRI Model 2001 thermal/optical carbon analyzer.cConcentration in µg cm−2;mis the slope;bis the intercept in µg cm−2.dσ: standard deviation.eStudent’sttestpvalues.
tively. All these samples were analyzed by both TSA (using the retrofit) and TOA (using conventional Model 2001 ana-lyzers) following the IMPROVE_A protocol.
Table 1 compares total carbon (TC), OC, and EC by re-flectance (i.e., OCR and ECR) and transmittance (i.e., OCT and ECT) between TSA with the 635 nm and TOA with the normal 633 nm OC–EC split. As expected, TC is equiva-lent, with the averages agreeing within±5 % and regression slopes (m) ranging from 0.91 and 1.06 for each of the four sample types. The relative difference (RD), defined as the ra-tio of the difference divided by the average of two measure-ments (i.e., TSA and TOA) on the same sample, does not differ from 0 at the 5 % significance level (p >0.05). The
standard deviations of RD, a measure of random error, are higher for source (14–15 %) than for ambient (4–9 %) sam-ples, indicative of greater deposit inhomogeneity for these samples, possibly due to variable sampling conditions over short sampling durations.
TSA and TOA also yield statistically equivalent OC and EC results, either by R or T (Table 1). Figure 3 visualizes the comparisons. With respect to the standard deviation of RD, OCR and OCT are similar to TC, while ECR and ECT are higher (up to 33 %) due to a lower fraction of EC in TC. By category average, ECR and ECT account for 10–50 and 5– 46 % of TC, respectively. In general, ECR>ECT, as reported
(a) (b)
(c) (d)
0 0.2 0.4 0.6 0.8 1
0 100 200 300 400 500
Fi lt er R ef lec ta n ce (F Rλ by L a m bda 3 5 )
Laser Reflectance (LRλin mV, by Retrofit) Linear (405 nm)
Linear (455 nm) Linear (532 nm) Linear (635 nm)
405 nm; r2= 0.99; CV-RMSR = 4% 450 nm; r2= 1.00; CV-RMSR = 3% 532 nm; r2= 0.96; CV-RMSR = 9% 635 nm; r2= 0.93; CV-RMSR = 11%
0 0.2 0.4 0.6 0.8 1
0 400 800 1200 1600 2000 2400 2800 3200
Fi lt er R ef lec ta n ce (F Rλ by L a m bda 3 5 )
Laser Reflectance (LRλin mV, by Retrofit) Linear (780 nm)
Linear (808 nm) Linear (980 nm) Linear (TOA633nm) 780 nm; r2= 0.98; CV-RMSR = 6% 808 nm; r2= 0.99; CV-RMSR = 4% 980 nm; r2= 0.99; CV-RMSR = 4% 633 nm*; r2= 0.99; CV-RMSR = 3%
0 0.1 0.2
0 400 800 1200 1600
Fi lte r T ra n sm itta n ce ( FT λ by L a m bda 3 5 )
Laser Transmittance (LTλin mV, by Retrofit) Linear (405 nm)
Linear (455 nm) Linear (780 nm) Linear (808 nm)
405 nm; r2= 0.99; CV-RMSR = 8% 450 nm; r2= 0.99; CV-RMSR = 6% 780 nm; r2= 0.99; CV-RMSR = 7% 808 nm; r2= 0.99; CV-RMSR = 5%
0 0.1 0.2
0 100 200 300 400
Fi lte r T ra n sm itta n ce ( FT λ by L a m bda 3 5 )
Laser Transmittance (LTλin mV, by Retrofit) Linear (532 nm)
Linear (635 nm) Linear (980 nm) Linear (TOA633nm)
532 nm; r2= 0.94; CV-RMSR = 18% 635 nm; r2= 0.97; CV-RMSR = 11% 980 nm; r2= 0.97; CV-RMSR = 8% 633 nm*; r2= 0.99; CV-RMSR = 3%
Figure 2.Calibration of spectral laser(a, b)reflectance and(c, d)
transmittance measurements (LRλ and LTλ, respectively, in milli-volts (mV)) from the retrofitted seven-wavelength carbon analyzer at room temperature against absolute filter reflectance and trans-mittance (FRλ and FTλ, respectively) quantified by the Lambda integrating-sphere spectrometer, using eight Fresno ambient sam-ples (5/6, 6/6, 6/19, 7/3, 9/29, 11/4, 11/13, and 12/28 of 2003) of various loadings as transfer standards. The 633 nm data are from a conventional carbon analyzer.r2and CV-RMSR evaluate the re-gression performance.
et al., 2001; Schmid et al., 2001), consistent with organic va-pors pyrolyzed within the filter leaving the sample after na-tive EC and POC in the surface deposit have evolved (Chen et al., 2004). POC was least apparent for the diesel exhaust samples where optical adjustments were negligible.
The basic assumptions for optical adjustment include the following: (1) OC does not absorb light and (2) POC has the same apparent MAE as EC. Within-the-filter POC shows no apparent MAE by R (i.e., cannot detect it for any wave-lengths) but high MAEs by T (higher than EC due to a multiple-scattering effect (Chow et al., 2004; Subramanian et al., 2006)). This leads to divergent ECR and ECT re-sults. Since the multiple-scattering effect is larger for shorter wavelengths, ECT is expected to decrease with the wave-length at which the split is made. On the other hand, Chow et al. (1993) observed that the operational definition for EC by any TOA protocol might contain some light-absorbing OC. BrC, if present, would lower the baselines of R and T (prior to thermal analysis) for shorter wavelengths, resulting in ear-lier split points and larger EC reported than that from longer wavelengths.
Table 2 compares OC–EC splits for 635 nm with splits derived from shorter (450 nm) and longer (808 nm)
wave-(a) (b)
(c) (d)
0 1 10 100
0 1 10 100
C o n v e n ti o n a l T O A ( 6 3 3 n m) , µ g /c m 2
New TSA (635 nm), µg/cm2 OCR Fresno Wildfire P. Burning Mobile 0 1 10 100
0 1 10 100
C o n v e n ti o n a l T O A ( 6 3 3 n m) , µ g /c m 2
New TSA (635 nm), µg/cm2 ECR Fresno Wildfire P. Burning Mobile 0 1 10 100
0 1 10 100
C o n v e n ti o n a l T O A ( 6 3 3 n m) , µ g /c m 2
New TSA (635 nm), µg/cm2 OCT Fresno Wildfire P. Burning Mobile 0 1 10 100
0 1 10 100
C o n v e n ti o n a l T O A ( 6 3 3 n m) , µ g /c m 2
New TSA (635 nm), µg/cm2 ECT
Fresno Wildfire P. Burning Mobile
Figure 3. Comparison of organic and elemental carbon by
re-flectance optical correction (i.e., OCR and ECR, respectively) be-tween the conventional thermal/optical analysis (TOA based on 633 nm optical split) and seven-wavelength thermal/spectral analy-sis (TSA based on 635 nm optical split) following the IMPROVE_A protocol. Note thatxandyaxes are on log scales.
lengths that have the lowest LR or LT uncertainties. ECRs based on the 635 nm split agree well with those based on the 808 nm split (i.e., slopes within the standard error from unity and p(RD)>0.02) for all the sample types. This
demon-strates that the 633 nm R split commonly used for optical adjustment since Huntzicker et al. (1982) does not signif-icantly respond to BrC absorption compared with longer visible or infrared wavelengths. For ECT, the 880 nm split yielded higher values than the 635 nm split, especially for biomass-burning-dominated samples. This is consistent with ECT being influenced by POC within the filter and decreas-ing ECT with decreasdecreas-ing wavelength.
Table 2.Comparison of TSA-determined 635 nm ECR and ECT with 880 nm and 450 nm following the IMPROVE_A protocol.
Sample type Optical split (nm)a Sample no. and avg.b Corr. Deming regression:y=m×x+b RD: 2(y−x)/(y+x)
x y n x y r2 mb(±1σc) bb(±1σc) mean±1σ pd
ECR
Fresno Supersite 635 450 10 4.28 4.74 1.00 1.23±0.04 −0.55±0.13 0.01±0.13 0.82
Reno wildfire 635 450 14 3.07 4.29 0.95 1.90±0.58 −1.55±1.24 0.14±0.25 0.06
Prescribed burn 635 450 9 2.05 2.14 0.98 1.41±0.23 −0.74±0.39 −0.03±0.16 0.57
Diesel exhaust 635 450 11 4.02 3.93 1.00 1.00±0.01 −0.10±0.06 −0.08±0.11 0.06
All 635 450 44 3.37 3.86 0.90 1.36±0.28 −0.71±0.66 0.02±0.19 0.76
Fresno Supersite 635 808 10 4.28 4.12 1.00 0.95±0.08 0.06±0.22 −0.05±0.05 0.03
Reno wildfire 635 808 14 3.07 3.22 1.00 1.04±0.08 0.03±0.17 0.15±0.23 0.02
Prescribed burn 635 808 9 2.05 2.12 0.99 1.00±0.09 0.06±0.17 0.03±0.09 0.30
Diesel exhaust 635 808 11 4.02 4.00 1.00 1.00±0.00 −0.02±0.02 −0.01±0.02 1.00
All 635 808 44 3.37 3.40 1.00 0.99±0.03 0.05±0.07 0.04±0.16 0.19
ECT
Fresno Supersite 635 450 10 2.50 2.44 1.00 1.00±0.02 −0.05±0.07 −0.04±0.08 0.16
Reno wildfire 635 450 14 1.62 1.35 0.99 0.85±0.06 −0.02±0.06 −0.20±0.14 0.00
Prescribed burn 635 450 9 1.16 1.07 0.98 1.06±0.25 −0.16±0.22 −0.08±0.24 0.16
Diesel exhaust 635 450 11 3.68 3.59 1.00 0.97±0.01 0.01±0.04 −0.04±0.06 0.07
All 635 450 44 2.24 2.10 0.99 0.97±0.02 −0.08±0.03 −0.10±0.16 0.00
Fresno Supersite 635 808 10 2.50 2.67 1.00 1.03±0.04 0.10±0.08 0.08±0.04 0.00
Reno wildfire 635 808 14 1.62 2.00 0.99 1.24±0.04 −0.01±0.08 0.18±0.18 0.00
Prescribed burn 635 808 9 1.16 1.27 0.99 1.10±0.12 −0.01±0.12 −0.09±0.60 0.13
Diesel exhaust 635 808 11 3.68 3.53 1.00 0.99±0.01 −0.11±0.07 −0.24±0.41 0.01
All 635 808 44 2.24 2.38 0.99 1.01±0.07 0.11±0.12 0.00±0.38 0.02
axandyare both by modified seven-wavelength carbon analyzer but with optical pyrolysis adjustment at different wavelengths.bConcentration in µg cm−2;mis the slope;bis the
intercept in µg cm−2.cσ: standard deviation.eStudent’sttestpvalues.
4 Multi-wavelength absorption retrieval
Light absorption by particles on the filter is often estimated by transmittance attenuation (ATN):
ATNλ= −ln
FT
λ,i
FTλ,f
, (3)
whereiandf indicate FTλmeasured before and after
ther-mal analysis, respectively. FTλ,f approximates a blank
fil-ter since all of the carbon has been removed. ATNλincludes
scattering and absorption within the substrate. On the other hand, the absorption optical depth (τa,λ)measures only the
light absorption. For diesel soot samples with negligible BrC and POC,
τa,λ=MAEλ,EC× [EC], (4)
where [EC] is the areal concentration of EC on filter in µg cm−2. If there were no filter effects, ATN andτa would be identical for a given λas described by Beer’s law. With
the knowledge of sampling volume (V) and filter area (A),
ambientbabscan be calculated fromτa×A/V.
The relationship of [EC] and ATN635 nm throughout the EC2 step (740◦C in a 98 % He/2 % O2atmosphere) of the
IMPROVE_A analysis for a diesel exhaust sample is shown in Fig. 4. Since in this case carbon evolved during EC2 is ex-clusively EC, the temporal variation in [EC], i.e., d[EC]/dt,
can be determined from carbon released and detected by the carbon analyzer. Arnott et al. (2005b) proposed a quadratic relationship between [EC] and ATN, derived from
dATNλ
dt =
Mλ×MAEλ,EC
√1
+βλ× [EC]×
d[EC]
dt (5)
and thus
[EC] =4 βλ
(Mλ×MAEλ,EC)2ATNλ
2
+ 1
Mλ×MAEλ,EC
ATNλ, (6)
where Mλ and βλ account for the wavelength-specific
multiple-scattering and loading effects, respectively. Eq. (6) fits the relationship in Fig. 4 well (r2>0.99), thereby
al-lowingMλ andβλ to be estimated. EC (quantified by
Simi-y = 1.70x2+ 0.75x
R² = 1.00
y = 0.13x2+ 0.06x
R² = 1.00
0 0.2 0.4 0.6 0.8 1 1.2 1.4
0 5 10 15 20
0 1 2 3 4
τa
a
t
635 n
m
E
C
(
µ
g
c
m
-2)
ATN635nm
[EC] during the EC2 step Diesel Exhaust Samples
[EC]/ATN Regression
τa/ATN Regression
Figure 4. Relationship of EC concentration, [EC], versus
ATN635 nmfrom all 1 s measurements during the EC2 step (740◦C
in a 98 % He/2 % O2atmosphere) of IMPROVE_A analysis for a diesel exhaust sample (CIFQ074 from the Gas/Diesel Split Study (Fujita et al., 2007)). Also shown are paired [EC]–ATN635 nmof 11 diesel exhaust samples, where EC is determined from IMPROVE_A and ATN635 nm from initial filter transmittance. Circles and er-ror bars indicate the average and spread, respectively, of EC by transmittance and reflectance (i.e., ECT and ECR, respectively). τa,635 nmwas further calculated from a MAE of 7.4 m2g−1×[EC],
and the regression result between τa,635 nm and ATN635 nm is shown in green.
lar relationships hold between [EC] and ATN for other wave-lengths (Fig. S3). The largest scatter observed for 532 nm corresponds to the highest uncertainty in FT532 nmretrievals; it results from the slow laser response time to modulation and the low sensitivity of the transmittance photodiode detector at this wavelength, which will be addressed in a subsequent design of the retrofit optics.
To relate τa,635 nm to ATN635 nm, a MAE (EC) of 7.4 m2g−1 at 635 nm was used. The MAE was derived
from concurrentbabs, by a photoacoustic sensor at 1047 nm,
and EC, by IMPROVE_A, measurements during the Gaso-line/Diesel Split Study (Arnott et al., 2005a) and assuming anαof 1 in Eq. (1). The quadratic relationship holds for all
of the available wavelengths, as seen in Fig. 5. Light absorp-tion is enhanced by the filter since anyτa,λ<1 corresponds
to a larger ATNλ, with more amplification towards shorter
wavelengths. Theseτa,λ–ATNλrelationships would apply to
any samples, regardless of the nature of light-absorbing ma-terial (e.g., EC, BC, BrC, or mineral dust). Particle penetra-tion depth and, to a lesser degree, single-scattering albedo and the asymmetry g factor can influence theτa,λ–ATNλ
de-pendence, though for a similar sampling configuration and filter material/thickness with typical loading, the perturba-tion is expected to be small (Chen et al., 2004; Arnott et al., 2005b). Retrieval algorithms employing both R and T such as those in Petzold and Schönlinner (2004) should be developed in the future to utilize all the information available.
y = 0.1666x2+ 0.0528x
R² = 0.9975
y = 0.1475x2+ 0.0479x
R² = 0.9995
y = 0.1443x2+ 0.0546x
R² = 0.9997
y = 0.1261x2+ 0.0555x
R² = 0.9978
y = 0.1045x2+ 0.0456x
R² = 0.9996
y = 0.1007x2+ 0.0447x
R² = 0.9995 0
0.2 0.4 0.6 0.8 1
0 1 2 3 4
τa,λ
ATNλ
980
808
780
635
455
405 450
Figure 5.τa,λ–ATNλ relationships for 405–980 nm wavelengths,
based on a diesel exhaust reference sample. Results for 532 nm are not shown owing to lack of sufficient detector signal-to-noise ratio at this wavelength.
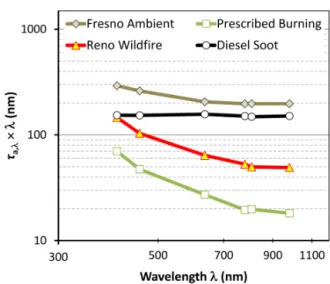
Figure 6.Product of absorption optical depth (τa,λ)and wavelength (λ)as a function ofλby sample type.τa,λshown represents aver-ages over each of the sample types.
Using the relationships in Fig. 5,τa,λ was calculated for
all samples from the initially measured ATNλ values, with
the average τa,λ×λ by sample type compared in Fig. 6.
The nearly constantτa,λ×λfor diesel exhaust samples, i.e.,
τa,λ∝λ−1, is consistent with the exclusive contribution of
EC to light absorption. BC derived from theτa,λ would be
equivalent to diesel EC. Averagedτa,λ×λincreases by
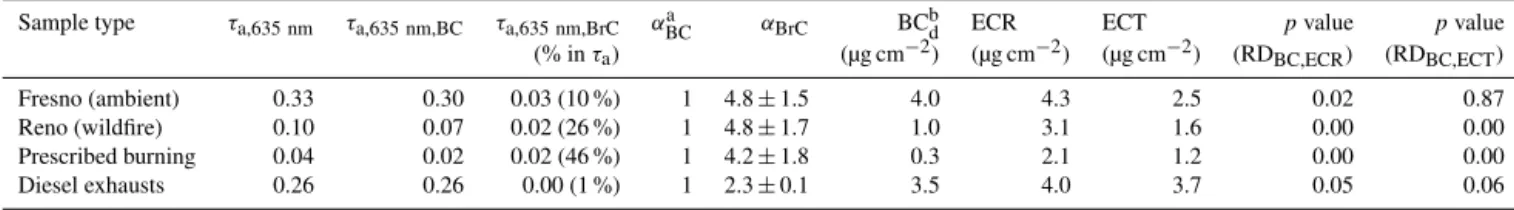
Table 3.Averageτa,635 nmfor four sample types and their respective BC and BrC fractions, BrC absorption Ångström exponent, and diesel-EC-equivalent BC (BCd)concentration. IMPROVE_A ECR and ECT determined by the 635 nm optical adjustment are compared to BCdin terms of average andpvalue of the relative difference (RD).
Sample type τa,635 nm τa,635 nm,BC τa,635 nm,BrC αaBC αBrC BCbd ECR ECT pvalue pvalue
(% inτa) (µg cm−2) (µg cm−2) (µg cm−2) (RDBC,ECR) (RDBC,ECT)
Fresno (ambient) 0.33 0.30 0.03 (10 %) 1 4.8±1.5 4.0 4.3 2.5 0.02 0.87
Reno (wildfire) 0.10 0.07 0.02 (26 %) 1 4.8±1.7 1.0 3.1 1.6 0.00 0.00
Prescribed burning 0.04 0.02 0.02 (46 %) 1 4.2±1.8 0.3 2.1 1.2 0.00 0.00
Diesel exhausts 0.26 0.26 0.00 (1 %) 1 2.3±0.1 3.5 4.0 3.7 0.05 0.06
aPre-assumed values.bCalculated fromτ
a,635 nm,BC/(7.4 m2g−1).
5 Separation of BC and BrC contributions
A simplified two-component model consisting of BC and BrC, each with explicit absorption Ångström exponents (αBC andαBrC), is used to explain the spectral dependence ofτa,λ
in the samples:
λa,λ=qBC×λ−αBC+qBrC×λ−αBrC, (7)
whereqBCandqBrCare fitting coefficients. This is analogous to the approach of Sandradewi et al. (2008), who considered the two components to be traffic and wood-burning particles and Hadley et al. (2008), who modeled two components of BC and char. Assuming anαBCof 1 the same as diesel EC, then
τa,λ×λ=qBC+qBrC×λ−(αBrC−1). (8)
Fitting coefficients in Eq. (8) were obtained forαBrC val-ues between 2 and 8 by least-square linear regression, and theαBrCthat led to the overall best fit in terms ofr2was
se-lected as the effective absorption Ångström exponent of BrC with which τa,λ,BC andτa,λ,BrC can be calculated from the
first and second terms of Eq. (7). This fitting takes advantage of all six wavelengths. For each of the 44 samples, Fig. S4 shows that fittedτa,λ are within±5 % of the measured
val-ues forτa,λ>0.01. Examples of theτa,λdecomposition as a
function of wavelength are shown in Fig. S5.
Table 3 summarizes the apportionment of τa,635 nm into BC and BrC fractions along with averageαBrC, “diesel-EC-equivalent” BC (termed BCd hereafter), ECR, and ECT by sample type. Consistent with Fig. 5, BrC contributions to
τa,635 nmare much higher in prescribed burning than in diesel exhaust samples (averaging 46 % versus 1 %) while some-where in between (10–26 %) for Fresno and Reno wildfire samples. EffectiveαBrCcompares well among Fresno, Reno wildfire, and prescribed-burning samples (4.2–4.8) and is consistent with BrC of a similar nature from biomass burn-ing (Bahadur et al., 2012; Kirchstetter and Thatcher, 2012). Even in the infrared region BrC accounts for 3, 6, and 24 % of
τa,980 nmfor the Fresno, Reno, and prescribed-burning sam-ples, respectively, on average. αBrC in diesel exhaust, de-tectable in 5 of 11 samples, appears to be significantly lower (2.3±0.1) than in other sample types.
Table 3 shows that BCd as determined from
τa,635 nm,BC/MAE635 nm (7.4 m2g−1) are lower than
ECR635 nm. The differences are especially significant (i.e., p value of RD<0.01) for Reno wildfire and Tahoe
prescribed-burning samples with relatively high BrC con-tributions. The comparisons do not change with ECR808 nm (with low BrC influence) replacing ECR635 nm. A continuum of light-absorbing carbon from biomass burning – ranging from BrC and char to soot – as suggested by Pöschl (2003) and Masiello (2004) may explain the phenomenon. As char and soot resulting from pyrolysis and high-temperature graphitization, respectively, are both quantified as EC by TOA (Han et al., 2009), they may have distinct optical properties. BCdthat was calibrated against diesel EC would represent just the soot fraction because there is little char material in diesel exhaust. ECT635 nmis substantially lower than ECR635 nmdue to the aforementioned POC effect and is much closer to BCdfor the Reno and Tahoe biomass burning samples but not the Fresno and diesel exhaust samples.
6 Conclusions
Thermal/optical analysis that combines thermal separation and optical monitoring is potentially a powerful tool for ana-lyzing carbonaceous aerosol on filters. Spatiotemporal varia-tions and long-term trends in aerosol loading, chemical com-position, sources, and effects have been inferred from OC and EC measurements (e.g., Chen et al., 2012; Hand et al., 2012; Malm et al., 1994; Murphy et al., 2011; Park et al., 2006). As many archived samples may be retrieved for re-analysis and∼40 000 new samples are collected per year in the US long-term networks alone, an enhanced multi-wavelength thermal/optical analyzer would benefit the sci-entific community that uses the data.
The seven-wavelength (visible to near-infrared regions) TSA with both R and T sensors allows the determination of the OC–EC split at different wavelengths and light ab-sorption measurements to be made with wavelength-specific loading corrections. In the selected ambient and source PM2.5 samples, contributions of BC and BrC to light
exponent of unity for BC and much higher values for BrC. Thus, BC concentrations optically equivalent to diesel ex-haust EC, i.e., BCd, can be calculated. BrC with an average absorption Ångström exponent of 4.2–4.8 is found to be en-riched in samples influenced by biomass burning.
Despite the modifications in light source and detection technique, it is shown that the TSA measures OC635 nmand EC635 nmequivalent to OC633 nmand EC633 nmfrom conven-tional TOA following the same IMPROVE_A protocol with either R or T pyrolysis adjustment. ECR635 nm is also con-sistent with those determined with longer wavelengths (e.g., 808 nm), though OC–EC splits with shorter wavelengths (e.g., 450 nm) increase ECR appreciably, showing the ef-fect of BrC. For ECT, the BrC efef-fect is somewhat canceled by an opposite POC effect. The optically derived BCd un-derestimates ECR635 nm or ECR808 nm in biomass-burning-dominated samples with relatively high BrC content though the agreements are good for other samples. This discrepancy calls for further studies on the optical properties of EC, in-cluding soot and char, from biomass burning in contrast to those of diesel soot particles.
The Supplement related to this article is available online at doi:10.5194/amt-8-451-2015-supplement.
Acknowledgements. This work was supported, in part, by the
US National Science Foundation (CHE 1214163), National Park Service IMPROVE Carbon Analysis Contract (C2350000894), and Chen’s sabbatical leave at the University of Rostock. The authors thank Steve Kohl, Dana Trimble, and Gustavo Riggio at DRI for collection and carbon analysis of the samples and Megan Johnson for conducting the Lambda 35 spectral analysis. The conclusions are those of the authors and do not necessarily reflect the views of the sponsoring agencies.
Edited by: W. Maenhaut
References
Ahmed, T., Dutkiewicz, V. A., Shareef, A., Tuncel, G., Tuncel, S., and Husain, L.: Measurement of black carbon (BC) by an optical method and a thermal-optical method: Intercomparison for four sites, Atmos. Environ., 43, 6305–6311, 2009.
Andreae, M. O. and Gelencsér, A.: Black carbon or brown car-bon? The nature of light-absorbing carbonaceous aerosols, At-mos. Chem. Phys., 6, 3131–3148, doi:10.5194/acp-6-3131-2006, 2006.
Arnott, W. P., Fujita, E. M., Walker, J., Campbell, D. E., Zielinska, B., Sagebiel, J. C., Moosmüller, H., Chow, J. C., and Lawson, D. R.: Photoacoustic Measurement of Black Carbon Emission Rates by Gasoline and Diesel Powered Vehicles and the Relationship with Carbon Analysis by Thermal Methods, in: Gasoline/Diesel
PM Split Study: Source and Ambient Sampling, Chemical Anal-ysis, and Apportionment Phase, prepared by Desert Research In-stitute, Reno, NV, Prepared for DOE National Renewable Energy Laboratory, 2–39, 2005a.
Arnott, W. P., Hamasha, K., Moosmüller, H., Sheridan, P. J., and Ogren, J. A.: Towards aerosol light-absorption measurements with a 7-wavelength Aethalometer: Evaluation with a photoa-coustic instrument and 3-wavelength nephelometer, Aerosol Sci. Technol., 39, 17–29, 2005b.
Bahadur, R., Praveen, P. S., Xu, Y. Y., and Ramanathan, V.: So-lar absorption by elemental and brown carbon determined from spectral observations, Proc. Natl. Acad. Sci. USA, 109, 17366– 17371, 2012.
Birch, M. E. and Cary, R. A.: Elemental carbon-based method for occupational monitoring of particulate diesel exhaust: Methodol-ogy and exposure issues, Analyst, 121, 1183–1190, 1996. Bond, T. C., Anderson, T. L., and Campbell, D. E.: Calibration and
intercomparison of filter-based measurements of visible light ab-sorption by aerosols, Aerosol Sci. Technol., 30, 582–600, 1999. Bougiatioti, A., Zarmpas, P., Koulouri, E., Antoniou, M., Theodosi,
C., Kouvarakis, G., Saarikoski, S., Makela, T., Hillamo, R., and Mihalopoulos, N., Organic, elemental and water-soluble organic carbon in size segregated aerosols, in the marine boundary layer of the Eastern Mediterranean, Atmos. Environ., 64, 251–262, 2013.
Cao, J. J., Lee, S. C., Chow, J. C., Watson, J. G., Ho, K. F., Zhang, R. J., Jin, Z. D., Shen, Z. X., Chen, G. C., Kang, Y. M., Zou, S. C., Zhang, L. Z., Qi, S. H., Dai, M. H., Cheng, Y., and Hu, K.: Spatial and seasonal distributions of carbonaceous aerosols over China, J. Geophys Res.-Atmos., 112, 1–9, 2007.
Cavalli, F., Viana, M., Yttri, K. E., Genberg, J., and Putaud, J.-P.: Toward a standardised thermal-optical protocol for measuring atmospheric organic and elemental carbon: the EUSAAR proto-col, Atmos. Meas. Tech., 3, 79–89, doi:10.5194/amt-3-79-2010, 2010.
Chen, L.-W. A., Chow, J. C., Watson, J. G., Moosmüller, H., and Arnott, W. P.: Modeling reflectance and transmittance of quartz-fiber filter samples containing elemental carbon particles: Impli-cations for thermal/optical analysis, J. Aerosol Sci., 35, 765–780, 2004.
Chen, L.-W. A., Watson, J. G., Chow, J. C., and Magliano, K. L.: Quantifying PM2.5source contributions for the San Joaquin Val-ley with multivariate receptor models, Environ. Sci. Technol., 41, 2818–2826, 2007.
Chen, L.-W. A., Chow, J. C., Watson, J. G., and Schichtel, B. A.: Consistency of long-term elemental carbon trends from ther-mal and optical measurements in the IMPROVE network, At-mos. Meas. Tech., 5, 2329–2338, doi:10.5194/amt-5-2329-2012, 2012.
Chen, L.-W. A., Han, Y. M., Chow, J. C., Watson, J. G., and Cao, J. J.: Black carbon in dust and geological material: Optical analysis and implication of urban influence, J. Aerosol Sci., submitted, 2015.
Chow, J. C., Watson, J. G., Crow, D., Lowenthal, D. H., and Merri-field, T. M.: Comparison of IMPROVE and NIOSH carbon mea-surements, Aerosol Sci. Technol., 34, 23–34, 2001.
Chow, J. C., Watson, J. G., Chen, L.-W. A., Arnott, W. P., Moos-müller, H., and Fung, K. K.: Equivalence of elemental carbon by Thermal/Optical Reflectance and Transmittance with different temperature protocols, Environ. Sci. Technol., 38, 4414–4422, 2004.
Chow, J. C., Watson, J. G., Chen, L.-W. A., Chang, M.-C. O., Robin-son, N. F., Trimble, D. L., and Kohl, S. D.: The IMPROVE_A temperature protocol for thermal/optical carbon analysis: Main-taining consistency with a long-term database, J. Air Waste Man-age. Assoc., 57, 1014–1023, 2007a.
Chow, J. C., Watson, J. G., Lowenthal, D. H., Chen, L.-W. A., Zielinska, B., Mazzoleni, L. R., and Magliano, K. L.: Evaluation of organic markers for chemical mass balance source apportion-ment at the Fresno supersite, Atmos. Chem. Phys., 7, 1741–1754, 2007b,
http://www.atmos-chem-phys.net/7/1741/2007/.
Chow, J. C., Watson, J. G., Doraiswamy, P., Chen, L.-W. A., Sode-man, D. A., Lowenthal, D. H., Park, K., Arnott, W. P., and Mo-tallebi, N.: Aerosol light absorption, black carbon, and elemental carbon at the Fresno Supersite, California, Atmos. Res., 93, 874– 887, 2009.
Chow, J. C., Watson, J. G., Chen, L.-W. A., Rice, J., and Frank, N. H.: Quantification of PM2.5 organic carbon sampling arti-facts in US networks, Atmos. Chem. Phys., 10, 5223–5239, doi:10.5194/acp-10-5223-2010, 2010.
Chow, J. C., Watson, J. G., Robles, J., Wang, X. L., Chen, L.-W. A., Trimble, D. L., Kohl, S. D., Tropp, R. J., and Fung, K. K.: Qual-ity assurance and qualQual-ity control for thermal/optical analysis of aerosol samples for organic and elemental carbon, Anal. Bioanal. Chem., 401, 3141–3152, 2011.
Clarke, A., McNaughton, C., Kapustin, V., Shinozuka, Y., Howell, S., Dibb, J., Zhou, J., Anderson, B., Brekhovskikh, V., Turner, H., and Pinkerton, M.: Biomass burning and pollution aerosol over North America: Organic components and their influence on spec-tral optical properties and humidification response, J. Geophys. Res.-Atmos., 112, D12S18, doi:10.1029/2006JD007777, 2007. Dabek-Zlotorzynska, E., Dann, T. F., Martinelango, P. K., Celo, V.,
Brook, J. R., Mathieu, D., Ding, L. Y., and Austin, C. C.: Cana-dian National Air Pollution Surveillance (NAPS) PM2.5 speci-ation program: Methodology and PM2.5chemical composition for the years 2003–2008, Atmos. Environ., 45, 673–686, 2011. Favez, O., Cachier, H., Sciare, J., Sarda-Esteve, R., and
Marti-non, L.: Evidence for a significant contribution of wood burn-ing aerosols to PM2.5during the winter season in Paris, France, Atmos. Environ., 43, 3640–3644, 2009.
Fujita, E. M., Zielinska, B., Campbell, D. E., Arnott, W. P., Sage-biel, J. C., Mazzoleni, L. R., Chow, J. C., Gabele, P. A., Crews, W., Snow, R., Clark, N. N., Wayne, W. S., and Lawson, D. R.: Variations in speciated emissions from spark-ignition and compression-ignition motor vehicles in California’s south coast air basin, J. Air Waste Manage. Assoc., 57, 705–720, 2007. Gorin, C. A., Collett Jr., J. L., and Herckes, P.: Wood smoke
con-tribution to winter aerosol in Fresno, CA, J. Air Waste Manage. Assoc., 56, 1584–1590, 2006.
Hadley, O. L., Corrigan, C. E., and Kirchstetter, T. W.: Modified thermal-optical analysis using spectral absorption selectivity to
distinguish black carbon from pyrolized organic carbon, Environ. Sci. Technol., 42, 8459–8464, 2008.
Han, Y. M., Lee, S. C., Cao, J. J., Ho, K. F., and An, Z. S.: Spatial distribution and seasonal variation of char-EC and soot-EC in the atmosphere over China, Atmos. Environ., 43, 6066–6073, 2009. Han, Y. M., Chen, L.-W. A., Cao, J. J., Fung, K. K., Ho, K. F., Yan, B. Z., Zhan, C. L., Liu, S. X., Wei, C., and An, Z. H.: Ther-mal/optical methods for elemental carbon quantification in soils and urban dusts: Equivalence of different analysis protocols, Plos One, 8, e83462, doi:10.1371/journal.pone.0083462, 2013. Hand, J. L., Schichtel, B. A., Pitchford, M. L., Malm, W. C., and
Frank, N. H.: Seasonal composition of remote and urban fine particulate matter in the United States, J. Geophys Res.-Atmos., 117, D05209, doi:10.1029/2011JD017122, 2012.
Hansen, A. D. A., Rosen, H., and Novakov, T.: The aethalometer – An instrument for the real-time measurement of optical absorp-tion by aerosol particles, Sci. Total Environ., 36, 191–196, 1984. Huntzicker, J. J., Johnson, R. L., Shah, J. J., and Cary, R. A.: Anal-ysis of organic and elemental carbon in ambient aerosols by a thermal-optical method, in: Particulate Carbon: Atmospheric Life Cycle, edited by: Wolff, G. T. and Klimisch, R. L., Plenum, New York, NY, USA, 79–88, 1982.
IMPROVE: Interagency Monitoring of Protected Visual Environ-ments, prepared by National Park Service, Ft. Collins, CO, available at: http://vista.cira.colostate.edu/IMPROVE (last ac-cess: 16 January 2015), 2014.
Khan, B., Hays, M. D., Geron, C., and Jetter, J.: Differences in the OC/EC ratios that characterize ambient and source aerosols due to thermal-optical analysis, Aerosol Sci. Technol., 46, 127–137, 2012.
Kirchstetter, T. W. and Thatcher, T. L.: Contribution of organic car-bon to wood smoke particulate matter absorption of solar radia-tion, Atmos. Chem. Phys., 12, 6067–6072, doi:10.5194/acp-12-6067-2012, 2012.
Lack, D. A., Moosmüller, H., McMeeking, G. R., Chakrabarty, R. K., and Baumgardner, D.: Characterizing elemental, equivalent black, and refractory black carbon aerosol particles: a review of techniques, their limitations and uncertainties, Anal. Bioanal. Chem., 406, 99–122, 2014.
Malamakal, T., Chen, L.-W. A., Wang, X. L., Green, M. C., Gron-stal, S., Chow, J. C., and Watson, J. G.: Prescribed burn smoke impact in the Lake Tahoe Basin: model simulation and field ver-ification, Int. J. Environ. Poll., 52, 225–243, 2013.
Malm, W. C., Sisler, J. F., Huffman, D., Eldred, R. A., and Cahill, T. A.: Spatial and seasonal trends in particle concentration and op-tical extinction in the United States, J. Geophys. Res., 99, 1347– 1370, 1994.
Masiello, C. A.: New directions in black carbon organic geochem-istry, Mar. Chem., 92, 201–213, 2004.
Moosmüller, H., Chakrabarty, R. K., and Arnott, W. P.: Aerosol light absorption and its measurement: A review, J. Quant. Spectrosc. Radiat. Transfer, 110, 844–878, 2009.
Murphy, D. M., Chow, J. C., Leibensperger, E. M., Malm, W. C., Pitchford, M., Schichtel, B. A., Watson, J. G., and White, W. H.: Decreases in elemental carbon and fine particle mass in the United States, Atmos. Chem. Phys., 11, 4679–4686, doi:10.5194/acp-11-4679-2011, 2011.
National Institute of Occupational Safety and Health, Cincinnati, OH, USA, 1999.
Park, R. J., Jacob, D. J., Kumar, N., and Yantosca, R. M.: Regional visibility statistics in the United States: Natural and transbound-ary pollution influences, and implications for the Regional Haze Rule, Atmos. Environ., 40, 5405–5423, 2006.
Peterson, M. R. and Richards, M. H.: Thermal-optical-transmittance analysis for organic, elemental, carbonate, total carbon, and OCX2 in PM2.5 by the EPA/NIOSH method, in: Proceedings, Symposium on Air Quality Measurement Methods and Technology-2002, edited by: Winegar, E. D. and Tropp, R. J., 83-1-83-19, Air & Waste Management Association, Pittsburgh, PA, USA, 2002.
Petzold, A. and Schönlinner, M.: Multi-angle absorption photome-try – A new method for the measurement of aerosol light absorp-tion and atmospheric black carbon, J. Aerosol Sci., 35, 421–441, 2004.
Petzold, A., Ogren, J. A., Fiebig, M., Laj, P., Li, S.-M., Bal-tensperger, U., Holzer-Popp, T., Kinne, S., Pappalardo, G., Sug-imoto, N., Wehrli, C., Wiedensohler, A., and Zhang, X.-Y.: Rec-ommendations for reporting “black carbon” measurements, At-mos. Chem. Phys., 13, 8365–8379, doi:10.5194/acp-13-8365-2013, 2013.
Pöschl, U.: Aerosol particle analysis: Challenges and progress, Anal. Bioanal. Chem., 375, 30–32, 2003.
Quincey, P. G., Butterfield, D., Green, D., Coyle, M., and Cape, C. N.: An evaluation of measurement methods for organic, ele-mental and black carbon in ambient air monitoring sites, Atmos. Environ., 43, 5085–5091, 2009.
Reisinger, P., Wonaschutz, A., Hitzenberger, R., Petzold, A., Bauer, H., Jankowski, N., Puxbaum, H., Chi, X., and Maenhaut, W.: In-tercomparison of measurement techniques for black or elemental carbon under urban background conditions in wintertime: Influ-ence of biomass combustion, Environ. Sci. Technol., 42, 884– 889, 2008.
Sandradewi, J., Prevot, A. S. H., Szidat, S., Perron, N., Alfarra, M. R., Lanz, V. A., Weingartner, E., and Baltensperger, U.: Using aerosol light absorption measurements for the quantitative deter-mination of wood burning and traffic emission contributions to particulate matter, Environ. Sci. Technol., 42, 3316–3323, 2008. Schauer, J. J. and Cass, G. R.: Source apportionment of wintertime gas-phase and particle-phase air pollutants using organic com-pounds as tracers, Environ. Sci. Technol., 34, 1821–1832, 2000. Schauer, J. J., Mader, B. T., Deminter, J. T., Heidemann, G., Bae, M. S., Seinfeld, J. H., Flagan, R. C., Cary, R. A., Smith, D., Huebert, B. J., Bertram, T., Howell, S., Kline, J. T., Quinn, P., Bates, T., Turpin, B. J., Lim, H. J., Yu, J. Z., Yang, H., and Keywood, M. D.: ACE-Asia intercomparison of a thermal-optical method for the determination of particle-phase organic and elemental car-bon, Environ. Sci. Technol., 37, 993–1001, 2003.
Schmid, H. P., Laskus, L., Abraham, H. J., Baltensperger, U., La-vanchy, V. M. H., Bizjak, M., Burba, P., Cachier, H., Crow, D., Chow, J. C., Gnauk, T., Even, A., ten Brink, H. M., Giesen, K. P., Hitzenberger, R., Hueglin, C., Maenhaut, W., Pio, C. A., Puttock, J., Putaud, J. P., Toom-Sauntry, D., and Puxbaum, H.: Results of the “Carbon Conference” international aerosol carbon round robin test: Stage 1, Atmos. Environ., 35, 2111–2121, 2001.
Snyder, D. C. and Schauer, J. J.: An inter-comparison of two black carbon aerosol instruments and a semi-continuous elemental car-bon instrument in the urban environment, Aerosol Sci. Technol., 41, 463–474, 2007.
Subramanian, R., Khlystov, A. Y., and Robinson, A. L.: Effect of peak inert-mode temperature on elemental carbon measured us-ing thermal-optical analysis, Aerosol Sci. Technol., 40, 763–780, 2006.
Turpin, B. J., Cary, R. A., and Huntzicker, J. J.: An in-situ, time-resolved analyzer for aerosol organic and elemental carbon, Aerosol Sci. Technol., 12, 161–171, 1990.
U.S.EPA: Chemical speciation, prepared by U.S. Environmental Protection Agency, Research Triangle Park, NC, 2014.
Virkkula, A., Ahlquist, N. C., Covert, D. S., Arnott, W. P., Sheridan, P. J., Quinn, P. K., and Coffman, D. J.: Modification, calibration and a field test of an instrument for measuring light absorption by particles, Aerosol Sci. Technol., 39, 68–83, 2005.
Watson, J. G., Chow, J. C., Bowen, J. L., Lowenthal, D. H., Her-ing, S. V., Ouchida, P., and Oslund, W.: Air quality measure-ments from the Fresno Supersite, J. Air Waste Manage. Assoc., 50, 1321–1334, 2000.
Watson, J. G., Chow, J. C., and Chen, L.-W. A.: Summary of or-ganic and elemental carbon/black carbon analysis methods and intercomparisons, Aerosol Air Quality Res., 5, 65–102, 2005. Watson, J. G., Chow, J. C., Chen, L.-W. A., and Frank, N. H.:
Methods to assess carbonaceous aerosol sampling artifacts for IMPROVE and other long-term networks, J. Air Waste Manage. Assoc., 59, 898–911, 2009.
Yang, H. and Yu, J. Z.: Uncertainties in charring correction in the analysis of elemental and organic carbon in atmospheric particles by thermal/optical methods, Environ. Sci. Technol., 36, 5199– 5204, 2002.
Yang, M., Howell, S. G., Zhuang, J., and Huebert, B. J.: Attri-bution of aerosol light absorption to black carbon, brown car-bon, and dust in China – interpretations of atmospheric measure-ments during EAST-AIRE, Atmos. Chem. Phys., 9, 2035–2050, doi:10.5194/acp-9-2035-2009, 2009.
Zhang, X. L., Lin, Y. H., Surratt, J. D., Zotter, P., Prevot, A. S. H., and Weber, R. J.: Light-absorbing soluble organic aerosol in Los Angeles and Atlanta: A contrast in secondary organic aerosol, Geophys. Res. Lett., 38, L21810, doi:10.1029/2011GL049385, 2011.
Zhang, X. Y., Wang, Y. Q., Niu, T., Zhang, X. C., Gong, S. L., Zhang, Y. M., and Sun, J. Y.: Atmospheric aerosol com-positions in China: spatial/temporal variability, chemical sig-nature, regional haze distribution and comparisons with global aerosols, Atmos. Chem. Phys., 12, 779–799, doi:10.5194/acp-12-779-2012, 2012.