ACPD
11, 25473–25516, 2011Optical-microphysical properties of Saharan
dust aerosols
A. Papayannis et al.
Title Page
Abstract Introduction
Conclusions References
Tables Figures
◭ ◮
◭ ◮
Back Close
Full Screen / Esc
Printer-friendly Version Interactive Discussion
Discussion
P
a
per
|
Dis
cussion
P
a
per
|
Discussion
P
a
per
|
Discussio
n
P
a
per
Atmos. Chem. Phys. Discuss., 11, 25473–25516, 2011 www.atmos-chem-phys-discuss.net/11/25473/2011/ doi:10.5194/acpd-11-25473-2011
© Author(s) 2011. CC Attribution 3.0 License.
Atmospheric Chemistry and Physics Discussions
This discussion paper is/has been under review for the journal Atmospheric Chemistry and Physics (ACP). Please refer to the corresponding final paper in ACP if available.
Optical-microphysical properties of
Saharan dust aerosols and composition
relationship using a multi-wavelength
Raman lidar, in situ sensors and
modelling: a case study analysis
A. Papayannis1, R. E. Mamouri1, V. Amiridis2, E. Remoundaki3, G. Tsaknakis1, P. Kokkalis1, I. Veselovskii4, A. Kolgotin4, A. Nenes5,6, and C. Fountoukis6 1
National Technical University of Athens, Laser Remote Sensing Laboratory, Zografou, Greece
2
National Observatory of Athens, Institute for Space Applications and Remote Sensing, Athens, Greece
3
National Technical University of Athens, School of Mining and Metallurgical Engineering, Zografou, Greece
4
Physics Instrumentation Center for General Physics, Troitsk, 142190 Moscow, Russia
5
Georgia Inst. of Tech., School of Earth and Atmos. Sc. and Chem. & Biomolecular Engineering, Atlanta GA, USA
6
ACPD
11, 25473–25516, 2011Optical-microphysical properties of Saharan
dust aerosols
A. Papayannis et al.
Title Page
Abstract Introduction
Conclusions References
Tables Figures
◭ ◮
◭ ◮
Back Close
Full Screen / Esc
Printer-friendly Version Interactive Discussion
Discussion
P
a
per
|
Dis
cussion
P
a
per
|
Discussion
P
a
per
|
Discussio
n
P
a
per
|
Received: 11 July 2011 – Accepted: 2 September 2011 – Published: 12 September 2011
Correspondence to: A. Papayannis ([email protected])
ACPD
11, 25473–25516, 2011Optical-microphysical properties of Saharan
dust aerosols
A. Papayannis et al.
Title Page
Abstract Introduction
Conclusions References
Tables Figures
◭ ◮
◭ ◮
Back Close
Full Screen / Esc
Printer-friendly Version Interactive Discussion
Discussion
P
a
per
|
Dis
cussion
P
a
per
|
Discussion
P
a
per
|
Discussio
n
P
a
per
Abstract
A strong Saharan dust event occurred over the city of Athens, Greece (37.9◦
N, 23.6◦
E) between 27 March and 3 April 2009. The BSC-DREAM8b model was used to forecast the dust event and to provide the vertical profiles of the aerosol concentration. Due to mixture of dust particles with low clouds during most of the reported period, the
5
dust event could be followed by the National Technical University of Athens (NTUA) 6-wavelength Raman lidar system only during the unclouded day of 2 April 2009. The lidar data obtained were used to retrieve the vertical profile of the optical (extinction
and backscatter coefficients) properties of aerosols in the troposphere. Additionally, a
retrieval technique representing dust as a mixture of spheres and spheroids was used
10
to derive the mean aerosol dust microphysical properties (mean and effective radius,
number, surface and volume density, and mean refractive index) in different layers
be-tween 1.8 and 3.5 km a.s.l. The final data set of the aerosol optical and microphysical properties along with the water vapor profiles obtained by Raman lidar were incorpo-rated into the ISORROPIA II model to infer an in situ aerosol composition consistent
15
with the retrieved refractive index values. PM10 concentrations levels, PM10
compo-sition results and SEM-EDX (Scanning Electron Microscope-Energy Dispersive X-ray) analysis results on sizes and mineralogy of particles from samples during the Saharan dust transport event were used to evaluate the retrieval.
1 Introduction
20
Atmospheric aerosols have a large impact on the planetary radiation budget, and are
thought to exert a net cooling effect on climate (Andreae, 1995; Ramanathan et al.,
2001; Heinold et al., 2007; Levin and Cotton, 2009; Ramanathan and Feng, 2009;
Lohmann et al., 2010). The cooling effect associated with anthropogenic aerosol is
thought to partially mitigate greenhouse gas warming, but estimates are highly
un-25
ACPD
11, 25473–25516, 2011Optical-microphysical properties of Saharan
dust aerosols
A. Papayannis et al.
Title Page
Abstract Introduction
Conclusions References
Tables Figures
◭ ◮
◭ ◮
Back Close
Full Screen / Esc
Printer-friendly Version Interactive Discussion
Discussion
P
a
per
|
Dis
cussion
P
a
per
|
Discussion
P
a
per
|
Discussio
n
P
a
per
|
interaction with atmospheric constituents, radiation and clouds (Forster et al., 2007). Mineral dust is an important component of the atmospheric aerosol loading, as it ac-counts for about 75 % of the global aerosol mass load and 25 % of the global aerosol optical depth (Kinne et al., 2006), as well as a key player in earth’s radiative transfer
budget (Mahowald et al., 2006) affecting precipitation (Yoshioka et al., 2007).
North-5
ern Africa (Sahara desert and Sahel), Saudi Arabia, and Eastern Asia (Taklemakan and Gobi deserts) are the main source regions of dust around the globe (Marticorena et al., 1997; Laurent et al., 2008). According to simulations by Laurent et al. (2008), the largest dust emissions originate from the Sahara (which for 1996 to 2001 range
between 585 and 759 Tg yr−1) exhibit marked seasonal cycles (with a maximum in
10
summer for the Western Sahara and in spring for the eastern Sahara) and pronounced interannual variability. This implies a highly complex and uncertain radiative forcing pattern, which is exacerbated by variability in dust optical properties from atmospheric processing and fluctuations in dust mineralogy (e.g. clay content, Helmert et al., 2007). Dust impacts on regional climate, precipitation (Min et al., 2009), public health
(Annesi-15
Maesano et al., 2007) and transportation (Satheesh et al., 2005; Heinold et al., 2007) can be even more important. For example, Ganor et al. (2010) reported on an increas-ing trend of dust days over Israel (average rate of 2.7 days per decade), with important climatic implications for the Mediterranean and Europe in general.
Lidar aerosol measurements of dust optical properties and atmospheric vertical
dis-20
tribution can provide much of the information required to constrain models and reduce uncertainties associated with radiative forcing estimates. Towards this, the European Aerosol Research Lidar Network (EARLINET; http://www.earlinet.org) since 2000 pro-vides the first systematic aerosol lidar observations of Saharan dust aerosols over the European continent, on a coherent network basis (Ansmann et al., 2003;
Papayan-25
ACPD
11, 25473–25516, 2011Optical-microphysical properties of Saharan
dust aerosols
A. Papayannis et al.
Title Page
Abstract Introduction
Conclusions References
Tables Figures
◭ ◮
◭ ◮
Back Close
Full Screen / Esc
Printer-friendly Version Interactive Discussion
Discussion
P
a
per
|
Dis
cussion
P
a
per
|
Discussion
P
a
per
|
Discussio
n
P
a
per
al., 2003; Balis et al., 2004; Papayannis et al., 2008; Santese et al., 2008; Tesche et al., 2009), geometrical (Mattis et al., 2008), hygroscopic (Feingold and Morley, 2003) and microphysical (M ¨uller et al., 1999, 2005; Pahlow et al., 2006; M ¨uller et al., 2009b, 2010) properties, as well as to measure cloud condensation nuclei (CCN) (Feingold et al., 1998; Ghan and Collins, 2004) in the atmosphere, and also from space (e.g.
5
Berthier et al., 2006; Mamouri et al., 2009; Liu et al., 2011).
This study focuses on the optical, microphysical and composition of aged dust aerosol particles associated with a strong Saharan dust event as they interact with an-thropogenic particles in the lower free troposphere over an urban site (Athens, Greece). In the following sections we first present the dust forecasting model, instrumentation
10
and methodology used for retrieving the aerosol properties (Sect. 2). An analysis of the dust event then follows (Sect. 3) with an emphasis on the days with optimal lidar retrievals. We then conclude (Sect. 4) with final remarks and a summary.
2 Methodology
2.1 The NTUA 6-wavelength Raman lidar system
15
The National Technical University of Athens (NTUA) lidar system is located on
Cam-pus in the city of Athens (37.97◦N, 23.79◦E, 200 m above sea level-a.s.l.), and has
been continuously operating since the initiation of the EARLINET project (B ¨osenberg et al., 2003) in February 2000. The compact 6-wavelength NTUA Raman lidar system (Mamouri et al., 2008) is based on a pulsed Nd:YAG laser emitting simultaneously at
20
355, 532 and 1064 nm. The lidar signals are detected at six wavelengths 355, 387, 407, 532, 607 and 1064 nm. The system has been quality-assured by performing di-rect inter-comparisons, both at hardware (Matthias et al., 2004a) and software levels (B ¨ockmann et al., 2004; Pappalardo et al., 2004).
To obtain reliable and quantitative lidar aerosol retrievals, several techniques and
25
ACPD
11, 25473–25516, 2011Optical-microphysical properties of Saharan
dust aerosols
A. Papayannis et al.
Title Page
Abstract Introduction
Conclusions References
Tables Figures
◭ ◮
◭ ◮
Back Close
Full Screen / Esc
Printer-friendly Version Interactive Discussion
Discussion
P
a
per
|
Dis
cussion
P
a
per
|
Discussion
P
a
per
|
Discussio
n
P
a
per
|
to retrieve aerosol parameters mostly for small aerosol optical depths (AOD<0.2–0.3
in the visible), assuming a reference height in an aerosol-free area (e.g. the upper tro-posphere). Under such conditions, the Klett inversion technique (Klett, 1985) is used
to retrieve the vertical profile of the aerosol backscatter coefficient (baer) at the
respec-tive wavelengths. The resulting average uncertainty on the retrieval ofbaer (including
5
both statistical and systematic errors corresponding to a 30–60 min averaging time) in the troposphere is of the order of 20–30 % (B ¨osenberg et al., 1997). To overcome the
large uncertainty associated with this technique, the Raman N2 lidar technique was
adopted using the methodology of Ansmann et al. (1992). Since the Raman lidar sig-nals are quite weak, the Raman technique is mostly used during nighttime, when the
10
atmospheric background is quite low.
In the case of the Raman technique, the measurement of the elastic backscatter
signals at 355 and 532 nm, as well as that of the N2 inelastic-backscatter signals at
387 and 607 nm, respectively, permits the determination of the extinction (aaer) and
backscatter (baer) coefficients independently of each other (Ansmann et al., 1992) and,
15
thus, of the extinction-to-backscatter ratio, the so-called lidar ratio (LR) at both
wave-lengths (355 and 532 nm). The uncertainties associated with the retrievedbaervertical
profiles are of the order of 10–15 % (Mattis et al., 2002). The vertical profiles ofbaer
referring to measurements performed before the local sunset time (∼19:00 UT) were
retrieved by using the Klett technique, using a LR value derived for dust aerosols by
20
the Raman technique (Ansmann et al., 1992) from the same day’s nighttime lidar mea-surements.
2.2 The CIMEL sunphotometer
The sunphotometric observations reported in this paper were performed by a CIMEL sun-sky radiometer (Holben et al., 1998), which is part of the Aerosol Robotic Network
25
(AERONET) Global Network (http://aeronet.gsfc.nasa.gov). The instrument is located on the roof of the Research Center for Atmospheric Physics and Climatology of the
Academy of Athens (37.99◦
N, 23.78◦
ACPD
11, 25473–25516, 2011Optical-microphysical properties of Saharan
dust aerosols
A. Papayannis et al.
Title Page
Abstract Introduction
Conclusions References
Tables Figures
◭ ◮
◭ ◮
Back Close
Full Screen / Esc
Printer-friendly Version Interactive Discussion
Discussion
P
a
per
|
Dis
cussion
P
a
per
|
Discussion
P
a
per
|
Discussio
n
P
a
per
city center and 10 km from the sea. This sunphotometric station is operated by the Institute for Space Applications and Remote Sensing (ISARS) of the National Obser-vatory of Athens (NOA). The CIMEL data used in this study will provide information about the columnar AOD, aerosol size distribution, aerosol microphysical properties,
and ˚Angstr ¨om exponent. The AERONET data products along with the technical
speci-5
fications of the CIMEL instrument are given in detail in Holben et al. (1998).
2.3 The MODIS instrument
The Moderate Resolution Imaging Spectroradiometer (MODIS) was launched in De-cember 1999 on the polar orbiting Terra spacecraft and since February 2000 has been acquiring daily global data in 36 spectral bands from the visible to the thermal infrared
10
(29 spectral bands with 1 km, 5 spectral bands with 500 m, and 2 spectral bands with 250 m nadir pixel dimensions). The MODIS aerosol products are only created for cloud-free regions. The atmospheric optical depth (AOD) values are retrieved by MODIS at 550 nm (http://modis-atmos.gsfc.nasa.gov/products.html) for both oceans (best) and land (corrected) (Tanr ´e et al., 1997; Levy et al., 2007). The main sources of
uncer-15
tainty in the retrieval of the AOD in this case are from instrument calibration errors, cloud-masking errors, incorrect assumptions on surface reflectance and aerosol model
(fine (with radius≪1 µm) and coarse (with radius≫1 µm) mode aerosol models)
se-lection (Remer et al., 2005; Levy et al., 2010). Therefore, sese-lection of an inappro-priate aerosol model can result in systematic AOD errors. The pre-launch conditions
20
suggested that 1 standard deviation of retrievals would fall within±(0.03+0.05τ) over
ocean and±(0.05+0.15τ) over land, whereτis the AOD. These error bounds, derived
pre-launch, are referred to as the expected error (EE) (Remer et al., 2005).
To minimize the uncertainties on the MODIS AOD product several validation stud-ies have been performed, during pre-launch and post-launch procedures regarding the
25
ACPD
11, 25473–25516, 2011Optical-microphysical properties of Saharan
dust aerosols
A. Papayannis et al.
Title Page
Abstract Introduction
Conclusions References
Tables Figures
◭ ◮
◭ ◮
Back Close
Full Screen / Esc
Printer-friendly Version Interactive Discussion
Discussion
P
a
per
|
Dis
cussion
P
a
per
|
Discussion
P
a
per
|
Discussio
n
P
a
per
|
(C005) dark-target aerosol products over land, showing that that >66 % (one
stan-dard deviation) of MODIS-retrieved AOD values compared to AERONET observed
val-ues within an expected error (EE) envelope of ±(0.05+15 %), with high correlation
(R=0.9). According to the same authors, Terra’s global AOD bias changes with time,
underestimating by∼0.005, after the year 2004. However, although validated globally,
5
MODIS-retrieved AOD does not fall within the EE envelope in all regions of the planet (Levy et al., 2010).
In this study we used MODIS C005 data, which were recently evaluated and
val-idated for the Greater Mediterranean Basin (29.5◦N–46.5◦N and 10.5◦W–38.5◦E)
against 29 AERONET stations, as described by Papadimas et al. (2009), who found
10
that when comparing C005 to C004 data, the correlation coefficient increases from
0.66 to 0.76, and the slope of the linear regression fit from 0.79 to 0.85 whereas
the offset decreased from 0.12 to 0.04 and the scatter of compared data pairs from
0.15 to 0.12. On the other hand, they found a significant decrease of AOD values
over land (by 25.8 %) for AODs>0.2. However, the MODIS C005 data still
overes-15
timate/underestimate the AERONET AOD values smaller/larger than 0.25, but to a much smaller extent than C004 data.
2.4 The BSC-DREAM8b dust model
The updated version of the Dust Regional Atmospheric Model (BSC-DREAM8b) (Nick-ovic et al., 2001; P ´erez et al., 2006a, b; Jim ´enez-Guerrero et al., 2008) has been
20
delivering operational dust forecasts over the North Africa-Mediterranean-Middle East and over Asia regions on the last years at the Barcelona Supercomputing Center (BSC) (currently at www.bsc.es/projects/earthscience/DREAM/). The model simulates or pre-dicts the 3-dimensional field of the dust concentration in the troposphere. The dust model takes into account all major processes of dust life cycle, such as dust
produc-25
tion, horizontal and vertical diffusion and advection and wet and dry deposition, while
the chemical aging and aerosol-cloud interactions are not taken into account. The
ACPD
11, 25473–25516, 2011Optical-microphysical properties of Saharan
dust aerosols
A. Papayannis et al.
Title Page
Abstract Introduction
Conclusions References
Tables Figures
◭ ◮
◭ ◮
Back Close
Full Screen / Esc
Printer-friendly Version Interactive Discussion
Discussion
P
a
per
|
Dis
cussion
P
a
per
|
Discussion
P
a
per
|
Discussio
n
P
a
per
The model numerically solves the Euler-type mass partial differential equation by
inte-grating it spatially and temporally. The dust production is parameterized using near sur-face turbulence and stability, as well as soil features. The dust production mechanism is based on viscous/turbulent mixing close to the surface and soil moisture content.
In BSC-DREAM8b the aerosol description is improved from 4 to 8 bins (8 particle size
5
categories with radii from 0.1 to 38 µm) and dust-radiation interactions are included (Haustein et al., 2009). For the present study, BSC-DREAM8b simulation is initial-ized with 24-hourly (at 00:00 UTC) updated NCEP (National Centers for Environmental
Prediction) 0.5◦
×0.5◦ analysis data and the initial state of the dust concentration in
the model is defined by the 24-h forecast from the previous-day model run (because
10
there are not yet satisfactory three-dimensional dust concentration observations to be
assimilated). The resolution is set to 1/3◦
(∼50 km) in the horizontal and to 24 layers
extending up to approximately 15 km in the vertical. For long-range transport dust stud-ies, only the particles with radii from 0.1 to 10 µm are considered, since their lifetime is larger than about 12 h.
15
2.5 Derivation of the aerosol microphysical and chemical properties using models
The measured vertical profiles of the aerosol backscatter and extinction coefficients at
multiple wavelengths can be inverted for particle microphysical parameter profiles using the regularization technique (M ¨uller et al., 1999; Veselovskii et al., 2002, 2009).
How-20
ever, an application of this technique to dust needs to account for their nonsphericity, given that backscattering by irregularly shaped particles is weaker than by equivalent-volume spheres (Mishchenko et al., 2000). To address this issue, Mishchenko et al. (1997) suggested approximating the dust particles with a mixture of polydisperse, randomly oriented spheroids, as they can mimic the aerosol optical properties. Dubovik
25
ACPD
11, 25473–25516, 2011Optical-microphysical properties of Saharan
dust aerosols
A. Papayannis et al.
Title Page
Abstract Introduction
Conclusions References
Tables Figures
◭ ◮
◭ ◮
Back Close
Full Screen / Esc
Printer-friendly Version Interactive Discussion
Discussion
P
a
per
|
Dis
cussion
P
a
per
|
Discussion
P
a
per
|
Discussio
n
P
a
per
|
Veselovskii et al. (2010) introduced the spheroid model into the lidar retrieval of dust particles physical properties, by assuming that aerosols are a mixture of spheres and randomly oriented spheroids with a size-independent shape distribution. This assump-tion is applied to all particles. However, we must keep in mind that for the fine mode the
optical properties of spheres and spheroids are very close and real difference occurs
5
only for the coarse mode. Besides, the result is not very sensitive to the exact type of shape distribution. Thus, the assumption of size-independent shape proposed here remains quite reasonable. Moreover, our numerical simulations demonstrate that for
10 % uncertainty of input optical data (backscatter and extinction coefficients) the dust
particle volume density and the effective radius can be estimated to within 30 %.
10
In this paper the microphysical properties of the aerosols in the lower free tro-posphere, inside the dust layer, were retrieved using the regularization technique (Veselovskii et al., 2002, 2004, 2010), which used as input the vertical profiles of the
aerosol extinctionaaer (at 355–532 nm) and backscatter coefficientsbaer (at
355–532-1064 nm) retrieved from the elastic and Raman backscattered lidar signals (obtained
15
at 5 different wavelengths: 355–387–532–607–1064 nm). The aerosol microphysical
properties inverted concern the effective radius (reff), the total number (N), the surface
area (S) and volume (V), as well as the real and imaginary part of the particle refractive
index (mRandmi, respectively), in different layers in the lower troposphere (1.8–3.5 km
height a.s.l.). In our approach we do not consider the spectral dependence of the
re-20
fractive index size, nor the chemical composition of the aerosol particles. Thus, the retrieved values of the refractive index are the mean ones with respect to the size and spectral range considered (355–1064 nm). Additionally, in our retrieval we consider the
real part of the refractive index (mR) to be in the range 1.33–1.65 and the aerosol
parti-cles diameters in the range between 0.075 and 20 µm. The uncertainty on themRand
25
miretrieval is of the order of±0.05 and±0.0035, respectively, while the corresponding
uncertainty of the retrieved values of the effective radius, volume and surface density is
about±30 %. Finally, the uncertainty on the number density estimation is about 50 %
ACPD
11, 25473–25516, 2011Optical-microphysical properties of Saharan
dust aerosols
A. Papayannis et al.
Title Page
Abstract Introduction
Conclusions References
Tables Figures
◭ ◮
◭ ◮
Back Close
Full Screen / Esc
Printer-friendly Version Interactive Discussion
Discussion
P
a
per
|
Dis
cussion
P
a
per
|
Discussion
P
a
per
|
Discussio
n
P
a
per
We have to clarify here that the inverse problem (using lidar data to retrieve the aerosol micro-physical properties) in our formulation is underdetermined: the set of
lidar measurements is limited to 5 different wavelengths. Unfortunately, this is not suffi
-cient to uniquely describe the properties of the aerosol. Therefore, we use an interme-diate approach whose detailed description is given by Veselovskii et al. (2010). In our
5
case we identify not a unique solution but a family of solutions instead. At the same time, in this process of identifying a family of solutions we use a priori constraints, thus we specifically limit the range of the considered values of the aerosol refractive index. Although those constraints do not provide uniqueness of the solution they significantly help to reduce the number of solution family members. Once the solution family is
iden-10
tified the results are averaged and the mean solution is provided. Thus in our approach we do not use a priori information about a certain particle size distribution (PSD) type, but we assume the size distribution ranging already mentioned before (0.075 to 20 µm). At the same time, the retrieved PSD is characterized by significant uncertainty, as it is shown will be shown later (e.g. Fig. 7b).
15
The inverted refractive index (which corresponds to in-situ conditions, i.e. includes aerosol water) along with the water vapor profiles obtained by Raman lidar over Athens and the temperature and relative humidity profiles obtained by radiosonde, were incor-porated in the thermodynamic model ISORROPIA II (Fountoukis and Nenes, 2007) to infer the composition. The model treats the thermodynamics of aerosol containing
20
K, Ca, Mg, NH3/NH4, Na, SO4/HSO4, HNO3/NO3, HCl/Cl and H2O. ISORROPIA-II
can predict composition for the “stable” (or deliquescent path) solution where salts precipitate once the aqueous phase becomes saturated with respect to a salt, and, a “metastable” solution, where the aerosol is composed only of an aqueous phase regardless of its saturation state. ISORROPIA-II was executed in “reverse” mode,
25
where known quantities are T , RH and the concentrations of aerosol K, Ca, Mg, NH4,
Na, SO4, NO3 and Cl. The output provided by ISORROPIA-II is the aerosol phase
ACPD
11, 25473–25516, 2011Optical-microphysical properties of Saharan
dust aerosols
A. Papayannis et al.
Title Page
Abstract Introduction
Conclusions References
Tables Figures
◭ ◮
◭ ◮
Back Close
Full Screen / Esc
Printer-friendly Version Interactive Discussion
Discussion
P
a
per
|
Dis
cussion
P
a
per
|
Discussion
P
a
per
|
Discussio
n
P
a
per
|
range of environments (including “dust-rich”) (Moya et al., 2001; Zhang et al., 2003; San Martini et al., 2006; Nowak et al., 2006; Metzger et al., 2006; Fountoukis et al., 2009), while its computational rigor and performance makes it suitable for use in large scale air quality and chemical transport models. Some examples of such 3-D models
that have implemented ISORROPIA-II are GISS, CMAQ, PMCAMx, GEOS-Chem, and
5
ECHAM/MESSy (Adams and Seinfeld, 2002; Yu et al., 2005; Pye et al., 2009; Karydis et al., 2010; Pringle et al., 2010).
In order to use ISORROPIA in combination with the Raman lidar data, an assumption concerning the aerosol composition has to be done, mainly due to the absence of air mass sample within the under study layers. In our procedure, at first a typical
10
composition of sulfate, ammonium sulfate and mineral dust aerosols was considered. ISORROPIA was run forward for the computation of complex refractive index for each aerosol composition, using as input the relative humidity and the temperature within an aerosol layer. Finally, the aerosol composition (a mixture of sulfate, ammonium and mineral dust) with the closest refractive index (both real and imaginary part) value to the
15
one estimated by the inversion model is provided as the most acceptable composition value.
2.6 In situ measurements of aerosol properties
In situ sampling of dust aerosols mixed with urban-like ones was performed to infer the mass concentration and the composition of dust particles near ground. The sampling
20
site was installed at the NTUA Campus at the top of a building at 14 m height from
ground level (located 200 m above the mean sea level) and included: PM10continuous
concentration monitoring by TSI Dustrak 8520 and TCR TECORA aerosol sampling. The sampling procedure and the elemental composition determinations are described in detail in Remoundaki et al. (2011).
25
Briefly, PM10 sampling for elemental composition determination and SEM-EDX
(Scanning Electron Microscope-Energy Dispersive X-ray) analysis was carried out
using a TCR TECORA (Sentinel PM) operating at 38.33 l min−1
ACPD
11, 25473–25516, 2011Optical-microphysical properties of Saharan
dust aerosols
A. Papayannis et al.
Title Page
Abstract Introduction
Conclusions References
Tables Figures
◭ ◮
◭ ◮
Back Close
Full Screen / Esc
Printer-friendly Version Interactive Discussion
Discussion
P
a
per
|
Dis
cussion
P
a
per
|
Discussion
P
a
per
|
Discussio
n
P
a
per
calibrated in order to comply with European Standard EN12341 for standard sampling
of PM10. The sampling device operates with autonomy of 16 samples charged in a
charging cassette by programming the sampling span and duration. Aerosol samples were collected on 0.45 µm nuclepore membranes. Twelve samples have been col-lected from 27 March to 2 April 2009. From 28 March to 2 April, two 3-h samples per
5
day were collected: one starting 06:00 UTC and the second starting at 11:00 UTC in order to correspond to urban activities maxima. This 3-h time span during the two ur-ban activities maxima (beginning and end of working day) was also selected in order to avoid sampling interruption due to filter clogging.
Sampling material and filter keeping petri-dishes were pretreated by soaking in
di-10
lute nitric acid solution and thorough rinsing by ultra-pure water (18 MΩcm−1
) and dried
under the laminar flow hood of the laboratory. In order to determine PM10
concentra-tions, the nuclepore membranes were weighted before and after sampling according to the procedure described in Annex C of EN12341 (EN12341, 1999) using a Mettler Toledo MS105 with a resolution of 10 µg in the air conditioned weighing room of the
15
laboratory. The pre-weighted membranes were charged to the filter supports and sam-pler cassette under the laminar flow hood. Filter blanks and blank field samples were also prepared and analyzed together with samples. The filters were also weighted according to the same procedure as described before. The elemental composition determinations have been carried out by EDXRF (SPECTRO XEPOS bench top XRF
20
spectrometer SPECTRO A.I. GmbH) with Pd end window X-ray tube. NIST standard SRM 2783 has been used for spectrometer calibration verification. The elements Si, Al, Fe, K, Ca, Mg, S, Ni, Cu, Zn, Mn, and Ti, have been determined. SPECTRO X-LAB PRO was used for values normalization and error correction. The method detection
limits were 100 ng cm−2 for Mg, 20 ng cm−2 for Al and K, 10 ng cm−2 for Ca, Ti, Fe,
25
5 ng cm−2
for Si, Mn, 2 ng cm−2
for Ni, 1 ng cm−2
for S, Cu and Zn. The estimated pre-cision of the method ranged between 0.1 % and 30 % for individual elements, for most
ACPD
11, 25473–25516, 2011Optical-microphysical properties of Saharan
dust aerosols
A. Papayannis et al.
Title Page
Abstract Introduction
Conclusions References
Tables Figures
◭ ◮
◭ ◮
Back Close
Full Screen / Esc
Printer-friendly Version Interactive Discussion
Discussion
P
a
per
|
Dis
cussion
P
a
per
|
Discussion
P
a
per
|
Discussio
n
P
a
per
|
3 Case study: 27 March–3 April 2009 dust episode
This case study concerns an intense Saharan dust outbreak, which lasted for eight
days (27 March to 3 April 2009) and affected most of the Eastern Mediterranean and
Balkans. The ground and remote sensing instruments were operated continuously during this period (although the NTUA Raman lidar was operated during the end of the
5
episode, when clouds were dispersed and aerosol optical depths were low enough to permit sampling by the laser beam. MODIS and CIMEL instruments did not provide aerosol optical depth between 29 March and 1 April, due to extensive cloud cover.
Figure 1 presents the BSC-DREAM8b predictions of total dust in size classes
be-tween 0.1 and 10 µm (in g m−2
) over the European continent at 12:00 UTC.
Super-10
imposed on the same figure are the corresponding hourly forecasted wind vectors at 3000 m height level. From this figure we see that during the studied period Athens
is influenced by high values of dust loadings (up to 1.5 g m−2
) from 29 March to 3 April. These large amounts of dust particles originated from the Saharan region and approached Greece after passing over the Mediterranean Sea. Trajectory analysis
15
suggests that air masses may often experience interaction with maritime aerosol be-fore reaching the Greater Athens Area. The maximum dust load was predicted to occur over Athens on 28, 29 March and 2 April (Fig. 1).
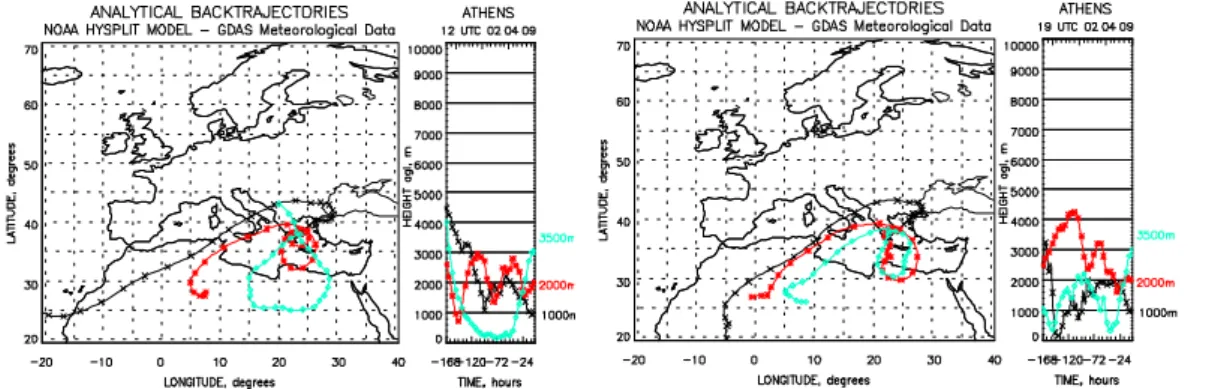
Figure 2 presents back-trajectories calculated by the HYSPLIT model (Draxler et al., 2009) for the air masses arriving over Athens at 1, 2 and 3.5 km height levels at
20
12:00 UTC (left figure) and 19:00 UTC (right figure) on 2 April. The trajectories sug-gest that the air masses originated a week earlier from central, western and eastern Sahara (sometimes within the planetary boundary layer). Subsequently, they traversed over the central Mediterranean region and moved anti-cyclonically over Greece. More precisely, the air masses ending at 2 km height at 12:00 UTC were enriched with dust
25
ACPD
11, 25473–25516, 2011Optical-microphysical properties of Saharan
dust aerosols
A. Papayannis et al.
Title Page
Abstract Introduction
Conclusions References
Tables Figures
◭ ◮
◭ ◮
Back Close
Full Screen / Esc
Printer-friendly Version Interactive Discussion
Discussion
P
a
per
|
Dis
cussion
P
a
per
|
Discussion
P
a
per
|
Discussio
n
P
a
per
at 3.5 km at 19:00 UTC were enriched twice with dust particles passing over the Sahara (about 150 and 30 h, before) (Fig. 2, right).
Aerosol backscatter and Raman measurements at 355, 532 and 1064 nm were per-formed by the NTUA Raman lidar system over Athens only under cloud-free conditions in the studied period. Thus, we will focus on aerosol profiles obtained on 2 April 2009.
5
Figure 3 shows the time-height cross section of the range-corrected backscatter lidar signal (in arbitrary units: AU) obtained at 1064 nm from 13:42 to 20:49 UTC from 300 up to 6000 m a.s.l., after the cloud dissipation. According to the lidar measurements, the entire lower troposphere (from ground up to 3500–4000 m height) is very rich in aerosol particles. More specifically, two thin and distinct aerosol layers are shown, evolving
dur-10
ing the period of measurements. The first layer was located around 2000 m, while the second one was found between 3200–3700 m. Indeed, the BSC-DREAM8b model in-dicates the transfer of Saharan dust particles over Athens (Fig. 1). These particles are mostly confined between 2 and 4 km height (Fig. 4) and have very high forecasted dust
concentrations of the order of 400 µg m−3
at 3 km. These dust heights are also in full
15
accordance with the output of the HYSPLIT model indicating the arrival of dust-rich air masses over Athens originating from the Saharan desert, then passing over Algeria and Tunisia (Fig. 2).
Both aerosol layers detected by lidar slightly descended in height and became more diluted during the afternoon hours, although always present around 2000 m and 3200–
20
3700 m. The Planetary Boundary Layer (PBL) height during daytime reached heights of about 1400 m around 14:00 UTC, while during the afternoon hours it descended down to 500 m a.s.l. around midnight, in full accordance with the closest radiosonde profile data (not shown here). The highest values of the range-corrected backscatter lidar signal within the PBL (shown by the red colour) indicate the possibility of dust
pres-25
ence also near ground, mixed with locally produced aerosols (e.g. by anthropogenic sources).
The mass concentration of PM10 particles measured in situ at 14 m above ground
ACPD
11, 25473–25516, 2011Optical-microphysical properties of Saharan
dust aerosols
A. Papayannis et al.
Title Page
Abstract Introduction
Conclusions References
Tables Figures
◭ ◮
◭ ◮
Back Close
Full Screen / Esc
Printer-friendly Version Interactive Discussion
Discussion
P
a
per
|
Dis
cussion
P
a
per
|
Discussion
P
a
per
|
Discussio
n
P
a
per
|
aerosol rich air masses touched the ground, the aerosol mass concentrations
ex-ceeded 140–160 µg m−3
, from 30 March to 1 April (Remoundaki et al., 2011). During
noon and early afternoon hours, concentrations reached 60–70 µg m−3
, consistent with the lidar retrievals which showed an increase in the range-corrected backscatter lidar signal (Fig. 3). The BSC-DREAM8b model correctly forecasted the existence of a dust
5
layer centred around 3 km (at 18:00 UTC) and extending up to 4–4.5 km height (Fig. 4), although it did not correctly forecast the profile of the aerosol mass concentration near
ground (25 µg m−3
measured versus 10 µg m−3
forecasted). This is because the BSC-DREAM8b forecasts only the dust-related aerosol profiles and not those related to air pollution urban sources.
10
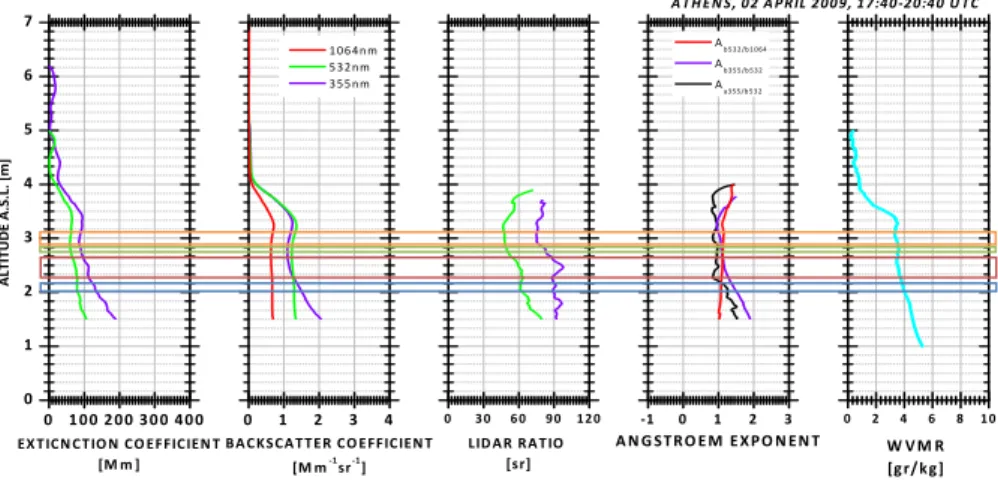
In Fig. 5 the corresponding vertical profiles of the aerosol optical properties (aerosol
extinction, backscatter, lidar ratio, ˚Angstr ¨om backscatter and extinction-related
expo-nent, as well as the water vapour mixing ratio) are presented. The averaging time of the lidar signals for the retrieved vertical profiles is approximately 3 h and the tical range resolution is of the order of 15 m. According to Fig. 5 the aerosol
ver-15
tical profiles indicate the presence of aerosol particles extending up to 4000 m a.s.l.
The mean values of the ˚Angstr ¨om backscatter and extinction-related exponent
(Pa-payannis et al., 2008; M ¨uller et al., 2009) inside the dust layer (located between 1500
and 4000 m), were equal to 1.0±0.2, indicating the presence of rather small aerosols
(0.1 µm<diameter<1 µm). The corresponding water vapour vertical profile derived by
20
the NTUA Raman lidar showed that its mixing ratio remained lower than 4 g kg−1
inside the dust layer, indicating a probable mixing of the dust particles with humidity of mar-itime origin. Indeed, the relative humidity profile obtained by radiosonde at a nearby location (about 15 km apart) showed moderate to high relative humidity values (79– 80 %) around the 3 km height region. However, both dust and water vapour vertical
25
profiles agreed that dust is located below 4 km height, inside a moderately humid air layer.
The mean lidar ratio (LR), the ˚Angstr ¨om backscatter-related (ABR) and the ˚Angstr ¨om
ACPD
11, 25473–25516, 2011Optical-microphysical properties of Saharan
dust aerosols
A. Papayannis et al.
Title Page
Abstract Introduction
Conclusions References
Tables Figures
◭ ◮
◭ ◮
Back Close
Full Screen / Esc
Printer-friendly Version Interactive Discussion
Discussion
P
a
per
|
Dis
cussion
P
a
per
|
Discussion
P
a
per
|
Discussio
n
P
a
per
layers (from 1.9 up to 4 km height) at 355 nm (LR=83±8 sr, ABR=1.1, AER=0.9)
and 532 nm (LR=60±7 sr) are consistent with the relevant observations (LR=30–80
sr at 355 nm) performed over Athens (Papayannis et al., 2005) and those reported by M ¨uller et al. (2009a, b), Tesche et al. (2009) and Wandinger et al. (2010), performed in
the Saharan desert during the SAMUM experiment (LR∼50–80 sr and ABR∼0 to 0.5,
5
AER∼ −0.3 to 1 at 355 nm and LR∼50–100 sr and ABR∼0.25 to 0.75 at 532 nm), as
well as those performed over Europe in the frame of the EARLINET project (Papayannis
et al., 2008) (LR∼30–80 sr at 355 nm, ABR∼ −0.5 to 3 and LR∼50–55 sr at 532 nm).
In our case, the corresponding AOD was 0.53 and 0.31 at 355 and 532 nm, respectively. Figure 6 shows the temporal evolution of the CIMEL sun photometer AOD at eight
10
wavelengths and the ˚Ansgtr ¨om exponent (α) over Athens for the period 27 March
to 3 April 2009 The ˚Angstr ¨om exponent (α) is derived according to the ˚Angstr ¨om
power law, using the 440, 670 and 870 nm channels (e.g. Eck et al., 1999;
Hol-ben et al., 2001). From the almucantar sky radiance measurements (see also
http://aeronet.gsfc.nasa.gov) at the four highest wavelengths an inversion algorithm
15
(AERONET version 2), as described by Dubovik et al. (2002, 2006), retrieves a large set of optical and microphysical aerosol parameters. In Fig. 6, the MODIS AODs at 550 nm are additionally presented (white squares) along with the BSC-DREAM8b dust AODs at 550 nm (upper panel). CIMEL data between 29 March and 1 April are lacking owing to excessive cloud cover over the city of Athens.
20
Moreover, the MODIS data for the wider area of Athens (10×10 km over the station)
on 29 March, showed that the evolution of the event was well captured by the BSC-DREAM8b model. The BSC-BSC-DREAM8b data incorporated in Fig. 6, as AOD values, showed the quick arrival of the desert plume over the Athens station on 29 March, and then on 2 April. The highest CIMEL AOD was registered on 2 April with a value of
25
0.7 (440 nm). The desert dust plume was also visible on 3 April, while the following days (from 4 April) showed a clear weakening of the event as the desert plume quickly moved away, as shown by the AOD, which dropped back to background levels. The
ACPD
11, 25473–25516, 2011Optical-microphysical properties of Saharan
dust aerosols
A. Papayannis et al.
Title Page
Abstract Introduction
Conclusions References
Tables Figures
◭ ◮
◭ ◮
Back Close
Full Screen / Esc
Printer-friendly Version Interactive Discussion
Discussion
P
a
per
|
Dis
cussion
P
a
per
|
Discussion
P
a
per
|
Discussio
n
P
a
per
|
is also shown in the lower panel, showing low values (from 0.4 to 1.0) for 2 and 3 April, in inverse correspondence with the high AOD for desert aerosols. One of the characteristics of the desert dust episodes in our area (Balis et al., 2004) is the high variability shown by both parameters during each day.
As can be seen in Fig. 6, on 2 April between 10:00 and 14:00 UTC, we observed high
5
AODs due to strong dust layers which were advected to the observation location (as shown in lidar data). For the same day, the mean daily volume aerosol size distribution (not shown) exhibited two modes, but the relative importance of the modes depends on the prevailing aerosol type: an accumulation or fine mode with particle radius below 0.6 µm, and a coarse mode with particle radius between 0.6 and 15 µm. In this case,
10
we expect a predominant coarse mode during desert dust conditions. The mode radii and volume concentrations were analyzed in order to characterize the aerosol dust evolution. The evolution of the desert dust is clear in the coarse mode fraction.
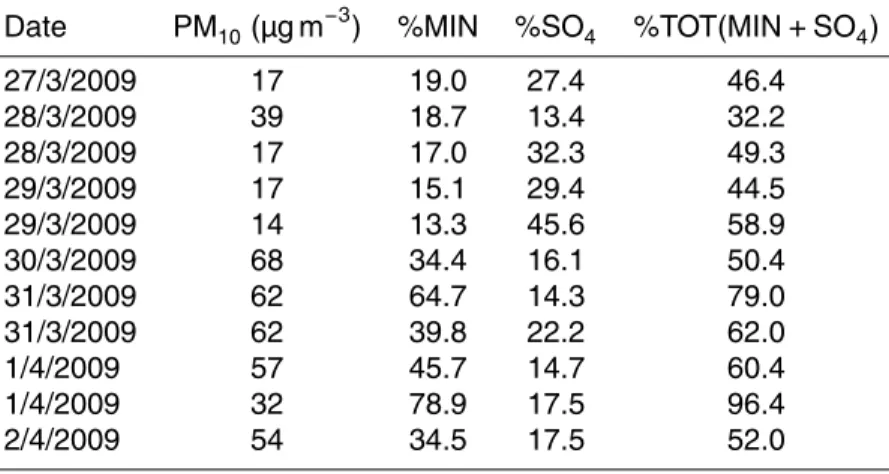
Table 1 presents the percent contribution of dust and sulfates to PM10. The detailed
calculations have already been presented in Remoundaki et al. (2011). From this Table,
15
it can be seen that dust contribution was at the level of 15 % before the arrival of the Saharan dust and increased significantly during the dust event reaching 65 % on March
31 and 79 % on 1 April, respectively. Sulfates contribution (SO2−
4 ) was in expected
levels and presented a maximum on 29 March where southerlies, (responsible for long-range transport of particles of crustal origin) were simultaneously present with west
20
winds charged with aerosol particles from local urban and industrial emission sources (e.g. oil refineries of Aspropyrgos located in the WNW-NW sector) (Remoundaki et al.,
2011). Finally, both dust and sulfates represent significant fraction of PM10 explaining
in some cases more than 50 % of the PM10 mass.
The EDX analysis of all particles sampled (Remoundaki et al., 2011) during the
re-25
ported period (27 March to 3 April 2009), revealed that aluminosilicates (clays) were predominant. The presence of illite was obvious in many cases, quartz particles
were rare and very difficult to be detected. Dust particles were very rich in calcium
ACPD
11, 25473–25516, 2011Optical-microphysical properties of Saharan
dust aerosols
A. Papayannis et al.
Title Page
Abstract Introduction
Conclusions References
Tables Figures
◭ ◮
◭ ◮
Back Close
Full Screen / Esc
Printer-friendly Version Interactive Discussion
Discussion
P
a
per
|
Dis
cussion
P
a
per
|
Discussion
P
a
per
|
Discussio
n
P
a
per
smectites). Iron oxides were often detected. These results are in very good agreement and confirm those reported on the elemental composition of the dust and the origins of the air masses which first started from the Western Sahara and over passed north-ern Algeria on their way to Greece. These findings are also in very good agreement with literature on the Saharan particles characterization and their relationship to their
5
origins (Coude-Gaussen G. et al., 1987; Avila et al., 1997; Blanco et al., 2003; Coz et al., 2009).
Using the aerosol backscatter profiles at 355, 532 and 1064 nm and the correspond-ing aerosol extinction profiles at 355 and 532 nm, we calculated the aerosol microphys-ical properties with the retrieval code for spheroid particles (Veselovskii et al., 2010)
us-10
ing the lidar data of 2 April. As mentioned previously, the retrieval algorithm represents the aerosol as a mixture of spheres and spheroids. However, without knowledge of the particle depolarization ratio (which provides a measure of the particle non-sphericity), the spheroid volume ratio (SVR) is underestimated, which leads to the underestimation of the real part of refractive index (Veselovskii et al., 2010). Thus, it is more accurate
15
to suggest that the majority of the particle volume in the considered height range is related to non spherical particles. This assumption is justified by the HYSPLIT tra-jectories, which suggest that most of the particles in the coarse mode is associated with dust. The finer mode particles (and a fraction of the coarse dust) are expected to mix with anthropogenic pollution and sea salt; this, together with aerosol water will
20
undoubtfully make particles more spherical.
We selected to retrieve the aerosol properties at four different layers for the period
between 17:40–20:40 UT: layer 1 (1910–2070 m), layer 2 (2284–2850), layer 3 (2960– 3100 m) and layer 4 (3140–3420 km). The retrieved particle volume size distributions
d V/dlnr for the four considered layers is shown in Fig. 7a. Moreover, the integral
25
particle parameters, such as volume (V), surface (S), number (N) densities, effective
radius (reff) and real (mR) and imaginary (mi) part of refractive index are summarized
ACPD
11, 25473–25516, 2011Optical-microphysical properties of Saharan
dust aerosols
A. Papayannis et al.
Title Page
Abstract Introduction
Conclusions References
Tables Figures
◭ ◮
◭ ◮
Back Close
Full Screen / Esc
Printer-friendly Version Interactive Discussion
Discussion
P
a
per
|
Dis
cussion
P
a
per
|
Discussion
P
a
per
|
Discussio
n
P
a
per
|
mode is centered near 1 and 2 µm. More specifically, at lower heights (layer 1) the fine mode is prevailing, but at higher altitudes the contribution of the coarse mode becomes more important. The fine mode containing the small particles determines the integral particle number density. In our case, the fine mode particles decrease, thus resulting
inN decreasing from 1700 cm−3
in the layer 1 to 700–800 cm−3
in layers 3 and 4. On
5
the other hand, the effective radius rises from 0.22 µm to around 0.32 µm between layer
1 and layers 3 and 4. In fact, the in situ aerosol sampling revealed that near the end of the Saharan dust event on 2 April, the dominant size of the particles diameter was smaller than 2 µm (Remoundaki et al., 2011), which is consistent with the retrieved aerosol volume size distribution (Fig. 7a).
10
In Fig. 7b we show the aerosol size distribution (total column) measured by the
CIMEL sun photometer for different hours (from 05:55:42 UTC to 13:30:45 UTC), where
two main aerosol classes are found: those of fine (around 0.15 µm radius) and those of coarse particles (around 1–2 µm radius). Furthermore, if we divide the integrated CIMEL data (at 13:30:45 UTC) by the height of 4 km (where most of the dust are
con-15
fined) we obtain maxima of the d V(r)/dln(r) of the order of 9 and 15 µm3cm−3 for
the fine and coarse mode, respectively. These maximum values are quite close to the maximum size distribution values (Fig. 7a) retrieved from the lidar data (5.5–12.5
and 7.5–10 µm3cm−3, respectively). Moreover, both Fig. 7a and b show comparable
size distributions having radius centered around 0.15 µm (fine mode) and 1 to 2 µm,
20
respectively. Although there is some difference, especially in the coarse (around 1 µm
radius) particles, temporal variability and non concurrent measurements between the retrievals could account for it.
Moreover, the retrieved real part of the refractive index is of the order of 1.47 in the layers 1 and 2, indicating mixing of dust with urban-like sulphate and organic
car-25
ACPD
11, 25473–25516, 2011Optical-microphysical properties of Saharan
dust aerosols
A. Papayannis et al.
Title Page
Abstract Introduction
Conclusions References
Tables Figures
◭ ◮
◭ ◮
Back Close
Full Screen / Esc
Printer-friendly Version Interactive Discussion
Discussion
P
a
per
|
Dis
cussion
P
a
per
|
Discussion
P
a
per
|
Discussio
n
P
a
per
in all layers ismI=0.007±0.0035, indicating non-urban influenced absorbing particles
(Patterson et al., 1977; Sokolik et al., 1993; Sokolik and Toon, 1999; Ebert et al, 2004; M ¨uller et al., 2009; Kandler et al., 2009).
It is interesting to note that the latest available Cimel data for 2 April, obtained at 13:30 UTC over Athens (not shown here), gave a columnar refractive index of the order
5
of 1.53–1.55 (real part), while the imaginary part was ranging from 0.009i to 0.015i. These values represent column values which are obtained during the Saharan dust event several hours before the lidar sampling; they are typical of mixtures of silicate par-ticles with sea salt (Ebert et al., 2002). Moreover, the retrieved mean columnar value
of the effective radius was 0.21 µm (at 13:30:45 UTC), which compares very well with
10
the retrieved value (0.22 µm), from the lidar data at the dust layer 1 (between 17:40– 20:40 UTC), but less with those retrieved from layers 2–4 (2.28–3.42 km), as shown in Table 2. Indeed, layers 2 to 4 (17:40 to 20:40 UTC) are related to the strong dust layer which appeared around 3.5 km (from 13:42 to 16:00 UTC) (see Fig. 3), therefore, they could be probably associated to bigger dust particles.
15
The final data set of the aerosol optical and microphysical properties along with the water vapor profiles were incorporated into the ISORROPIA II model (Fountoukis and Nenes, 2007) to infer the chemical parameters of the aerosols (e.g. dry chemical composition) that are consistent with the retrieved refractive index values (Table 2). For the aerosols located at layer 1, we derived a chemical composition of about 50–
20
60 % sulfate, 15–25 % organic carbon (OC) and 15–35 % mineral dust is required for this. At the second layer, the model showed less concentration of sulfates and a slide increase of OC in comparison with the first one. Specifically, the retrieved chemical composition was of the order of 32–52 % for sulfates, 28–36 % for the OC and 12–40 % mineral dust. For the aerosols located at layer 3 we derived a chemical composition of
25
ACPD
11, 25473–25516, 2011Optical-microphysical properties of Saharan
dust aerosols
A. Papayannis et al.
Title Page
Abstract Introduction
Conclusions References
Tables Figures
◭ ◮
◭ ◮
Back Close
Full Screen / Esc
Printer-friendly Version Interactive Discussion
Discussion
P
a
per
|
Dis
cussion
P
a
per
|
Discussion
P
a
per
|
Discussio
n
P
a
per
|
index (of the order of 1.52) and reflects the tendency of organic carbon to partition to the aerosols phase, under the cooler conditions at higher altitudes (Seinfeld and Pandis, 2008).
These findings, which indeed indicate mixing of mineral dust aerosols with sulfate and OC ones (typical from urban air pollution sources), are in accordance with the
5
lidar data presented in Fig. 3, where the dust layered aerosols around 2000–3500 m (between 17:40–20:40 UT) are diluted over the PBL, through mixing with locally pro-duced ones. Table 2 summarizes the optical, microphysical and chemical properties of aerosols retrieved at the four specific layers (1st to 4th layer), as well as the RH (%) at
each layer for 2 April 2009. Regarding the percentage of mineral dust (34.5 %) to PM10
10
shown in Table 1, we see that the findings from the chemical analysis are in the upper limit values of those derived by the ISORROPIA II model for the lower atmospheric layers (1st and 2nd layers, located from 1.9 to 2.85 km a.s.l.). Given that OC is not measured, 34.5 % is in reality the upper limit of dust concentration.
On the other hand, the percentage of SO2−
4 contribution to PM10 near ground (see
15
Table 1) was much lower than the ones derived by the ISORROPIA II model for the lower atmospheric layers, but it agreed quite well with the lower limit values of those derived by the ISORROPIA II model for the upper atmospheric layers (3rd and 4th layers, located from 2.9 to 3.42 km a.s.l.). Given that the filter integrates over a larger period than the lidar (Remoundaki et al., 2011), the average chemical composition
20
differs from the retrieval: furthermore, changes in acidity (due to uptake of ammonium)
affect the mass associated with the sulfate ion by 40 % (Seinfeld and Pandis, 2008).
4 Conclusions
In this manuscript, we attempted to combine experimental data (multi-wavelength Ra-man data (3 aerosol backscatter and 2 extinction profiles) and in situ measurements
25
ACPD
11, 25473–25516, 2011Optical-microphysical properties of Saharan
dust aerosols
A. Papayannis et al.
Title Page
Abstract Introduction
Conclusions References
Tables Figures
◭ ◮
◭ ◮
Back Close
Full Screen / Esc
Printer-friendly Version Interactive Discussion
Discussion
P
a
per
|
Dis
cussion
P
a
per
|
Discussion
P
a
per
|
Discussio
n
P
a
per
During a strong Saharan dust event occurred over Athens (27 March to 3 April 2009), selected measurements were performed to observe the optical properties of the dust particles in the lower troposphere. A hybrid regularization technique was used to de-rive the mean microphysical properties of the dust particles, while the thermodynamic model ISORROPIA II was used to infer the aerosol chemical properties at four selected
5
dust layers between 2.9 and 3.4 km. AOD values, derived from the CIMEL photometer, ranged from 0.53 (355 nm) to 0.31 (532 nm), while the LR values retrieved from the Raman lidar ranged from 75–100 sr (355 nm) and 50–70 sr (532 nm). Relative humidity of the order of 60–80 % and AE values related to backscatter of about 0.85–1.25 were
observed inside the dust layers. The higher value ofα (1.25) observed at the lower
10
atmospheric layer, indicates a probable mixing of the dust particles with locally
pro-duced particles, while the higher dust layers seemed to be less affected by the locally
produced aerosols, since their AE values remained much lower (0.85–0.94) indicat-ing the dominance of the coarse particles. In between the four selected dust layers
mean aerosol refractive indexes of 1.49(±0.05)+0.007(±0035)i and effective radiuses
15
ranging from 0.22±0.06 to 0.33±0.1 µm were retrieved. The inferred chemical
prop-erties showed a 12–40 % of dust content, a sulphate composition of 16–60 %, and organic carbon content (OC) lower than 15–64 %. Indeed, the first two layers seemed
to be more affected by the locally produced particles (higher sulphate and less dust
contents), while the higher layers were less affected (lower sulphate and higher dust
20
maxima contents). In situ airborne aerosol sampling together with multi-wavelength Raman lidar measurements should be performed to further evaluate the procedure proposed in this study.
Acknowledgements. The financial support for EARLINET (EARLINET-ASOS) by the
Euro-pean Commission under grant RICA-025991 and the EuroEuro-pean Space Agency (ESA-AO/1-25
ACPD
11, 25473–25516, 2011Optical-microphysical properties of Saharan
dust aerosols
A. Papayannis et al.
Title Page
Abstract Introduction
Conclusions References
Tables Figures
◭ ◮
◭ ◮
Back Close
Full Screen / Esc
Printer-friendly Version Interactive Discussion
Discussion
P
a
per
|
Dis
cussion
P
a
per
|
Discussion
P
a
per
|
Discussio
n
P
a
per
|
NASA-ACMAP. This research has been co-financed by the European Union (European So-cial Fund – ESF) and Greek national funds through the Operational Program “Education and Lifelong Learning” of the National Strategic Reference Framework (NSRF) – Research Fund-ing Program: Heracleitus II. InvestFund-ing in knowledge society through the European Social Fund. REM acknowledges the funding of the “Greek State Scholarship Foundation: IKY”. PK acknowl-5
edges the ESA financial support under ESTEC contract 21487/08/NL/HE.
References
Adams, P. J. and Seinfeld, J. H.: Predicting global aerosol size distributions in general circula-tion models, J. Geophys. Res., 104, 13791–13823, doi:10.1029/2001JD001010, 2002. Andreae, M. O.: Climatic effects of changing atmospheric aerosol levels, in: World Survey of 10
Climatology, vol. 16, Future Climate of the World, edited by: Henderson-Sellers, A., 341–392, Elsevier, Amsterdam, 1995.
Annesi-Maesano, I., Forastiere, F., Kunzli, N., and Brunekref B.: Particulate matter, science and EU policy, Eur. Respir. J., 29, 428–431, doi:10.1183/09031936.00129506, 2007. Ansmann A., Riebesell, M., Wandinger, U., Weitkamp, C., Voss, C., Lahmann, W. and 15
Michaelis, W.: Combined Raman Elastic-Backscatter lidar for vertical profiling of moisture, aerosol extinction, backscatter, and lidar ratio, Appl. Phys. B, 55, 18–28, 1992.
Ansmann, A., B ¨osenberg, J., Chaikovsky, A., Comeron, A., Eckhardt, S., Eixmann, R., Freuden-thaler, V., Ginoux, P., Komguem, L., Linne, H., Lopez Marquez, M. A., Matthias, V., Mattis, I., Mitev, V., Muller, D., Music, S., Nickovic, S., Pelon, J., Sauvage, L., Sobolewsky, P., Srivas-20
tava, M. K., Stohl, A., Torres, O., Vaughan, G., Wandinger, U., and Wiegner, M.: Long-range transport of Saharan dust to northern Europe: The 11–16 October 2001 outbreak observed with EARLINET, J. Geophys. Res., 108(D24), 4783, doi:10.1029/2003JD003757, 2003. Ansmann, A., Mattis, I., M ¨uller, D., Wandinger, U., Radlach, M., and Althausen, D.: Ice
forma-tion in Saharan dust over central Europe observed with temperature/humidity/aerosol Raman 25
lidar, J. Geophys. Res., 110, D18S12, doi:10.1029/2004JD005000, 2005.
ACPD
11, 25473–25516, 2011Optical-microphysical properties of Saharan
dust aerosols
A. Papayannis et al.
Title Page
Abstract Introduction
Conclusions References
Tables Figures
◭ ◮
◭ ◮
Back Close
Full Screen / Esc
Printer-friendly Version Interactive Discussion
Discussion
P
a
per
|
Dis
cussion
P
a
per
|
Discussion
P
a
per
|
Discussio
n
P
a
per
Saharan dust layers as detected by a Raman lidar at Thessaloniki, Greece, Geophys. Res. Lett., 31, L13104, doi:10.1029/2004GL019881, 2004.
Balkanski, Y., Schulz, M., Claquin, T., and Guibert, S.: Reevaluation of Mineral aerosol radia-tive forcings suggests a better agreement with satellite and AERONET data, Atmos. Chem. Phys., 7, 81–95, doi:10.5194/acp-7-81-2007, 2007.
5
Berthier, S., Chazette, P., Couvert, P., Pelon, J., Dulac, F., Thieuleux, F., Moulin, C., and Pain, T.: Desert dust aerosol columnar properties over ocean and continental Africa from Lidar in-Space Technology Experiment (LITE) and Meteosat synergy, J. Geophys. Res., 111, D21202, doi:10.1029/2005JD006999, 2006.
Blanco, A., Dee Tomasi, F., Filippo, E., Manno, D., Perrone, M. R., Serra, A., Tafuro, A. M., 10
and Tepore, A.: Characterization of African dust over southern Italy, Atmos. Chem. Phys., 3, 2147–2159, doi:10.5194/acp-3-2147-2003, 2003.
Chan L. Y., Lau, W. L., Lee, S. C., and Chan, C. Y.; Commuter exposure to particulate matter in public transportation modes in Hong Kong, Atmos. Environ., 36, 3363–3373, 2002. Chu, D. A., Kaufman, Y. J., Zibordi, G., Chern, J. D., Mao, J., Li, C., and Holben, B. N.: 15
Global monitoring of air pollution over land from the Earth Observing System-Terra Mod-erate Resolution Imaging Spectroradiometer (MODIS), J. Geophys. Res., 108(D21), 4661, doi:10.1029/2002JD003179, 2003.
Coude-Gaussen, G., Rognon, P., Bergametti, G., Gomez, L., Strauss, B., Gros, J. M., and Le Costumer, N.: Saharan dust over Fuerteventura island (Canaries): chemical and miner-20
alogical characteristics, air mass trajectories, and probable sources, J. Geophys. Res., 92, 9753–9771, 1987.
Coz, E., Gomez-Moreno, F. J., Pujadas, M., Casuccio, G. S., Lersh, T. L., and Artinao, B.: Indi-vidual particle characteristics of North African dust under different long-transport scenarios, Atmos. Environ., 43, 1850–1863, 2009.
25
Draxler, R. R., Stunder, B., Rolph, G., and Talylor, A.: Hysplit 4 User’s Guide, NOAA Air Re-sources Laboratory, Silver Spring, MD, USA, 2009.
Dubovik, O., Sinyuk, A., Lapyonok, T., Holben, B. N., Mishenko, M., Yang, P., Eck, T. F., Volten, H., Munoz, O., Veihelmann, B., van der Zande, W. J., Leon, J.-F., Sorokin, M., and Slutsker, I.: Application of spheroid models to account for aerosol particle nonsphericity in remote 30
sensing of desert dust, J. Geophys. Res., 111, D11208, doi:10.1029/2005JD006619, 2006. Ebert, M., Weinbruch, S., Rausch, A., Gorzawski, G., Hoffmann, P., Wex, H., and Helas, G.:
individ-ACPD
11, 25473–25516, 2011Optical-microphysical properties of Saharan
dust aerosols
A. Papayannis et al.
Title Page
Abstract Introduction
Conclusions References
Tables Figures
◭ ◮
◭ ◮
Back Close
Full Screen / Esc
Printer-friendly Version Interactive Discussion
Discussion
P
a
per
|
Dis
cussion
P
a
per
|
Discussion
P
a
per
|
Discussio
n
P
a
per
|
ual particles, J. Geophys. Res., 107(D21), 8121, doi:10.1029/2000JD000195, 2002.
Ebert, M., Weinbruch, S., Hoffmann, P., and Ortner, H. M.: The chemical composition and complex refractive index of rural and urban influenced aerosols determined by individual particle analysis, Atmos. Environ., 38, 6531–6545, 2004.
EN12341, Air quality. Determination of the PM10fraction of suspended particulate matter.
Ref-5
erence method and field test procedure to demonstrate reference equivalence of measure-ment methods, ISBN: 0 580 32078 2, 18 pp., 1999.
Feingold, G., Yang, S., Hardesty, R. M., and Cotton, W. R.: Feasibility of retrieving Cloud Condensation Nucleus properties from Doppler cloud radar, microwave radiometer, and lidar, J. Atmos. Oceanic Technol., 15, 1188–1195, 1998.
10
Feingold, G. and Morley, B.: Aerosol hygroscopic properties as measured by li-dar and comparison with in situ measurements, J. Geophys. Res., 108(D11), 4327, doi:10.1029/2002JD002842, 2003.
Forster, P., Ramaswamy, V., Artaxo, P., Bernsten, T., Betts, R., Fahey, D. W., Haywood, J., Lean, J., Lowe, D. C., Myhre, G., Nganga, J., Prinn, R., Raga, G., Schulz, M., and Van 15
Dorland, R.: Changes in Atmospheric Constituents and in Radiative Forcing, in: Climate Change 2007: The Physical Science Basis. Contribution of Working Group I to the Fourth Assessment Report of the Intergovernmental Panel on Climate Change, edited by: Solomon, S., Qin, D., Manning, M., Chen, Z., Marquis, M., Averyt, K. B., Tignor, M., and Miller, H. L., Cambridge University Press, Cambridge, UK, 129–234, 2007.
20
Fountoukis C., and Nenes, A.: ISORROPIA II: a computationally efficient thermodynamic equilibrium model for K+–Ca2+–Mg2+–NH+4–Na+–SO−4
2 –NO
−3
–Cl−
–H2O aerosols, Atmos.
Chem. Phys., 7, 4639–4659, doi:10.5194/acp-7-4639-2007, 2007.
Fountoukis, C., Nenes, A., Sullivan, A., Weber, R., Van Reken, T., Fischer, M., Mat´ıas, E., Moya, M., Farmer, D., and Cohen, R. C.: Thermodynamic characterization of Mexico City aerosol 25
during MILAGRO 2006, Atmos. Chem. Phys., 9, 2141–2156, doi:10.5194/acp-9-2141-2009, 2009.
Ganor, E., Osetinsky, I., Stupp, A., and Alpert, P.: Increasing trend of African dust, over 49 years, in the eastern Mediterranean, J. Geophys. Res., 115, D07201, doi:10.1029/2009JD012500, 2010.
30
Ghan, S. and Collins, D. R.: Use of in situ data to test a Raman lidar–based cloud condensation nuclei remote sensing method, J. Atmos. Ocean. Tech., 21, 387–394, 2004.