www.atmos-chem-phys.net/10/3215/2010/ © Author(s) 2010. This work is distributed under the Creative Commons Attribution 3.0 License.
Chemistry
and Physics
Fluorescent biological aerosol particle concentrations and size
distributions measured with an Ultraviolet Aerodynamic Particle
Sizer (UV-APS) in Central Europe
J. A. Huffman1, B. Treutlein1,2, and U. P¨oschl1
1Max Planck Institute for Chemistry, Biogeochemistry Department, Becherweg 27, Mainz, 55128, Germany 2now at: Ludwig Maximilians University, Institute for Physical Chemistry, Munich, Germany
Received: 24 July 2009 – Published in Atmos. Chem. Phys. Discuss.: 28 August 2009 Revised: 5 March 2010 – Accepted: 16 March 2010 – Published: 6 April 2010
Abstract. Primary Biological Aerosol Particles (PBAPs),
including bacteria, spores and pollen, are essential for the spread of organisms and disease in the biosphere, and nu-merous studies have suggested that they may be important for atmospheric processes, including the formation of clouds and precipitation. The atmospheric abundance and size dis-tribution of PBAPs, however, are largely unknown. At a semi-urban site in Mainz, Germany we used an Ultraviolet Aerodynamic Particle Sizer (UV-APS) to measure Fluores-cent Biological Aerosol Particles (FBAPs), which provide an estimate of viable bioaerosol particles and can be regarded as an approximate lower limit for the actual abundance of PBAPs. Fluorescence of non-biological aerosol components are likely to influence the measurement results obtained for fine particles (<1 µm), but not for coarse particles (1–20 µm). Averaged over the four-month measurement period (August–December 2006), the mean number concentration of coarse FBAPs was ∼3×10⁻²cm−3, corresponding to
∼4% of total coarse particle number. The mean mass concentration of FBAPs was∼1 µg m−3, corresponding to
∼20% of total coarse particle mass. The FBAP number size distributions exhibited alternating patterns with peaks at var-ious diameters. A pronounced peak at ∼3 µm was essen-tially always observed and can be described by the following campaign-average lognormal fit parameters: geometric mean diameter 3.2 µm, geometric standard deviation 1.3, number concentration 1.6×10⁻²cm−3. This peak is likely due to
Correspondence to: J. A. Huffman
(a.huffman@mpic.de)
fungal spores or agglomerated bacteria, and it exhibited a pronounced diel cycle (24-h) with maximum intensity during early/mid-morning. FBAP peaks around∼1.5 µm, ∼5 µm, and∼13 µm were also observed, but less pronounced and less frequent. These may be single bacterial cells, larger fun-gal spores, and pollen grains, respectively.
The observed number concentrations and characteristic sizes of FBAPs are consistent with microscopic, biological and chemical analyses of PBAPs in aerosol filter samples. To our knowledge, however, this is the first exploratory study reporting continuous online measurements of bioaerosol par-ticles over several months and a range of characteristic size distribution patterns with a persistent bioaerosol peak at
∼3 µm. The measurement results confirm that PBAPs ac-count for a substantial proportion of coarse aerosol particle number and mass in continental boundary layer air. More-over, they suggest that the number concentration of viable bioparticles is dominated by fungal spores or agglomerated bacteria with aerodynamic diameters around 3 µm rather than single bacterial cells with diameters around 1 µm.
1 Introduction
and characteristic size ranges of PBAP are viruses (0.01– 0.3 µm), bacteria (0.1–10 µm), fungal and fern spores (1– 30 µm), plant pollen (5–100 µm), and fragments of animal and plant matter (e.g. Gregory, 1978; Simoneit and Mazurek, 1982; Matthias-Maser and Jaenicke, 1995; Jones and Harri-son, 2004; Jaenicke, 2005; Elbert et al., 2007; Bauer et al., 2008). PBAPs can play an important role in public health by affecting allergies (Linskens and Cresti, 2000; Franze et al., 2005) and spreading disease to humans and crops, both natu-rally and as agents of terrorism (e.g. Lacey and Dutkiewicz, 1994; Brown and Hovmoller, 2002; Ho and Duncan, 2005). Many organisms rely on bioaerosols for the distribution and transfer of genetic material for reproductive purposes, as in the cases of plant pollen and fungal spores, which can also undergo transport over long distances (Elbert et al., 2007, and referencse therein). PBAPs may also influence climate and the hydrological cycle by initiating the formation of clouds and precipitation as cloud condensation and ice nuclei (Din-gle, 1966; Schnell and Vali, 1972; Hamilton and Lenton, 1998; Diehl et al., 2001; Lohmann and Feichter, 2005; Dusek et al., 2006; McFiggans et al., 2006; Sun and Ariya, 2006; Christner et al., 2008; Deguillaume et al., 2008; Morris et al., 2008; Mortazavi et al., 2008; Rosenfeld et al., 2008; Ariya et al., 2009; Bowers et al., 2009; Pratt et al., 2009; Prenni et al., 2009).
Recent studies have found significant concentrations of DNA (ng m−3) and a wide range of bacteria and fungal spores in fine and coarse particulate matter from urban, ru-ral, and high-alpine air (Wittmaack et al., 2005; Despr´es et al., 2007; Fr¨ohlich-Nowoisky et al., 2009). For tropical rain-forest regions where both physicochemical processes in the atmosphere and biological activity at the Earth’s surface are particularly intense, Elbert et al. (2007) reported that fun-gal spores account for large fractions of coarse particle mass concentrations (∼30%) and estimated global emission rates of the order of 50 Tg a−1. Jaenicke et al. (2007) summarize measurements covering a variety of geographical locations and particle size ranges showing that 15–74% of the total aerosol number as being PBAPs including∼20% in the semi-urban setting in Mainz, Germany. Continuous measurements of PBAPs have been limited, however, and so actual abun-dances, properties, as well as the origin of PBAPs and their components are still poorly quantified and understood. Re-cent model studies and literature reviews highlight the need for more measurement data to constrain regional and global emissions, transport, and abundance of PBAPs in the at-mosphere (Burrows et al., 2009a, b; Heald and Spracklen, 2009).
In the past, most PBAP measurements were based on off-line techniques with low time resolution (hours/days). Within the last decades and motivated by need to detect bioaerosols as possible Bio-Warfare Agents (BWA), the ap-plication of ultraviolet Laser-Induced Fluorescence (LIF) to online aerosol analysis has enabled the detection of PBAPs in real-time, with time resolution of minutes or less (Hill et al.,
available information suggests that coarse fluorescent parti-cles (>1 µm) measured by the UV-APS can be regarded as “Fluorescent Biological Aerosol Particles” (FBAP), which provide an estimate of viable bioaerosol particles and whose abundance represents an approximate lower limit for the ac-tual abundance of primary biological aerosol particles.
Previous work has studied the UV-APS response in the laboratory to cell viability (Agranovski et al., 2003a; Laflamme et al., 2005), aerosols containing marker biolog-ical molecules (Agranovski et al., 2004b; Agranovski and Ristovski, 2005), and also with respect to real-time measure-ment of bacteria (Brosseau et al., 2000; Agranovski et al., 2003a, b) and fungal spores (Kanaani et al., 2007, 2008a, b), but little has been done to utilize the instrument for long term (>days) ambient measurement. Ho and Spence (1998) used a UV-APS for short periods of time to measure back-ground FBAP concentrations at several military locations within Canada, and both Pinnick et al. (2004) and Pan et al. (2007) utilized a LIF spectrometer for detection of FBAP in ambient air in New Mexico and Maryland. A variety of bioaerosol detection techniques have been utilized to charac-terize bioaerosol emissions from a variety of occupationally specific exposure environments, such as from livestock fa-cilities (Agranovski et al., 2004a; Seedorf, 2004; Kim et al., 2007), waste treatment plants (Lavoie et al., 2006; Nikaeen et al., 2009) and in various indoor environments (Burge, 1990; Moschandreas et al., 1996; Law et al., 2001). Recently, flu-orescence measurements of bioparticles have also been re-ported for tropical rainforest air (Gabey et al., 2009; Prenni et al., 2009; Huffman, Garland, P¨oschl, et al., 2010).
In this study we have applied a UV-APS for the detection and sizing of FBAPs in urban and rural continental aerosols over a four-month period from 3 August–4 December 2006. To our knowledge, this represents the first multi-month am-bient measurement study involving an instrument for real-time bioaerosol detection using auto-fluorescence and also the first in a semi-urban environment.
2 Methods
2.1 UV-APS operating principles and conditions
An ultraviolet aerodynamic particle sizer (UV-APS; TSI Inc. Model 3314, St. Paul, MN) was utilized for this study following standard, manual-advised procedures. A detailed description of the instrument has been given elsewhere (Hairston et al., 1997; Brosseau et al., 2000), and so only a brief introduction is given here. Aerodynamic particle siz-ing in the diameter range (Da) of 0.54–19.81 µm (geometric
mid-point diameter) is performed in the instrument by mea-suring the time of flight between two red (633 nm) He-Ne lasers. Fluorescence of individual aerosol particles in the wavelength range of 420–575 nm is measured after excitation by a third ultraviolet laser (Nd:YAG) at 355 nm. The particle
counting efficiency of the instrument drops below unity at Da<0.7 µm (counting efficiency∼0.5 at 0.54 µm), thus
con-centration values reported for particles <0.7 µm should be considered as lower limit values. The instrument manufac-turer specifies the upper size limit of the UV-APS at 15 µm. Upon manufacturer calibration, however, polystyrene latex spheres (PSL, Duke Scientific) up to 20 µm, were prop-erly sized by the UV-APS, though possibly with lower ef-ficiency. As a result, particles detected between 15–20 µm are included in our analyses, but the reported concentra-tion values should again be considered as lower limit val-ues. Aerosol sampling was performed with a volumetric flow of 5 L min−1 (Lpm) at ambient pressure and temper-ature. Within the instrument, the total flow was split into an inner sample flow of 1.0±0.1 Lpm passing through the nozzle and optical measurement cell and a sheath flow of 4.0±0.1 Lpm (pressure difference feedback control). The flow rates were regularly checked with external flow meters (TSI Inc. Model 4140 Thermal Mass Flowmeter and Sensi-dyne Gilibrator-2). The inner and total volumetric flow rates stayed generally within the range of 1.0–1.1 Lpm and 4.9– 5.0 Lpm, respectively.
The instrument was controlled and the measurement data were recorded with an external computer connected via RS-232 ports using the manufacturer’s Aerosol Instrument Man-ager software (TSI AIM). Aerodynamic diameter, side scat-ter intensity, and fluorescence intensity measurements were recorded, initiated every 5 min and integrated over a sample length of 299 s. Sample measurements were continuously re-peated over a period of four months from 3 August to 4 De-cember 2006 (122 days, 34 270 data points) and only briefly interrupted for maintenance procedures (usually<30 min per week for flow check and nozzle cleaning as detailed in the in-strument manual). The Local Time (LT) used for data anal-ysis and all times reported here refer to Central European Summer Time (CEST) from the beginning of the reported measurements in August until 29 October, and thereafter to Central European Time (CET).
2.2 Measurement location and sampling
The UV-APS instrument was operated in a laboratory on the third (top) floor of the Max Planck Institute for Chem-istry (∼10 m above ground; eastward-facing location), which is located on the campus of the Johannes Gutenberg Uni-versity in Mainz, Germany (49◦59′31.07′′N, 8◦14′14.64′′E;
European mixtures of air from a metropolitan area and from a rural background region.
The UV-APS instrument was placed next to a window in-side the laboratory, through which ambient air was sampled using electrically-conductive silicon rubber tubing (length 1.6 m, inner diameter 12 mm, sample flow residence time
∼2 s). Flow through the tube was considered laminar at all times, and so diffusion losses are considered negligible for all sampled particle sizes. From the instrument inlet on top of the UV-APS the sampling tube was smoothly bent through the window to minimize particle losses due to impaction (curvature radius∼1 m). It is possible that the sampled air masses were influenced by dynamics involving the building structure, though no evidence of this was observed.
2.3 Data processing and analysis
Kanaani et al. (2007) reported that all viable bioaerosols (“with endogenous metabolites”) they tested were recorded by the UV-APS as having fluorescence in channels 2 and above. Agranovski et al. (2004b), however, sug-gested that non-fluorescent background aerosols tested also exhibited fluorescence in channel 2. In the present study we calculated number size distributions of flu-orescent aerosol particles, dNF/dlogDa, for each size
bin from the sum of the particle number concentra-tions from fluorescence channels 3–64, and we calcu-lated the total particle size distributions dNT/dlogDa,
from channels 1–64. For comparison we also calculated dNF/dlogDa using channels 2–64 as illustrated in
supple-mental Figs. S2–S4: http://www.atmos-chem-phys.net/10/ 3215/2010/acp-10-3215-2010-supplement.pdf. These show the enhancement of dNF/dlogDa is strongly size dependent
(Fig. S4), decreasing from a factor of 3.4 at 0.6 µm to a factor of 1.1 at 20 µm. As a result, by excluding fluorescence chan-nel 2 we expect to obtain a reasonable estimate and avoid over-counting the abundance of FBAPs, which in turn can be regarded as an approximate lower limit for the atmospheric abundance of PBAPs. Whether the fluorescent bioparticles are indeed viable is less well understood and needs to be fur-ther addressed as discussed below. The integrated number concentration of coarse fluorescent particles (NF,c>1 µm)
calculated by including fluorescence channel 2 is on average 1.5 times higher than the integratedNF,cexcluding
fluores-cence channel 2 (Fig. S3a).
Some fraction of non-biological aerosol particles, includ-ing soot, PAHs, and cigarette smoke (Pan et al., 1999) exhibit fluorescence and could be erroneously counted as FBAPs by this technique. This is most likely to occur at small (<1 µm) particle sizes where contribution from anthropogenic parti-cles from combustion sources is dominant (Okada and Mat-sunum, 1974). If, for example, only a very small amount (e.g. 0.1%) of a non-biological particle mode with peak of 100 cm−3 at 0.75 µm exhibited fluorescence, a peak of 0.1 cm−3 would appear in the fluorescent particle number
distribution. This peak may often be large enough to appear as a distinct peak in the distribution of fluorescent particles (Sect. 3.2). To investigate the contribution of non-biological particles that are counted by this technique (only considering fluorescence channels>3) the correlations between the in-tegrated number concentrations of fluorescent particles (NF)
and total particles (NT) were plotted separately for particles
less than 1.0 µm and greater than 1.0 µm (Fig. S5). The cor-relation of the submicron particles is systematically linear (R2=0.51, 34 270 data points), with most outliers grouped as individual particle events, whereas the correlation of the supermicron particles is more random (R2=0.17). Super-micron primary biological particles are likely to have dif-ferent sources and suspension mechanisms from the major-ity of the anthropogenic source-dominated submicron parti-cles observed in this semi-urban location. As a result, cor-relation ofNF withNT indicates that a large percentage of
submicron particles exhibiting fluorescence may have an-thropogenic sources, but this is not the case for supermi-cron particles. Similar correlations were also performed for smaller cut sizes. Goodness of fit values for these correla-tions increased with decreasing cut size, indicating an in-creasing influence of anthropogenic sources for submicron particles (e.g., Fig. S6 with R2=0.86 for submicron parti-cles<0.723 mm).
To avoid/minimize interference with non-biological fluo-rescent particles and for simplicity, therefore, we focus our analysis here on coarse particles (>1 µm), and we exclude fine particles (<1 µm) from the discussion of integral num-ber concentrations. Accordingly, we take the integral numnum-ber concentration of fluorescent particles larger than 1 µm,NF,c,
as the concentration of coarse FBAP. Similarly,NT,crefers to
the total integral number concentration of particles detected by the UV-APS larger than 1 µm. Particle mass size distri-butions (dM/dlogDa) were calculated for each size channel
by multiplication of dN/dlogDawith the volume of an
aero-dynamically equivalent sphere with the geometric midpoint diameter (Da,g) assuming a density of 1 g cm−3and a shape
factor of 1. Integral mass concentrations of coarse FBAPs (MF,c) and total coarse particles (MT,c) were also calculated
by integration of particle mass>1 µm, though these should be taken as a first approximation as a result of unknown par-ticle density and shape. Comparison of UV-APS measure-ments with filters analyzed with SEM-EDX from Amazonia show similar trends in PBAP size distribution as well as in number and mass concentration, suggesting that, under cer-tain conditions, the UV-APS FBAP measurement has no sig-nificant bias with respect to PBAP (P¨oschl, Sinha, Martin, et al., 2010).
101 N
100
m
-3 )
(a) August
101 N
100
m
-3) (b) September
10-3 10-1 10 F,cN
/
N
T,c
10-4 10-2
NF,c
(c
m
8
10
2 0 0.04 0.08 0.12
NF,c
NF,c / NT,c
dNF/dlogDa (cm
-3
) 10
-3
10-1 10 F,cN
/
N
F,c
10-4 10-2
NF,c
(c
m
8
10
2 0 0.04 0.08 0.12
8/1 8/8 8/15 Date 8/22 8/29
6 8
1
2 4 6 8
Da
(
μ
m)
9/1 9/8 9/15 Date 9/22 9/29
6 8
1
2 4 6 8
Da
(
μ
m)
0 0
10-3 10-1 101F,cN
/
N
T,c
10-4 10-2 100
NF,c
(cm
-3 )
2 0 0.04 0.08 0.12
(c) October
10-3 10-1 101F,cN
/
N
T,c
10-4 10-2 100
NF,c
(cm
-3)
2 0 0.04 0.08 0.12
(d) November
10/1 10/8 10/15 Date 10/22 10/29
6 8
1
2 4 6 8
10
Da
(
μ
m)
11/1 11/8 11/15 Date 11/22 11/29
6 8
1
2 4 6 8
10
Da
(
μ
m)
10/1 10/8 10/15 Date 10/22 10/29 11/1 11/8 11/15 Date 11/22 11/29
Fig. 1.Time series of fluorescent biological aerosol particle concentrations. Panel upper left: Integrated total coarse FBAP number (NF,c),
green markers. Panel upper right: Number ratio of integrated coarse FBAP to TAP (NF,c/NT,c), black markers. Panel lower half:
Size-resolved measurements (dNF/dlogDa) for each 5-min sample over entire measurement period:(a)August,(b)September,(c)October, and
(d)November (extending to 4 December).
0.78 for IT-RLC. Correlations between FBAP concentration and each of these parameters were also observed, but very weak (R2=0.0004, 0.07, and 0.004 for IT, UVP, and RLC, respectively). We, therefore, suggest that it is important to monitor and consider these parameters for UV-APS oper-ation and comparison of measurement data from different campaigns and instruments. It is possible that the absolute value of the FBAP signals could be affected by such instru-mental parameters under certain conditions, but size distri-butions, trends and the main conclusions of this study are unlikely to be affected.
For the interpretation and scaling of size distribution data and plots (Sect. 3.2) we have calculated the limit of detec-tion for concentradetec-tions measurable in each size channel of the UV-APS. These results are shown in the SOM.
3 Results and discussion
3.1 Particle number and mass concentrations
3.1.1 Overview of number concentrations
To our knowledge, no other time series of bioaerosol mea-surements with such high time and size resolution extending over a similarly long period have been reported previously. Thus, we first outline characteristic features of the time series
(Figs. 1, S7) in a general way to help the reader gain an overview of the observed concentration levels, trends, and variability before moving on to a more formal statistical treatment of the data (Fig. 2) and more detailed size-resolved analysis. Figure 1 shows time series of FBAP number con-centrations and size distributions measured with the UV-APS for each month of the study.
Through-out the measurement period the total coarse par-ticle number concentration, NT,c exhibited highly variable
large spikes and strong diel (24-h) and day-to-day varia-tions. Background concentrations consistently dropped to <0.4 cm−3between morning peaks during most of the cam-paign, and the highest total particle number concentrations were observed in November, with daily peaks above 8 cm−3. In contrast to total particles, the FBAP number concentration, NF,c, exhibited less pronounced spikes and showed more
consistent diel and day-to-day behavior. The highestNF,c
concentrations were observed in late October, with maxima up to 0.85 cm−3. The relative contribution of FBAP to TAP number, NF,c/NT,c showed similar temporal behaviour to
NF,c, but with more pronounced extremes due to the
vari-ability of the total number of coarse particles. In general, NT,c andNF,c/NT,c were inversely correlated, but with
rel-atively high scatter: asNT,cincreases,NF,c/NT,cdecreases.
5
4
(a) NT,c
Mean Median
0.1
0.08
(b) NF,c
0.12
0 09
(c) NF,c / NT,c
3 2 1 NT,c (c m -3) Median 0.06 0.04 0.02 NF,c (c m -3) 0.09 0.06 0.03 NF, c / NT, c 1 0
Aug Sep Oct Nov Campaign
0.02
0
Aug Sep Oct Nov Campaign
0
Aug Sep Oct Nov Campaign
Fig. 2.Statistical distribution of integrated coarse TAP and FBAP number concentrations (1–20 µm) measured during each month (August–
November) and over the full campaign as box-whisker plots. Black dot represents arithmetic mean, red bar represents median (50th per-centile), lower and upper limits of blue box represent 25th and 75th percentiles, respectively. Horizontal bars at the end of lower and upper
vertical bars represent 5th and 95th percentiles, respectively.(a)NT,c,(b)NF,c,(c)NF,c/NT,c.
6 m -3) 8 6 N F,
(a) August 6
m -3) 8 6 N F, (b) September 4 2 0 NF,c (1 0
-2 c
m
4
2
0
c /
N T,c (%) 6 8 10 2 ) 80x10-3 60 40 20 0
dNF/dlogDa (cm
-3
) N
F,c
NF,c / NT,c
4 2 0 NF,c (1 0
-2 c
m
4
2
0
c /
N T,c (%) 6 8 10 2 ) 40x10-3 30 20 10 0 24 20 16 12 8 4 0 6 8 1 2 4 Da ( μ m 24 20 16 12 8 4 0 6 8 1 2 4 Da ( μ m 6
) (c) October 8 ) 6 (d) November 8
4 2 0 NF,c (1 0
-2 cm -3) 6 4 2 0 N F,c / N T,c (%) 8 10 2 60x10-3 50 40 30 20 10 0 (c) October 4 2 0 NF,c (1 0
-2 cm -3) 6 4 2 0 N F,c / N T,c (%) 8 10 2 60x10-3 50 40 30 20 10 0 (d) November 24 20 16 12 8 4 0 6 8 1 2 4 6 Da ( μ m) 24 20 16 12 8 4 0 6 8 1 2 4 6 Da ( μ m)
Hour of Day Hour of Day
Fig. 3.Diel cycles of FBAP number concentrations and size distributions for each month of the measurement period (hourly median values
vs. local time of day). Panel top halves: Integrated coarse FBAP concentration (1–20 µm,NF,c) on left axis (green) and FBAP fraction
of TAP number (NF,c/NT,c)on right axis (black). Panel bottom halves: FBAP size distribution with hour of day on x-axis, aerodynamic
diameter on y-axis and color scale of dNF/dlogDawith white values set to<0.001 cm−3for visual clarity. Dashed black line at 1.0 µm
shows particle size cut-off below which fluorescent particles were not considered FBAP due to interference with non-biological aerosol.
Light-green shaded area shows FBAP concentration variability as the area between 25th–75th percentile traces.(a)August,(b)September,
(c)October, and(d)November.
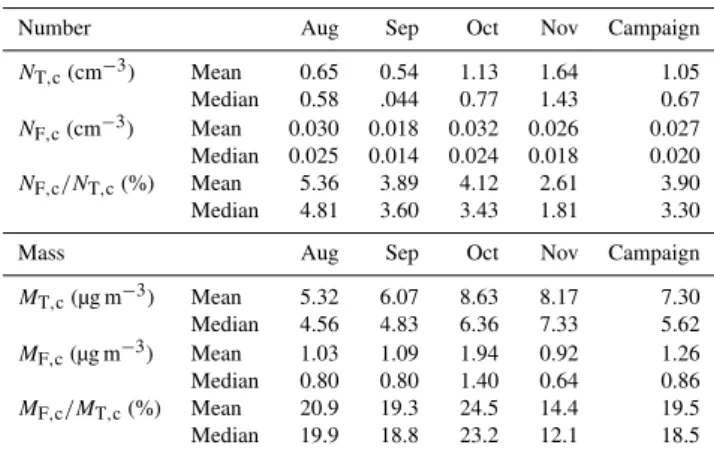
Statistical distributions of five-minute number concentra-tion measurements over the course of the campaign are shown in Fig. 2 and tabulated in Table 1. The monthly mean ofNT,cvaried by a factor of∼3 over the course of the
mea-surement period, from a minimum in September to a maxi-mum in November. The months of October and November showed not only higher meanNT,cvalues, but also higher
rel-ative variability, reflected in the size of the 5–95th percentile bars in Fig. 2. The mean values ofNF,cshowed more
consis-tency, however. September’s lowNF,c(0.018 cm−3) was the
only monthly mean value outside the relatively narrow mean range of 0.026–0.032 cm−3.
Table 1. Integrated number concentrations(a)and mass
concen-trations(b)of coarse TAP and FBAP (1–20 µm): arithmetic mean
and median for each month (August–November) and for the entire measurement campaign (3 August–4 December 2006).
Number Aug Sep Oct Nov Campaign
NT,c(cm−3) Mean 0.65 0.54 1.13 1.64 1.05
Median 0.58 .044 0.77 1.43 0.67
NF,c(cm−3) Mean 0.030 0.018 0.032 0.026 0.027
Median 0.025 0.014 0.024 0.018 0.020
NF,c/NT,c(%) Mean 5.36 3.89 4.12 2.61 3.90
Median 4.81 3.60 3.43 1.81 3.30
Mass Aug Sep Oct Nov Campaign
MT,c(µg m−3) Mean 5.32 6.07 8.63 8.17 7.30
Median 4.56 4.83 6.36 7.33 5.62
MF,c(µg m−3) Mean 1.03 1.09 1.94 0.92 1.26
Median 0.80 0.80 1.40 0.64 0.86
MF,c/MT,c(%) Mean 20.9 19.3 24.5 14.4 19.5
Median 19.9 18.8 23.2 12.1 18.5
Diel patterns of NT,c are very distinct from those of
NF,c (supplemental Figs. S11–S12). The size-resolved
dNT/dlogDa over the four months of measurement
consis-tently shows a dominant peak at<1.0 µm during night-time hours. The diel cycles of TAPs in (semi-) urban environ-ments are usually governed by boundary layer mixing effects and anthropogenic emissions (Garland et al., 2008, 2009). This may explain the strong early morning (04:00) TAP peak in August that gradually shifts later in the morning and be-comes less distinct. The diel cycles of FBAPs, however, are clearly different from those of TAP sources, and variability of FBAP sources seems to dominate over boundary layer mix-ing effects. Steep increase in FBAP concentrations observed in the morning after sunrise may suggest that a combination of high relative humidity and sunlight enhances the emission from bioaerosol sources (Elbert et al., 2007). Correlations of meteorological parameters with TAP and FBAP were per-formed and show a qualitative increase inNF,cwith relative
humidity, but with variable time offset and low correlation coefficient. No statistically significant correlation was found with wind direction. Further statistical analysis will be per-formed in follow-up studies, but are beyond the scope of this work.
Overall, the results show that FBAPs account for a small but significant fraction (typically∼3–4%, at most ∼15%) of total coarse aerosol particle number in the investigated size range (1–20 µm), and they indicate that the sources and sinks of FBAPs are less variable than those of other types of aerosol particles in Central Europe. These findings sup-port earlier suggestions that bioaerosols may be regarded as the natural background aerosol over vegetated continental re-gions (Jaenicke, 2005; Andreae, 2007; Jaenicke et al., 2007; Andreae and Rosenfeld, 2008; Martin et al., 2009).
103
M
F,c
/
1
101
μ
g /
m
3 ) (a)
10-1 101
M
T,
c (%)
10-3 10-1
MF,c
(
μ
MF c
dMF/dlogDa(μg / m3)
6
10
2
m
)
4 3 2 1 0
F,c
MF,c / MT,c
F g a(μg )
(b)
1
2 4
Da
(
μ
m
8/1 8/15 8/29 9/12 9/26 10/10 10/24 11/7 11/21 12/5
Date
6
Fig. 4.Time series of FBAP mass concentrations and size
distribu-tions for the entire measurement period.(a)Integrated coarse FBAP
mass concentration (1–20 µm,MF,c) on left axis (green) and FBAP
fraction of TAP mass (MF,c/MT,c)on right axis (black). Note that
axes are logarithmically scaled and off-set from one another. Each
data point represents a five-minute measurement. (b)FBAP size
distribution with date on x-axis, aerodynamic diameter on y-axis,
and color scale of dMF/dlogDawith white values set to 0.1 µg m−3
for visual clarity. Dashed black line at 1.0 µm shows particle
size cut-off below which fluorescent particles were not considered FBAP due to interference with non-biological aerosol.
3.1.2 Overview of mass concentrations
Though the UV-APS fundamentally measures particle num-ber, the average mass of size-resolved particles can be es-timated as a first approximation by assuming unit density. Accordingly, we present here an overview of the estimated FBAP mass concentration over the course of the measure-ment period. Figure 4 shows the integrated total coarse par-ticle mass (MF,c), the fraction of integrated FBAP mass to
TAP mass (MF,c/MT,c), as well as a time series of
size-resolved measurements (dMF/dlogDa). Figures similar to
Fig. 4, each with a range of one month are shown in supple-mental Fig. S13 in order to view temporal trends with more precision.
MT,c (Figs. S14–S15) exhibited a pattern of large
fluc-tuations and frequent (several times per week) large peaks (>25 µg m−3) on top of a relatively clean background of
between 1–4 µg m−3. M
F,c varied at constant background
of 0.51–1.49 µg m−3 (25–75th percentiles), also with
fre-quent spikes in concentration. The highest background of MF,c rose 9–28 October when levels rarely dropped below
0.8 µg m−3and peaked>40 µg m−3at least daily from 25– 27 October. Temporal trends in MF,c are only poorly
re-flected inMF,c/MT,c, as the ratio is qualitatively dominated
byMT,c.MF,c/MT,cvaried within a range of 11–27% µg m−3
20
15
(a) MT,c
Mean Median
4 (b) MF,c
0.5
0.4
(c) MF,c / MT,c
15
10
5
MT,c
(
μ
g / m
3)
Median
3
2
1
MF,
c
(
μ
g /
m
3)
0.3
0.2
0.1
MF,
c
/
MT,
c
0
Aug Sep Oct Nov Campaign
0
Aug Sep Oct Nov Campaign
0.1
0
Aug Sep Oct Nov Campaign
Fig. 5.Statistical distribution of integrated coarse TAP and FBAP mass concentrations (1–20 µm) measured during each month (Aug–Nov)
and over the full campaign as box-whisker plots (plots analogous to Fig. 2):(a)MT,c,(b)MF,c,(c)MF,c/MT,c.
Statistical distributions of five-minute mass concentration measurements over the course of the campaign are shown in Fig. 5 and tabulated in Table 1. The monthly mean val-ues ofMT,c exhibited lower relative variability, but similar
temporal trends asNT,c, with a general increase through the
course of the measurement months. The monthly mean val-ues ofMF,c showed similar relative variability asMT,c and
NF,c, except in October when both mean MF,c values and
relative variability were significantly higher. Similar to the trend inNF,c/NT,c,MF,c/MT,cshows a gradual decrease over
the course of the four months measured, with highMF,c in
October causing the only outlier. The mean values are only marginally higher than the median values for MF,c/MT,c,
indicating relatively low temporal variability. The median and mean for MF,c/MT,c over the course of the campaign
were 18.5 and 19.5%, respectively. On average, the rela-tive contribution of FBAP to TAP coarse particle mass was
∼5 times larger than its contribution to coarse particle num-ber (∼3.9%). This is consistent with the observation that FBAPs show enhanced prevalence among large aerosol par-ticles (3–10 µm), as shown and discussed in Sect. 3.2.
Diel trends inMF,c were also analyzed and are shown in
Fig. 6 for the entire campaign and in supplemental Fig. S16 for each individual month. Figure 6 shows that the low-estMF,c values occurred at night, with a temporally broad
increase in MF,c from ∼05:00–14:00 and a maximum at
08:00 (1.17 µg m−3). The overall trend of night-time lows with peak in mid-morning is similar to dielNF,c trend, but
MF,c shows a greater relative increase from diel minimum
to maximum compared withNF,c (66% and 79%,
respec-tively), and the morning MF,c peak is temporally broader
and extends later in the day. MF,c/MT,cexhibited a
tempo-ral trend similar toMF,c, but less pronounced and showed
relatively minor diel variability (minimum 14.7%, maximum 20.5%). The size-resolved diel trend ofMF/dlogDawas also
similar toNF/dlogDa in that a mid-morning peak of
inter-mediate size (∼5 µm for particle mass distribution) heav-ily influences the trend in overall integrated coarse cle mass. Though relatively few in particle number, parti-cles between 7–9 µm are consistent through day-light hours (∼07:00–17:00), however, and are the largest contributors to MF,c at those times. As was also the case for NF/dlogDa,
2
1.5
1
g
/ m
3 )
30
20
M
F,
c /
M
1
0.5
0 MF,c
(
μ
g
10
0
M
T,c
(%)
2
2 0 1 5 1 0 0 5 0
dMF/dlogDa (μg / m3) MMF,c
F,c / MT,c
4 6 8
10
μ
m)
2.0 1.5 1.0 0.5 0
8
1
2
Da
(
μ
24 20 16 12 8 4 0
Hour of Day
6
Fig. 6.Diel cycles of FBAP mass concentrations and size
distribu-tions for the entire measurement period (hourly median values vs.
local time of day). (a)Integrated coarse FBAP concentration (1–
20 µm,MF,c) on left axis (green) and FBAP fraction of TAP mass
(MF,c/MT,c) on right axis (black).(b)FBAP mass size distribution
with hour of day on x-axis, aerodynamic diameter on y-axis, and
color scale of dMF/dlogDawith white values set to 0.04 µg m−3for
visual clarity. Dashed black line at 1.0 µm shows particle size cut-off below which particles were not considered FBAP due to inter-ference with non-biological aerosol. Light-green shaded area shows FBAP concentration variability as the area between 25th–75th per-centile traces. Sharp cut-off in mass concentration above 10.5 µm is due to counting statistics and use of median values in this plot (i.e., above this size more than 50% of 5 L sample volumes contained no FBAP).
103
N
F,c
100
m
-3) (a) Period 1: 13 Aug 01:08 - 10:03
0.25
(b) Mean
Median
10-1
101
/
N
T,
c (%)
10-4
10-2
NF,c
(c
m
4 0 0.04 0.08 0.12
NF,c
NF,c / NT,c
dNF/dlogDa (cm-3)
0.2
0.15
o
g
D
a (cm
-3)
Median 25 - 75th Percent. 5 - 95th Percent.
6 1
2 4 6 10
2
Da
(
μ
m)
0.1
0.05
0
d
NF
/dl
o
12:00 AM 8/13
6:00 AM 12:00 PM 6:00 PM
Date 6
1
103
N
F,c
/
N
T
10-2
100
,c
(c
m
-3) (c) Period 2: 2 Sept 18:40 - 3 Sept 06:45
0
5 6 7 8 9
1 2 3 4 5 6 7 8 910 2
Da (μm)
0.25
0 2
(d) Mean
Median 25 - 75thPercent
10-1
101
T
,c (%)
10-4
NF
,
2 4
)
0.12 0.08 0.04 0
NF,c
NF,c / NT,c
dNF/dlogDa (cm-3)
0.2
0.15
0.1
F
/dlog
D
a (cm
-3)
25 75 Percent. 5 - 95th Percent.
12:00 PM 6:00 PM 12:00 AM 6:00 AM
6 1
2 4 6 10
Da
(
μ
m
)
0.05
0
d
NF
5 6 7 8 9
1 2 3 4 5 6 7 8 910 2
12:00 PM 9/2
6:00 PM 12:00 AM
9/3
6:00 AM Date
1 10
Da (μm)
Fig. 7.Characteristic FBAP number size distribution patterns observed during exemplary periods #1 and #2. Left panels show time series
ofNF,c, NF,c/NT,c ratio and dNF/dlogD on days of interest (analogous to Fig. 1), and black vertical lines indicate time periods over
which exemplary size distributions were averaged (dNF/dlogDa vs.Da, right panels). Red traces represent mean values, green traces
represent median values, dark gray regions show 25–75th percentile range, and light gray regions show 5–95th percentile range. Hatched area below 1.0 µm indicates particle size range where fluorescent particles were not considered FBAP due to interference with non-biological
aerosol. Black traces are lognormal fits to individual peaks (mean values) with the following fit parameters: (a)–(b)Period #1; Fit 1.1:
Da=0.54–0.90 µm, Da,g=0.74 µm,σg=1.10, N=6.5×10⁻³cm−3; Fit 1.2: Da=1.7–5.8 µm; Da,g=3.2 µm,σg=1.22, N=2.7×10⁻²cm−3;
(c)–(d)Period #2; Fit 2.1:Da=1.8–5.8 µm;Da,g=3.0 µm,σg=1.43,N=3.7×10⁻²cm−3.
3.2 Size-distributions of particle number and mass
3.2.1 Exemplary particle size distributions
Figure 1 shows that FBAPs withDa≈3 µm were nearly
ubiq-uitous during the campaign. The FBAP peak at ∼3 µm exhibits a clear diel cycle (Fig. 3), but rarely disappears completely. In addition to this peak, a variety of other FBAP peaks were frequently observed for varying lengths of time. Out of a wide range of different patterns and peaks in dNF/dlogDaobserved during the campaign, four
characteris-tic modes of FBAP were most commonly found and clearly distinguishable. The peak diameters of these modes were typically around∼1.5 µm,∼3 µm,∼5 µm,∼13 µm, respec-tively. In the following section we highlight exemplary pe-riods and size distributions illustrating characteristic features and the variability of the most commonly observed patterns and peaks in dNF/dlogDa.
Figure 7a–b (exemplary period #1) illustrate the most fre-quently observed individual peaks in the dNF/dlogDa
dis-tribution, with maxima at 3 µm and 0.7 µm. As discussed in Sect. 2.3, the submicron peak in dNF/dlogDa is likely
due to fluorescent particle components from anthropogenic sources (soot/PAHs from combustion sources). As shown
in the SOM (Fig. S17), the total aerosol particle distribution dNT/dlogDaobserved during exemplary period #1 exhibits a
much higher peak at the same diameter, and the ratio between dNF/dlogDaand dNT/dlogDaatDa=0.7 µm is similar to the
near-constant proportion of fluorescent submicron particles observed throughout the campaign (∼0.1%, Fig. S5). Ac-cordingly, we do not consider this and other submicron peaks in dNF/dlogDaas characteristic for FBAP and exclude them
from all further analysis and discussion. With regard to the FBAP peak observed atDa≈3 µm, period #1 provides a
rel-atively narrow example (nearly monodisperse withσg∼1.2)
that may consist of particles from the same or similar sources (e.g., spores from similar types of fungi). In many other cases we observed broader peaks that seemed to comprise two or more types of FBAPs with slightly different diame-ters (Figs. S18–S19) or overlapped with other characteristic modes that are like to have originated from different sources and biological species.
103
N
F,c
100
m
-3) (a) Period 3: 13 Sept 08:57 - 13:37
0.16
0 14 (b)
Mean
10-1
101
/
N
T,
c (%)
10-4
10-2
NF,c
(c
m
4 0 0.04 0.08 0.12
NF,c
NF,c / NT,c
dNF/dlogDa (cm-3)
0.14
0.12 0.1
0.08
o
g
D
a (cm
-3 )
Mean Median 25 - 75th Percent. 5 - 95th Percent.
6 1
2 4 6 10
2
Da
(
μ
m)
0.06
0.04 0.02
0
d
NF
/dl
o
12:00 AM 9/13
6:00 AM 12:00 PM 6:00 PM 12:00 AM
9/14 Date
6 0
5 6 7 8 9
1 2 3 4 5 6 7 8 910 2
Da (μm)
1
103
N
F,c
/
N
T
10-2
100
,c
(c
m
-3) (c) Period 4: 17 Aug 07:04 - 07:39
0.5
0 4
(d) Mean
Median 25 - 75thPercent
10-1
101
T
,c
(%)
10-4
NF
,
2 4
)
0.12 0.08 0.04 0
NF,c
NF,c / NT,c
dNF/dlogDa (cm-3)
0.4
0.3
0.2
F
/dlog
D
a (cm
-3 )
25 75 Percent. 5 - 95th Percent.
12:00 AM 6:00 AM 12:00 PM 6:00 PM 12:00 AM
6 1
2 4 6 10
Da
(
μ
m
)
0.1
0
d
NF
5 6 7 8 9
1 2 3 4 5 6 7 8 910 2
12:00 AM 8/17
6:00 AM 12:00 PM 6:00 PM 12:00 AM
8/18
Date 1 Da (μm) 10
Fig. 8. Characteristic FBAP number size distribution patterns observed during exemplary periods #3 and #4 (plots analogous to Fig. 7).
(a)–(b)Period #3; Fit 3.1: Da=3.0–7.2 µm; Da,g=4.4 µm, σg=1.14, N=1.0×10⁻²cm−3; (c)–(d)Period #4; Fit 4.1: Da=0.84–1.7 µm;
Da,g=1.2 µm,σg=1.18,N=4.0×10⁻²cm−3; Fit 4.2:Da=2.1–4.4 µm;Da,g=2.8 µm,σg=1.19,N=2.8×10⁻²cm−3.
bursts of FBAPs extended over only a few minutes or hours (Fig. 8c–d, Fig. S18). Figure 8a–b (exemplary period #3) illustrate a situation where the FBAP mode around∼5 µm was not just overlapping with, but much more pronounced than the∼3 µm mode. In this case the peak near 5 µm is exceptionally narrow, suggesting particles from the same or similar sources as discussed above. In most other cases, the peaks around∼5 µm were broader (Fig. S18) and likely com-posed of particles from a variety of different sources. Fig-ure 8c–d (exemplary period #4) illustrate a situation where a narrow peak at∼1.1 µm dominates the FBAP size distri-bution. This pattern was uniquely observed over a 35 min period on 17 August. The small particle size and the short duration suggest that the∼1.1 µm peak consisted of single bacterial cells from a nearby source. It occurred in paral-lel to a narrow peak at∼3 µm, but the temporal evolution of the two peaks was very different. The peak at∼3 µm was present before and persisted beyond the short-term burst of the one-micron-sized FBAPs.
Figure 9a–d (exemplary periods #5 and #6) show FBAP size distributions with a distinct and narrow peak at∼13 µm that appeared on 10 October and persisted until 29 October. Most likely the∼13 µm peak is due to pollen grains from a nearby tree (<20 m away) that was blossoming during this exceptionally warm period in October 2006. In the rele-vant size range (12–17 µm), the FBAP peak (pollen grains) also dominated the total aerosol particle concentration and size distribution with FBAP/TAP ratios in the range of 60– 100% (25–75th percentile, mean 73%). Figure 9 also shows
that the size resolution and sensitivity of the UV-APS are sufficient for separating and quantifying different types of FBAPs independent of the varying concentrations of TAP (and non-biological fluorescent particles <1 µm). Supple-mental Fig. S20a–d show that FBAP peaks around∼1.5 µm,
∼3 µm and∼5 µm were often detectable even during periods of very low aerosol concentration levels.
3.2.2 Average size distributions
The number and mass size distributions for both TAPs and FBAPs averaged over the whole campaign are shown in Fig. 10. The TAP number size distribution dNT/dlogDawas
generally dominated by a peak at the lower end of the inves-tigated size range (Da≈0.7 µm, Fig. 10a; monthly averages
in Fig. S21). Note that this “peak” is likely due to a steep decrease in the UV-APS detection efficiency for small par-ticles atDa<0.7 µm; otherwise the distribution would likely
increase to the lowest size bin and peak at a size below that which the UV-APS can detect. Supplemental Fig. S22 shows the campaign meanNT/dlogDasize distribution with a
log-arithmic y-axis in order to resolve characteristic features at the low values of dNT/dlogDaobserved at large diameters.
For example, a shoulder at∼3 µm can be attributed to the corresponding FBAP peak inNF/dlogDa.
The campaign and monthly average size distributions of fluorescent aerosol particles, dNF/dlogDa, are shown in
103
N
F,c
100
m
-3) (a) Period 5: 14 Oct 20:16 - 15 Oct 5:31
0.4
(b) Mean
Median 10-1 101 / N T,
c (%)
10-4
10-2
NF,c
(c
m
4 0 0.04 0.08 0.12
NF,c
NF,c / NT,c
dNF/dlogDa (cm-3)
0.3 0.2 o g D a (cm -3 ) Median 25 - 75th Percent. 5 - 95th Percent.
6 1 2 4 6 10 2 Da ( μ m) 0.1 0 d NF /dl o 12:00 PM 10/14
6:00 PM 12:00 AM
10/15
6:00 AM 12:00 PM
Date
6 0
5 6 7 8 9
1 2 3 4 5 6 7 8 910 2
Da (μm)
1 103 N F,c / N T 10-2 100 ,c (c m
-3) (c)Period 6: 11 Oct 07:01 - 14:51
0.3
0.25
(d) Mean
Median 25 - 75thPercent
10-1 101 T ,c (%) 10-4 NF , 2 4 ) 0.12 0.08 0.04 0 NF,c
NF,c / NT,c
dNF/dlogDa (cm-3)
0.2 0.15 0 1 F /dlog D a (cm -3 )
25 75 Percent. 5 - 95th Percent.
12:00 AM 6:00 AM 12:00 PM 6:00 PM 12:00 AM
6 1 2 4 6 10 Da ( μ m ) 0.1 0.05 0 d NF
5 6 7 8 9
1 2 3 4 5 6 7 8 910 2
12:00 AM 10/11
6:00 AM 12:00 PM 6:00 PM 12:00 AM
10/12
Date 1 Da (μm) 10
Fig. 9. Characteristic FBAP number size distribution patterns observed during exemplary periods #5 and #6 (plots analogous to Fig. 7).
(a)–(b)Period #5; Fit 5.1: Da=0.54–0.96 µm;Da,g=0.74 µm,σg=1.14, N=2.7×10⁻¹cm−3;(c)–(d)Period #6; Fit 6.1: Da=2.1–5.4 µm;
Da,g=3.0 µm,σg=1.22,N=3.3×10⁻²cm−3; Fit 6.2:Da=12.0–14.9 µm;Da,g=13.0 µm,σg=1.04,N=1.30×10⁻³cm−3.
160 140 120 100 m -3 ) Mean Median 25 - 75th Percent. 5 - 95th Percent.
(a) TAP Number 50
40
/ m
3 )
(b) TAP Mass
100 80 60 40 d NT /dlog D
a (c 30
20 10 d MT /dlog D a ( μ g 20 0
5 6 7 8 9
1 2 3 4 5 6 7 8 910 2
Da (μm)
0
5 6 7 8 9
1 2 3 4 5 6 7 8 910 2
Da (μm)
0.2
(c) FBAP Number 8 (d) FBAP Mass
0.15 0.1 o g D a (cm -3 ) ( ) 6 4 g D a ( μ
g / m
3 ) ( ) 0.05 0 d NF /dl o
5 6 7 8 9 2 3 4 5 6 7 8 9 2
2 0 d MF /dlo g
5 6 7 8 9 2 3 4 5 6 7 8 9 2
5 6 7 8 9
1 2 3 4 5 6 7 8 910 2
Da (μm)
5 6 7 8 9
1 2 3 4 5 6 7 8 910 2
Da (μm)
Fig. 10. Average particle number and mass size distributions for the entire measurement period. Red traces represent mean values, green
traces represent median values, dark gray regions show 25–75th percentile range, and light gray regions show 5–95th percentile range. Hatched area below 1.0 µm indicates particle size range where fluorescent particles were not considered FBAP due to interference with
non-biological aerosol. Black traces are lognormal fits to individual peaks with the following fit parameters:(a)TAP number (dNT/dlogDa):
FitNT-1: Da=0.54–1.3 µm;Da,g=0.74 µm,σg=1.20, N=5.3 cm−3, (b)TAP Mass (dMT/dlogDa);(c)FBAP Number (dNF/dlogDa); Fit
NF-1(mean): Da=0.58–1.0 µm;Da,g=0.76 µm,σg=1.13,N=2.0×10⁻³cm−3; FitNF-2 (mean): Da=2.0–6.7 µm;Da,g=3.2 µm,σg=1.33,
0.2
0.15
m
-3 )
(a) August 0.2
0.15
m
-3 )
(b) September
0.1
0.05
d
NF
/dlog
D
a (c
0.1
0.05
d
NF
/dlog
D
a (c
0
5 6 7 8 9
1 2 3 4 5 6 7 8 910 2
Da (μm)
0
5 6 7 8 9
1 2 3 4 5 6 7 8 910 2
Da (μm)
0.2
(c) October 0.2 (d) November
0.15
0.1
o
g
D
a (cm
-3 )
( )
0.15
0.1
o
g
D
a (cm
-3 )
( )
0.05
0
d
NF
/dl
o
5 6 7 8 9 2 3 4 5 6 7 8 9 2
0.05
0
d
NF
/dl
o
5 6 7 8 9 2 3 4 5 6 7 8 9 2
5 6 7 8 9
1 2 3 4 5 6 7 8 910 2
Da (μm)
5 6 7 8 9
1 2 3 4 5 6 7 8 910 2
Da (μm)
Fig. 11. Average FBAP number size distributions for each month of the measurement period (plots analogous to Fig. 10): (a)August,
(b)September,(c)October,(d)November.
and is not considered characteristic for biological particles, as discussed above. The campaign average size distribu-tion was dominated by an FBAP peak at ∼3 µm, and in the monthly averaged size distributions of August and Oc-tober this peak was even narrower and more intense. In the monthly averaged size distributions of September and November, however, the peak was substantially broader and the maximum was shifted towards higherDa, indicating the
presence of different and more diverse types of FBAP. A small mode at ∼1.5 µm is present in the mean FBAP dis-tribution as well as in each monthly plot. Lastly, an FBAP mode at∼13 µm can be seen in the mean FBAP number dis-tribution. As discussed previously, this mode was small in number concentration, but was almost completely comprised of FBAP material.
The size distributions of TAP mass were much broader than those weighted by number and also differed in the fact that they exhibited several more distinct local maxima. The campaign mean TAP mass distributions (Fig. 10b) looked generally similar to each of the constituent months (Fig. S23) with a distinct peak at 0.8 µm, a broad peak with two local maxima centered between 3–8 µm, and an upward slope at particle diameters above∼12 µm. During August, Septem-ber and NovemSeptem-ber the same four peaks were observed in the TAP mass distribution as in the campaign mean. In October an additional peak at 13.8 µm was also observed, showing what are likely pollen particles observed during the month of October and of high enough relative abundance to con-tribute noticeably to the month-average TAP mass distribu-tion. The highest concentration at each of the two dominant
TAP mass peaks were in November, when the monthly mean was 0.36 and 0.31 µg m−3for the 0.84 and 3.05 µm peaks,
respectively.
3.2.3 Ratio of fluorescent bioparticles to total particles
Taking a ratio of the number of FBAPs (dNF) and TAPs
(dNT) in each size bin allows the determination of the
rel-ative contribution of biological particles at each particle size. As discussed previously, the density of each particle was as-sumed to have a value of unity. This determines that the value of the dNF/dNT ratio is equal to dMF/dMT by
defi-nition, though this is not the case for integratedNF/NT and
MF/MTvalues. For observed particles of diameter less than
2.5 µm, the dNF/dNTratio was less than 10% for an average
of the entire measurement period (Fig. 12) and for each individually-averaged month (Fig. S25), indicating that rela-tively few of these small particles were FBAPs. Mean ratio curves show two local maxima, consistently located at simi-lar particle diameters of 3.8–4.7 µm and 9.0–10.4 µm, respec-tively. The peaks are more distinct in the August and Septem-ber averages, while for OctoSeptem-ber and NovemSeptem-ber the mean ra-tio curves appear closer to being a broad single peak between 3 and 12 µm. The first clear peak in the dNF/dNTdistribution
remained relatively constant in size during the measurement period (4.4–4.7 µm) and monthly mean values show that the peak represented a range of 23–32% FBAP material. The second peak in the dNF/dNTdistribution that can be clearly
seen in each of the four months showed slightly more FBAP material: August (38%, 10.4 µm), September (34%, 9.0 µm), and November (31%, 9.6 µm). The October peak at∼10 µm was obscured by an additional large peak at∼13 µm and was therefore more difficult to quantitatively determine. This∼3 week-long particle event produced a relatively sharp peak at 12.9 µm in the October average, with 62% of the parti-cles as being FBAPs. A period from 6–7 August also shows a high percentage (>60%) of FBAP atDa 11–15 µm,
indi-cating that, while the large particle peak in October was the most pronounced, other periods also indicate FBAPs in this size range. The counting statistics, as discussed in the pre-vious section, are poor for the detection of large particles (>∼8 µm), and therefore median values often reflect the fact that particle of this size were often not present in>50% of the sampled 5 L volumes. The mean (red) curve, therefore, best represents the dNF/dNTratios at the upper particle sizes.
Further example of this is that the light gray shaded area be-tween the 5th and 95th percentile curves covers the entire ra-tio from 0–100% at all particle diameters greater than∼7 µm and that the median value goes to zero at∼10 µm for each month.
The ratio of the size distributions averaged over the en-tire measurement campaign (Fig. 12) show similar trends to each of the individual months. Three local maxima are ap-parent, at aerodynamic particle diameters of 4.70, 9.65, and 13.8 µm. Even though the particles of diameter greater than 13 µm were almost exclusively present only within the month of October, the month’s large peak at these sizes heavily in-fluences the 4-month average (Fig. 10a). As a way of remov-ing the very local point source durremov-ing October, the average
1.0
Mean
0.8
0 6
T
Mean Median
25 - 75th Percent.
5 - 95th Percent.
0.6
0.4
d
NF
/ d
NT
0.2
0 0 0.0
5 6 7 8 9
1 2 3 4 5 6 7 8 910 2
Da (μm)
Fig. 12.Average size distribution of the FBAP to TAP number
con-centration ratio (dNF/dNT) for the entire measurement period (plot
analogous to Fig. 10).
contribution of FBAP to TAP number and mass over this four-month measurement period was also calculated with the period of 10–29 October removed. The ratio plot is shown in Fig. S26 for comparison, and shows a similar pattern to Fig. 12, but without the sharp peak at 13.8 µm.
4 Summary and conclusions
In this exploratory study we investigated the capability of a UV-APS operated continuously in Mainz, Germany over the 4-month period of August–November 2006 to quantify the concentration and size of FBAPs as an approximate lower limit of biological aerosol particles in semi-urban continen-tal boundary layer air. For this purpose, time series of the in-tegrated coarse particle number and mass concentrations, as well as particle mass and number size distributions of both total particles and fluorescent biological aerosols from the campaign were analyzed. Great variations in coarse particle number and mass concentrations (1–20 µm) as well as signifi-cant temporal variability of size distributions (using 5-minute measurement points) were observed. Over the course of the measurement period the coarse particle number concentra-tion of FBAPs varied in the range of 1.2×10⁻³–1.4 cm−3, with an arithmetic mean value of 0.027 cm−3(±0.026 cm−3, standard deviation). These accounted for 0.09–67% (mean value 3.9%±2.8%) of the total coarse particle number con-centration. The coarse particle mass concentration of FBAPs varied in the range of 4×10⁻³µg m−3 to 123 µg m−3, with
an arithmetic mean value of 1.3 µg m−3(±2.0 µg m−3). The coarse particle mass of FBAPs accounted for 0.067–92% (mean value 20%±11%) of total coarse particle mass con-centrations.
number concentrations of total PM to be 0.6–3.0 cm−3(16–
20%) (2000), and of coarse PM to be 1.9 cm−3(30%) (1995).
Jaenicke et al. (2005, 2007) report 1–3 cm−3 (3–50% of
coarse PM) in Mainz, Germany and 0.1–1 cm−3(15–30%) in Lake Baikal, Russia and in a related study that 20% of continental PM (>2 µm) and 9% of marine PM was PBAP (Gruber et al., 1999). Sanchez-Ochoa et al. (2007) re-port plant matter to have concentrations in various Euro-pean and N. Atlantic locations to be 0.03–0.36 µg m−3, cor-responding to 6–22% of PM mass. Bauer et al. (2002a, b, 2003, 2008) report Austrian fungal spore concentrations of
∼2×10⁻²cm−3 and 2.6 µg m−3, corresponding to 40% of coarse PM (∼2–10 µm) (2008), 10% of coarse Organic Car-bon (OC) from cloud water (2002a), and 2.9–5.4% of the coarse OC (2002b), as well as measured bacteria concen-trations of 8×10⁻⁶CFU m−3(colony forming units) (2003).
A review by Burrows et al. (2009b) suggests that bacte-rial concentrations typically exceed 1×10⁻²cm−3over land
area. Graham et al. (2003) suggest that coarse aerosol from Amazonia was predominantly PBAP, of which fungal spores represented almost all of the 2.3×10⁻¹cm−3 at night and
∼90% of the 2.6×10⁻²cm−3 during the day. Wiedinmyer et al. (2009) report PBAP to be 40% of PM10 OC in high
alpine Colorado using off-line fluorescence. And recent stud-ies report ∼40% of coarse particle number above tropical rainforest canopies are FBAP (Gabey et al., 2009; Huff-man, Garland, P¨oschl et al., 2010). Note, however, that FBAP measurement results from different instruments uti-lizing laser-induced fluorescence for detection of biological aerosol may differ depending on instrumental design and pa-rameters. Most other bioaerosol measurement techniques are also limited by statistical and systematic uncertainties and will require further validation. Nevertheless, the results ob-tained with different techniques are largely consistent.
The observed FBAP size distribution from the measure-ments presented here alternated between periods exhibiting from one to four peaks at particle diameters>= 1 µm. The temporal variability of peaks in the FBAP size distribution is not surprising in view of the high diversity in type and fre-quency of occurrence of bacteria and fungal spores detected by microscopy, cultivation and molecular genetic analyses of air particulate matter (Wittmaack et al., 2005; Despr´es et al., 2007; Elbert et al., 2007; Fr¨ohlich-Nowoisky et al., 2009). After experimentally investigating trends in FBAP size dis-tributions, however, the FBAP peaks reported here can be broadly classified into four FBAP modes. The most common mode was observed around ∼3 µm as the dominant FBAP peak in both number concentration and frequency, consistent with observations by Artaxo and Hansson (1995) who noted a dominant PBAP mode at∼3 µm in samples collected in the Amazon Basin, Brazil. An average of the UV-APS study in Mainz shows a strong diel cycle to the∼3 µm peak with a maximum in the mid-morning at∼07:00 after the sun came up and a constant background throughout the rest of the day. This mode is likely due to fungal spores, whose mechanism
for release may be some combination of elevated relative hu-midity and sunlight. This general pattern is consistent with a morning peak in total fungal spore and bacteria concentra-tions as recently measured in an urban area of Egypt (Abdel-Hameed et al., 2009). The additional FBAP modes ob-served over the four months of measurements can be grouped around∼1.5 µm, ∼5 µm, and ∼13 µm. The smallest mode was likely caused by individual bacterial cells or agglomer-ates and was most often observed at ∼1.5 µm, though the peak of this mode varied between 1.1–1.8 µm. The∼5 µm mode encompasses a variety of peaks observed at different times, though rarely was it seen as a monodisperse peak or set of peaks. Peaks in this region were most often broad and not lognormally distributed, but often distinct from the 3 µm peak. The least frequent of the commonly observed mode was a∼13 µm peak observed for three weeks in Octo-ber. Though the peak exhibited low absolute concentration (<2×10⁻³cm−3), the relative fraction of FBAP to TAP
dur-ing this period and size range averaged 73% and often ranged to 100%. These particles were very likely pollen grains re-leased from a nearby blossoming tree. Lognormal fits of se-lected FBAP peaks were performed in order to provide es-timates of characteristic PBAP modes for inputs for aerosol models. The observations that the relative fraction of FBAP to TAP was highest at large sizes is consistent with observa-tions by Kenny and Jennings (1998) that the fraction of bio-logical particles in marine aerosol was highest at∼3–18 µm. Provided that FBAP can be regarded as a proxy for viable PBAP, the observed size distributions also suggest that the number concentration of viable bioparticles is dominated by fungal spores of agglomerated bacteria (∼3 µm), rather than single bacterial cells (∼1 µm).
Table A1.List of frequently used acronyms and symbols.
Acronym/Symbol Unit Description
PBAP primary biological aerosol particle
FBAP fluorescent biological aerosol particle
FAP fluorescent aerosol particle
NAP non-fluorescent aerosol particle
TAP total aerosol particle (including fluorescent and non-fluorescent)
N cm−3 particle number concentration
NF cm−3 Nof fluorescent particles (fluorescence bins>3)
NF,c cm−3 Nof coarse fluorescent particles (Da,g1.037–19.81 µm, size bins 10–51);
taken as the number concentration of coarse FBAPs
NT cm−3 Nof all particles (TAPs, including fluorescent and non-fluorescent)
NT,c cm−3 Nof all coarse particles (coarse TAPs, including fluorescent and non-fluorescent)
M µg m−3 particle mass concentration
MF µg m−3 Mof fluorescent particles
MF,c µg m−3 Mof coarse fluorescent particles (Da,g1.037–19.81 µm, size bins 10–51);
taken as the number concentration of coarse FBAPs
MT µg m−3 Mof all particles (TAPs, including fluorescent and non-fluorescent)
MT,c µg m−3 Mof all coarse particles (coarse TAPs, including fluorescent and non-fluorescent)
Da µm aerodynamic particle diameter
Da,g µm geometric mean aerodynamic particle diameter (size bin or lognormal fit)
σg – geometric standard deviation of lognormal fit
Acknowledgements. J. A. H. and B. T. contributed equally to this work. This work has been supported by the Max Planck Society
and LEC-Geocycles Mainz, Germany. The authors gratefully
acknowledge support by M. O. Andreae, W. Elbert, V. Despr´es, J. Fr¨ohlich and A. G. Wollny.
The service charges for this open access publication have been covered by the Max Planck Society.
Edited by: J. Thornton
References
Abdel-Hameed, A. A., Khoder, M. I., Yuosra, S., Osman, A. M., and Ghanem, S.: Diurnal distribution of airborne bacteria and fungi in the atmosphere of Helwan area, Egypt, Sci. Total Environ., 407, 6217–6222, doi:10.1016/j.scitotenv.2009.08.028, 2009.
Agranovski, V., Ristovski, Z., Hargreaves, M., Blackall, P. J., and Morawska, L.: Performance evaluation of the UVAPS: in-fluence of physiological age of airborne bacteria and bacte-rial stress, J. Aerosol Sci., 34, 1711–1727, doi:10.1016/s0021-8502(03)00191-5, 2003a.
Agranovski, V., Ristovski, Z., Hargreaves, M., Blackall, P. J., and Morawska, L.: Real-time measurement of bacterial aerosols with the UVAPS: performance evaluation, J. Aerosol Sci., 34, 301– 317, doi:10.1016/s0021-8502(02)00181-7, 2003b.
Agranovski, V., Ristovski, Z., Blackall, P. J., and Morawska, L.: Size-selective assessment of airborne particles in swine confine-ment building with the UVAPS, Atmos. Environ., 38, 3893– 3901, doi:10.1016/j.atmosenv.2004.02.058, 2004a.
Agranovski, V., Ristovski, Z. D., Ayoko, G. A., and Morawska, L.: Performance evaluation of the UVAPS in measuring bio-logical aerosols: Fluorescence spectra from NAD(P)H coen-zymes and riboflavin, Aerosol Sci. Tech., 38, 354–364, doi:10.1080/02786820490437505, 2004b.
Agranovski, V. and Ristovski, Z. D.: Real-time monitoring of viable bioaerosols: capability of the UVAPS to predict the amount of individual microorganisms in aerosol particles, J. Aerosol Sci., 36, 665–676, doi:10.1016/j.jaerosci.2004.12.005, 2005. Andreae, M. O.: Aerosols before pollution, Science, 315, 50–51,
doi:10.1126/science.1136529, 2007.
Andreae, M. O. and Rosenfeld, D.:
Aerosol-cloud-precipitation interactions. Part 1, The nature and sources
of cloud-active aerosols, Earth-Sci. Rev., 89, 13–41,
doi:10.1016/j.earscirev.2008.03.001, 2008.
Ariya, P. A., Sun, J., Eltouny, N. A., Hudson, E. D., Hayes, C. T., and Kos, G.: Physical and chemical characterization of bioaerosols – Implications for nucleation processes, Int. Rev. Phys. Chem., 28, 1–32, doi:10.1080/01442350802597438, 2009. Artaxo, P. and Hansson, H. C.: Size Distribution of Biogenic Aerosol – Particles from the Amazon Basin, Atmos. Environ., 29, 393–402, 1995.