Ordered Disorder of the Astrocytic
Dystrophin-Associated Protein Complex in the Norm and Pathology
Insung Na1., Derek Redmon1., Markus Kopa1
, Yiru Qin1, Bin Xue1, Vladimir N. Uversky1,2*
1Department of Molecular Medicine, Morsani College of Medicine, University of South Florida, Tampa, Florida, United States of America,2Institute for Biological Instrumentation, Russian Academy of Sciences, Pushchino, Moscow Region, Russia
Abstract
The abundance and potential functional roles of intrinsically disordered regions in aquaporin-4, Kir4.1, a dystrophin isoforms Dp71, a-1 syntrophin, and a-dystrobrevin; i.e., proteins constituting the functional core of the astrocytic dystrophin-associated protein complex (DAPC), are analyzed by a wealth of computational tools. The correlation between protein intrinsic disorder, single nucleotide polymorphisms (SNPs) and protein function is also studied together with the peculiarities of structural and functional conservation of these proteins. Our study revealed that the DAPC members are typical hybrid proteins that contain both ordered and intrinsically disordered regions. Both ordered and disordered regions are important for the stabilization of this complex. Many disordered binding regions of these five proteins are highly conserved among vertebrates. Conserved eukaryotic linear motifs and molecular recognition features found in the disordered regions of five protein constituting DAPC likely enhance protein-protein interactions that are required for the cellular functions of this complex. Curiously, the disorder-based binding regions are rarely affected by SNPs suggesting that these regions are crucial for the biological functions of their corresponding proteins.
Citation:Na I, Redmon D, Kopa M, Qin Y, Xue B, et al. (2013) Ordered Disorder of the Astrocytic Dystrophin-Associated Protein Complex in the Norm and Pathology. PLoS ONE 8(8): e73476. doi:10.1371/journal.pone.0073476
Editor:Lukasz Kurgan, University of Alberta, Canada
ReceivedJune 21, 2013;AcceptedJuly 19, 2013;PublishedAugust 27, 2013
Copyright:ß2013 Na et al. This is an open-access article distributed under the terms of the Creative Commons Attribution License, which permits unrestricted use, distribution, and reproduction in any medium, provided the original author and source are credited.
Funding:The authors have no support or funding to report.
Competing Interests:Please note that the co-author Vladimir Uversky is a PLOS ONE Editorial Board member. This does not alter the authors’ adherence to all the PLOS ONE policies on sharing data and materials.
* E-mail: [email protected]
.These authors contributed equally to this work.
Introduction
It is recognized now that many biologically active proteins, known as intrinsically disordered proteins (IDPs), lack stable tertiary and/or secondary structure under physiological conditions in vitro[1–34]. They are highly abundant in nature, with,25–
30% of eukaryotic proteins being mostly disordered, and with
.50% of eukaryotic proteins and .70% of signaling proteins having long IDP regions (IDPRs) [35–39]. IDPs possess remark-able structural heterogeneity, ranging from completely structure-less, coil-like conformational ensembles to compact molten globule-like structural ensembles [33,40–42]. Furthermore, disor-der can affect proteins to a different degree, and some proteins are disordered as a whole, whereas other proteins possess a mosaic or hybrid structure containing both ordered and disordered regions [33,40–43]. Functional repertoire of IDPs/IDPRs is very broad and complements functions of ordered proteins and domains. Disorder-based functions may arise from the specific disorder form, from inter-conversion of disordered forms, or from transitions between disordered and ordered conformations [3,4,9,10,33]. Many IDPs/IDPRs possess an exceptional binding promiscuity often associated with the ability to fold in a template dependent manner, where a single IDPR can bind to multiple partners gaining very different structures in the bound state [28,44]. Often, IDPs are involved in regulation, signaling and control pathways, where binding to multiple partners and high-specificity/low-affinity interactions play a crucial role and where
IDPs/IDPRs play different roles in regulation of the function of their binding partners and in promotion of the assembly of supra-molecular complexes [1,3,5–7,14,15,19,24–28,33].
IDPs and IDPRs are the key players in various protein-protein interaction networks, being especially abundant among hub proteins and their binding partners [14,45–49]. Furthermore, regions of pre-mRNA which undergo alternative splicing com-monly encode for the IDRs [50]. This association of alternative splicing and intrinsic disorder helps proteins to avoid folding difficulties and provides a novel mechanism for developing tissue-specific protein interaction networks [32,50].
disorder-based binding sites known as molecular recognition features [74], that the majority of human plasma membrane proteins contain long disordered regions [75], and that the IDPRs from helical bundle integral membrane proteins, those from b-barrel integral membrane proteins, and IDPRs from water soluble proteins all exhibit statistically distinct amino acid compositional biases [76]. Although the multifarious functional roles of disorder in nuclear pore were reported [67,68,77], no other membrane-associated protein complexes were subjected to the detailed analysis focused at protein intrinsic disorder. To fill this gap, we report here a computational study on the abundance and roles of intrinsic disorder in five proteins (aquaporin-4, Kir4.1, Dp71,a-1 syntrophin, and a-dystrobrevin) that constitutes the membrane-bound astrocytic dystrophin-associated protein complex (DAPC).
The major function of dystrophin is to anchor the extracellular matrix to the cytoskeleton via the F-actin. In a classic view, dystrophin of skeletal and cardiac muscle associates with various proteins to form the dystrophin-associated protein complex (DAPC) [78]. However, DAPC is also positioned in the extracellular membrane of the astrocytic endfeet abutting the blood vessels [79], and it can be found at the neuromuscular junction (NMJ) and at a variety of synapses in the peripheral and central nervous systems where it has a structural function in stabilizing the sarcolemma [80]. The core of the astrocytic DAPC is composed of seven proteins (see Figure 1), an extracellular peripheral glycoproteina-dystroglycan, a transmembrane protein b- dystroglycan, two specific transmembrane channels, aquaporin-4 (AQP-aquaporin-4) and Kiraquaporin-4.1, and three cytosolically located proteins, such as a fifth isoform of dystrophin (Dp71), a-1 syntrophin (SNTA1), anda-dystrobrevin (DTN-A, also known as dystrophin-related protein 3)) [78,81]. The heterodimer of the a- and b-dystroglycans is the central DAPC components, where the a-dystroglycan interacts with the laminins in the basal lamina, and the transmembraneb-dystroglycan is involved in connecting the extracellular matrix to the cytoskeleton. The AQP-4 is an extremely important channel maintaining the osmotic balance of the blood-brain barrier (BBB) [82], whereas Kir4.1 acts as an inwardly rectifying K+ channel that has a role in potassium buffering [83]. The PDZ and SU domains of thea-1 syntrophin and other syntrophins are responsible for a set of the cross-protein contacts, interacting with AQP-4, Kir4.1, Dp71 and dystrobrevin-a [78]. A dystrophin isoform Dp71 is reported as an anchoring protein of AQP-4 and Kir4.1 [84,85]. a-Dystrobrevin is another DAPC component which connects proteins related to the complex in a fashion similar to Dp71 [78]. The structural and functional relationship between each of the members of the DAPC has been known for some time [78,81] (Figure 1). Since this study is focused on AQP-4, Kir4.1, Dp71, a-1 syntrophin, and a-dystrobrevin, these important DAPC components are briefly introduced below. The AQP-4 protein is associated with a number of human diseases, but most importantly with Neuromyelitits Optica (NMO). Also referred to as Devic’s disease, NMO is an inflammatory demyelinating disease that selectively affects optic nerves and spinal cord. In 2004, an Anti-AQP-4 antibody was discovered that had a significant impact on the diagnosis and understanding of the molecular NMO mechanisms. The discovery of an NMO disease-specific antibody, NMO-IgG [86], was fueled by the observation that immunoglobulin and complement deposition in active lesions followed a distinct rim and rosette vasculocentric pattern, suggesting an antibody-mediated mechanism of disease [86]. Later, the AQP-4 protein was identified as the NMO-IgG target [87].
Potassium channels play an important role in the DAPC signal transduction pathways suggesting that AQP-4 and potassium
channels, such as Kir4.1, might work together [83]. Here, AQP-4 likely acts in concert with potassium and bicarbonate channels to regulate water dynamics in the central nervous system (CNS) between the brain, blood, and cerebrospinal fluid (CSF). Overall, this cooperation plays an integral role in maintaining both brain fluid volume and ion homeostasis [88,89]. The clinical manifes-tations of NMO are comparable to those found in AQP-4 knockout mice, which implicates a correlation between AQP-4 and Kir4.1. In support of this implication is the subcellular co-localization of AQP-4 with the inwardly rectifying potassium channel Kir4.1 [90]. These results support the hypothesis that AQP-4 and Kir4.1 interact with each other [88–90].
The ATP-sensitive, inwardly rectifying potassium channel Kir4.1 is a protein that is encoded by the KCNJ-10 gene in humans [91]. It has the tendency to allow a greater extent of potassium to flow into the cell, rather than out. Potassium channels are found in various parts of the human body, but most notably in cardiac, liver, endothelial and neuronal cells. By carefully modulating the net potassium currents, Kir4.1 helps to maintain a resting membrane potential. The basic building blocks of the Kir4.1 channel are two transmembrane helices with cytoplasmic N- and C-termini and an extracellular loop which folds back to form the pore-lining ion selectivity filter [92]. Mutations of Kir4.1 can cause a number of symptoms including Epilepsy, Ataxia, Sensorineural deafness and Tubulopathy; these are collectively known East syndrome [93].
The next protein in the study is dystrophin, which is a product of the Duchenne Muscular Dystrophy (DMD) gene. More specifically we looked at the fifth isoform of dystrophin, known as Dp71 that constitutes the C-terminal domain of the dystrophin protein.DMDbeing one of the longest human genes, with a total length of,2.2 megabases, is located on the X chromosome. In its
mutant form, it is responsible for various myopathies [94–96], including Duchenne muscular dystrophy [97], Becker muscular dystrophy [98], X-linked dilated cardiomyopathy [99], and sporadic dilated cardiomyopathy [100]. Dystrophin is normally present within the sarcolemma of the skeletal muscle as part of a large protein complex which forms a linkage between the cytoskeleton, the sarcolemma, and the extracellular matrix [101]. TheDMDgene exhibits complex transcriptional regulation and drives the synthesis of a variety of dystrophin isoforms through utilization of different promoters. Full-length dystrophin (427 kDa) is derived from three independent promoters, located at the 59-end of theDMDgene, that regulate its spatiotemporal expression in muscles, brain structures, and cell types [102–104].
Another important DAPC protein is a-1 syntrophin. It is encoded by theSNTA1gene and acts as an adapter between the AQP-4 and Dp71 proteins by binding via its PDZ domain to the AQP-4 C-terminus. The PDZ domain ofa-1 syntrophin, which is the most abundant gene product in the heart, has been reported to bind to the C-terminal domain of the cardiac voltage-gated sodium channels (SkM2) causing alterations of the ion channel activity which causes long QT syndrome [105,106]. Long QT syndrome (LQTS) is an inborn, abnormal heart rhythm condition characterized by a delayed repolarization of the cardiac muscle, and can lead to dangerous episodes of arrhythmias, cardiac arrest, or even sudden death. LQTS can arise from mutations of one of several associated genes [105], and is inherited in either an autosomal dominant or autosomal recessive manner.
on the yeast two-hybrid (Y2H) analysis it has been concluded that a-dystrobrevin is involved in the direct heterodimerization with the dystrophin [107]. This is based on findings that suggest the C-terminus of dystrobrevin binds to the C-C-terminus of dystrophin. The gene that codes fora-dystrobrevin is calledDTNA. Mutations inDTNAare known to cause the left ventricular non-compaction type 1 (LVNC1) disease, which is defined by the presence of poor systolic function, and is sometimes associated with other cardiac abnormalities including atrial or ventricular septal defects [108].
In the overall analysis of the DAPC, we found that multiple proteins play significant roles in the formation of the complete, functional complex. Although many of their roles have yet to be elucidated, the physical interactions between these proteins have been studied in detail. Among other analyses, we looked for SNPs in regions that were specifically involved in the interactions between the DAPC proteins. We also looked at the entire amino acid sequences of these proteins to see where the most frequent single nucleotide polymorphisms (SNPs) occurred. In this way we wanted to connect the presence and occurrence of specific SNPs with the destabilization of the DAPC and also to find a potential correlation between such DAPC destabilization and the presence and/or duration of the epileptic seizures in humans. Through our study we have come to hypothesize that the amino acid composition, as well as mutations and variations within each protein’s amino acid sequence, affects the DAPC stability and therefore function. To verify this hypothesis, we identified the conserved amino acid sequences within the binding sites of the protein-protein interactions, as well as any mutations, single nucleotide polymorphisms (SNPs), and intrinsically disordered protein regions (IDPRs) related to the DAPC proteins. According to an earlier study emphasizing that the conserved motifs in IDPR
have serious impacts on protein function [109], we performed IDPR analysis of the important binding sites in each protein in order to find the conserved amino acid motifs. We also analyzed all available disease mutation and SNP data to cross check the effects that these types of variations have on the DAPC functions.
Results and Discussion
Intrinsic Disorder and Its Conservation within the DAPC Members
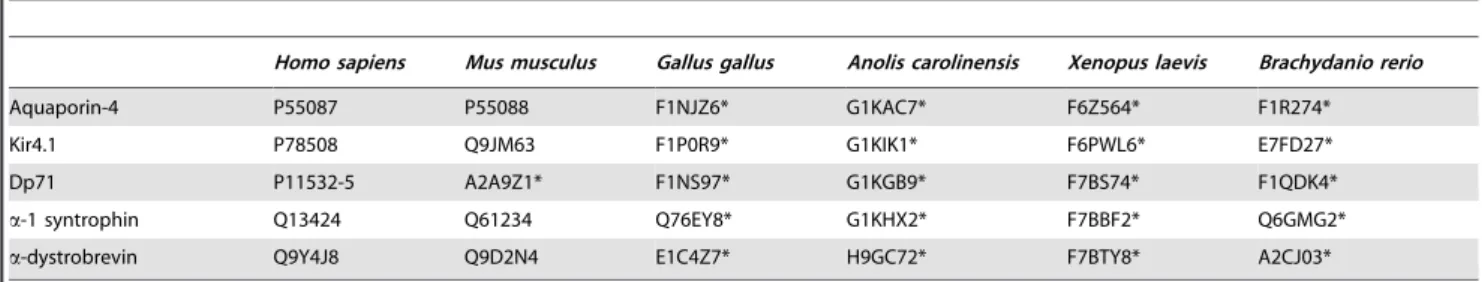
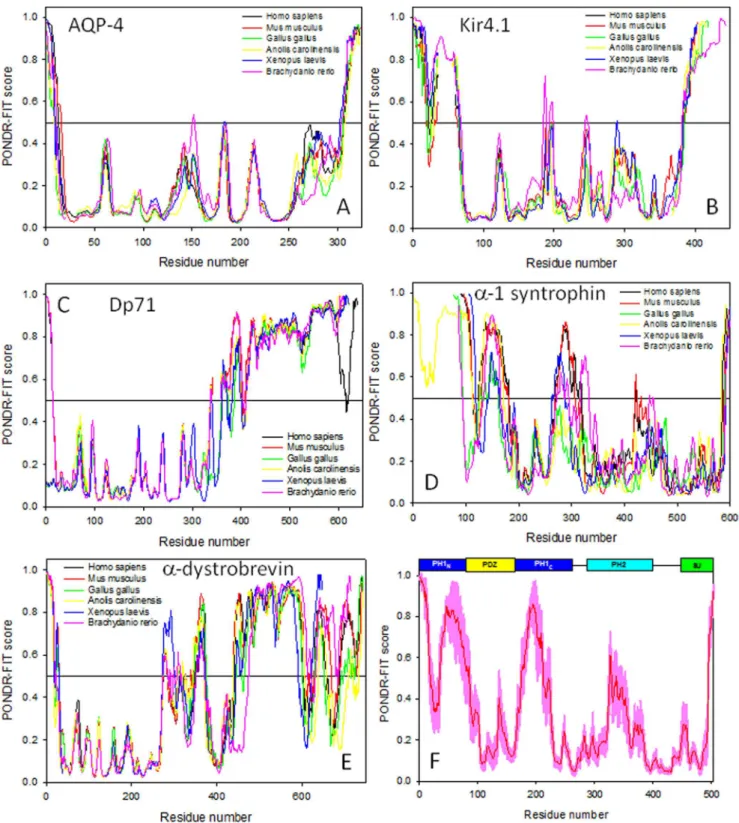
To understand the peculiarities of intrinsic disorder predispo-sitions of AQP-4, Kir4.1, Dp71, a-1 syntrophin, and a-dystrobrevin, we investigated the distributions of the predicted disorder propensity (in a form of the plots showing the per-residue PONDR-FIT scores produced by the PONDR-FIT disorder prediction algorithm) in these five DAPC proteins from selected vertebrates, such as mammals (Homo sapiensandMus musculus), bird (Gallus gallus), reptile (Anolis carolinensis), amphibian (Xenopus laevis), and fish (Brachydanio rerio). Table 1 lists the analyzed proteins together with their corresponding UniProt IDs (www.UniProt. org). Figure 2 represents the results of this analysis and shows that all five proteins from all the organisms analyzed in this study are typical hybrid proteins [43]; i.e., proteins possessing both ordered domains and variously disordered regions. Figure 2 shows that AQP-4 and Kir4.1 have similar disorder profiles with areas of high disorder at the N- and C-termini, and with the majority of sequences having disorder values between the 0.1 and 0.5, although in both proteins, there are a few areas which approach the 0.5 disorder threshold. The low abundance of disorder in AQP-4 and Kir4.1 is rather typical for the transmembrane proteins [76]. Also, disordered tails of transmembrane channels
Figure 1. Schematic representation of the astrocytic DAPC analyzed in this study.The major focus of our work was dystrophin (Dp71) and the Dp71-associated proteins AQP-4, Kir4.1,a-1 syntrophin (a-Snt), anda-dystrobrevin.
doi:10.1371/journal.pone.0073476.g001
are common points of channel regulation and interaction with other proteins. The disorder profile of Dp71 is quite different from the two transmembrane proteins. Though its N- and C-termini are highly disordered, as seems to be a common feature for all five proteins of interest, the Dp71 protein seems to be evenly split between ordered and disordered domains, with the first half of the protein falling in the 0.1–0.3 disorder range, while the second half falling in the 0.7–0.9 disorder range. Of course, the protein has little ‘‘spikes’’ of disorder in its area of order, and order in its area of disorder. Finally, the disorder profiles ofa-1 syntrophin and a-dystrobrevin possess somewhat more sporadic appearance con-taining multiple clusters of order and disorder.
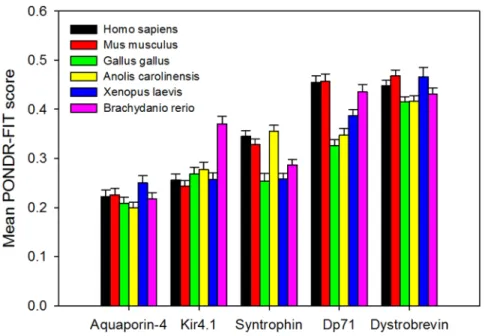
Looking at each plot globally, trends of order and disorder can still be seen. Here, the amount of predicted disorder among the various DAPC proteins increases in the following order: AQP-4,Kir4.1,a-1 syntrophin ,Dp71,a-dystrobrevin. Figure 3 further illustrates this conclusion by showing mean disorder scores evaluated for all analyzed proteins. Another interesting observa-tion is that for any given DAPC member, the overall appearance of the profiles of predicted disorder is rather conserved among various vertebrate species (see Figure 2). This finding suggests that both ordered and intrinsically disordered regions might play important roles in the functionality of the corresponding proteins.
Structural Characterization of the DAPC Proteins
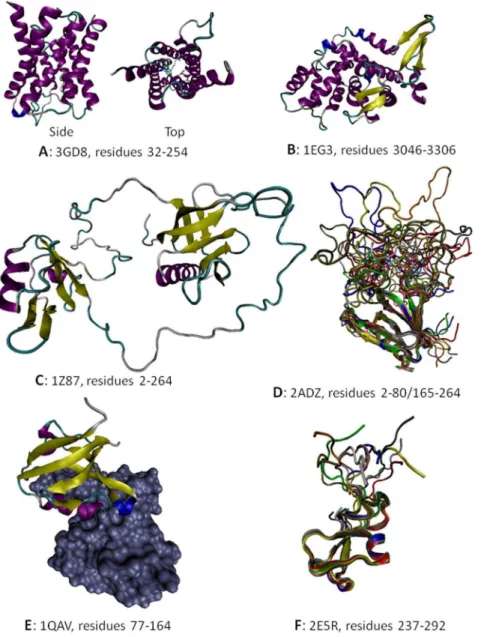
Figure 4 summarizes currently available information on the 3-D structures of proteins from the DAPC. Figure 4A represents side and top views of the structurally characterized domain of AQP-4 corresponding to the central 32–254 region, which is predicted to be mostly ordered (see Figure 2A). Despite the fact that the central region of Kir4.1 is expected to be mostly ordered (see Figure 2B), no structural information is available for this protein as of yet. Structure of a part of the C-terminally located fragment of dystrophin (residues 3046–3306) that roughly corresponds to the N-terminal half of Dp71 is shown in Figure 4B. Dp71 (622 residues) is the fifth isoforms of the human dystrophin produced by the alternative splicing. Dp71 differs from the canonical full-length protein (residues 1–3685) by lacking the first 3068 residues, missing the residues 3409–3421, having the residues KVPYYIN (3069–3075) changed to MREQLKG, and with the 3673–3685 region (residues RNTPGKPMREDTM) being changed and extended to HNVGSLFHMADDLGRAMESLVSVMTDEE-GAE. The crystallized fragment of human dystrophin includes the WW-domain (residues 3055–3088) and is clearly predicted to be mostly ordered (see region corresponding to the first 300 residues in Figure 2C).
Although structural information on humana-1 syntrophin is not available as of yet, the solution structure of the N-terminal domain of its mouse counterpart has been determined (see Figure 4C). It is known that all five members (a,b1,b2,c1, and
c2) of the syntrophin family share the same domain organization: an N-terminal split pleckstrin homology (PH) domain containing an embedded PDZ domain (PHN–PDZ–PHC), a central PH
domain, and a C-terminal syntrophin unique domain (SU) [110– 114]. In a moutha-1 syntrophin split PH-domain, the PHNhalf is
composed of threeb-strands (b1–b3), and the PHChalf contains
the remaining fourb-strands (b4–b7) and the C-terminala-helix. A well-folded PDZ domain and two long linkers are inserted at the b3/b4-loop of the PH domain. Figure 4C shows a solution structure of one of the members of the conformational ensemble of the PHN–PDZ–PHC module. Here, both PDZ and split
PH-domains are well-folded and separated by highly flexible linkers [114]. This shows that PHNand PHCfragments fold together to
form a canonical PH-domain structure containing sevenb-strands and one C-terminal a-helix, and that PDZ-domian does not interfere with this folding process. Interestingly, the individual PHNand PHCfragments are completely disordered in isolation
but fold into the canonical PH-domain, being mixed together [114]. When the PDZ-domain is taken out the PHN–PDZ–PHC
module and substituted by an eight-residue peptide linker (‘L’), the resultant PHN-‘L’-PHC construct is able to fold into a structure
indistinguishable from that of the joined PHN–PHCdomain within
the PHN–PDZ–PHCmodule (see Figure 4D) [114]. An interesting
feature of this structure is the presence of a highly flexibleb3/b4 loop. This structure provides further support to the notion that long flexible linkers are needed to ensure sufficient separation of the PDZ-domain from the halves of the split PH-domain thereby guarantying their ability to interact and mutually fold.
Finally, several crystal and NMR structures are available for the isolated PDZ-domain and for a complex of this domain with specific binding partners. Figure 4F shows one of these complexes were the PDZ-domain of the mouse a-1 syntrophin was co-crystallized with the neuronal nitric oxide synthase (nNOS) [115]. Importantly, these ordereda-1 syntrophin domains mostly match regions of predicted order in this protein whereas noticeable regions of predicted disorder corresponds to the flexible linkers connecting PHNto PDZ and PDZ to PHC(see Figure 2F).
As far as human a-dystrobrevin is concerned, this protein contains several functional domains, such as a region of interaction with the melanoma-associated antigen E1 (MAGEE1, residues 1– 288) that also contains a zinc finger domain of ZZ-type (residues 237–284), a syntrophin-binding region (residues 400–450) and a potential coiled-coil region (residues 46–556). The high abundance of intrinsic disorder within the C-terminal half ofa-dystrobrevin (Figure 2E) suggests that defining crystal structure of this protein could be a challenge. In agreement with this hypothesis, the structural information is only available for the zinc finger domain (residues 237–292, see Figure 4F). Interestingly, although this region is predicted to be disordered (see Figure 2E), it folds as a result of binding of two Zn2+ions (Figure 4F), as typically the case Table 1.Members of the dystrophin-associated protein complex (DAPC) analyzed in this study.
Homo sapiens Mus musculus Gallus gallus Anolis carolinensis Xenopus laevis Brachydanio rerio
Aquaporin-4 P55087 P55088 F1NJZ6* G1KAC7* F6Z564* F1R274*
Kir4.1 P78508 Q9JM63 F1P0R9* G1KIK1* F6PWL6* E7FD27*
Dp71 P11532-5 A2A9Z1* F1NS97* G1KGB9* F7BS74* F1QDK4*
a-1 syntrophin Q13424 Q61234 Q76EY8* G1KHX2* F7BBF2* Q6GMG2*
a-dystrobrevin Q9Y4J8 Q9D2N4 E1C4Z7* H9GC72* F7BTY8* A2CJ03*
Figure 2. Abundance of intrinsic disorder in proteins from six vertebrate DAPCs. A. AQP-4;B. Kir4.1;C. Dp71;D.a-1 syntrophin; andE. a-dystrobrevin. PONDR-FIT scores are shown for corresponding proteins fromHomo sapiens(black lines),Mus musculus(red lines),Gallus gallus(green lines),Anolis carolinensis(yellow lines),Xenopus laevis(blue lines), andBrachydanio rerio(pink lines). Disorder profiles were manually aligned by visual inspection to ensure matching of the most characteristic features. The number of gaps introduced in affected proteins during these visual alignments was kept to a minimum. PlotFrepresents a PONDR-FIT plot for humana-1 syntrophin. Domain structure of this protein is also indicated in relation to the disorder profile. Pink shadow around PONDR-FIT curve represents distribution of errors in the evaluation of the PONDR-FIT scores.
doi:10.1371/journal.pone.0073476.g002
for many other zinc-binding proteins and zinc-finger domains [21–23]. Both, MAGEE1-interacting region and syntrophin-binding region are predicted to be mostly ordered (see Figure 2E).
Intrinsic Disorder and Sequence Conservation Analysis of the Intersubunit Binding Sites
Since DAPC is formed and stabilized by a number of intersubunit interactions, the corresponding binding sites were next found based on the previously published experimental studies (see Table 2). At the next step, the found intersubunit binding sites of the DAPC members were subjected to the sequence conserva-tion analysis which revealed that these binding sites are well conserved in six vertebrate species, two mammals (Homo sapiens and Mus musculus), bird (Gallus gallus), reptile (Anolis carolinensis), amphibian (Xenopus laevis), and fish (Brachydanio rerio).
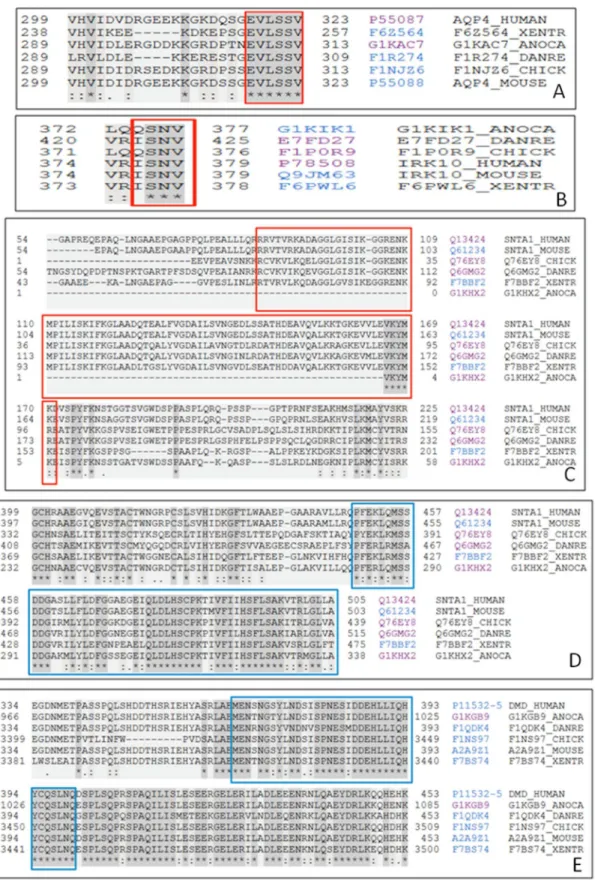
C-terminal sequences of AQP-4 and Kir4.1 each contains short highly conserved regions (the 319–323 fragment in human AQP-4 (residues VLSSV) and the residues RISNV at the position 377– 381 in human Kir4.1. These sequences are responsible for the AQP-4 and Kir4.1 interaction with the a-1 syntrophin PDZ-domain. Figure 2 shows that the PDZ-domain binding sites of both channels are located within their disordered C-terminal tails.
As it was mentioned above, human and mousea-1 syntrophins have similar domain organization. The human protein consists of an N-terminal split PH domain (residues 6–86 and 171–268) containing an embedded PDZ domain (residues 87–170), a central PH domain (residues 293–401), and a C-terminal SU-domain (residues 449–505). The PDZ domains ofa-1 syntrophin (residues 87–170 in human protein) are known to bind to the last three or four amino acids of ion channels and receptor proteins [116,117]. Evolutionary analysis revealed that the PDZ-domain of a-1 syntrophin as well as the PDZ-binding motifs of AQP-4 and Kir4.1 are highly conserved among vertebrates (see Figure 5).
The SU-domain ofa-1 syntrophin (residues 449–505 in human protein) is known to interact with specific segments of the Dp71 and a-dystrobrevin proteins [116,118,119]. This SU domainis mostly conserved among the vertebrates (Figure 5D). Significant
portion of the SU-domain, including its calmodulin-binding subdomain (residues 481–503 in human protein) [120], is predicted to be disordered (see Figure 2F).
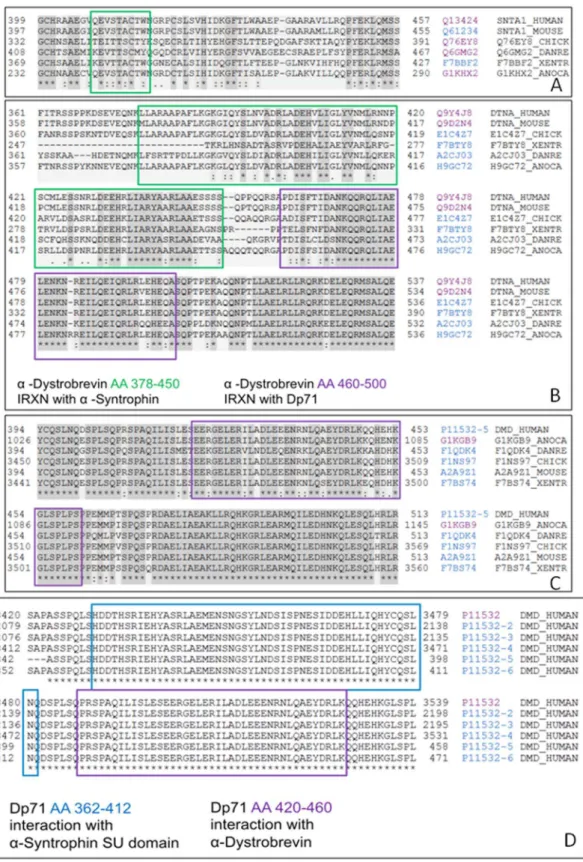
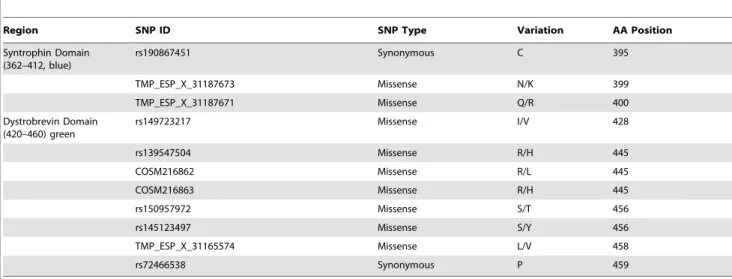
The portion of the molecule involved in binding to the a-1 syntrophin SU-domain spans amino acids 362–412. This interac-tive Dp71 segment, being mostly disordered (see Figure 2C), is highly conserved among vertebrates (Figure 5E). The interacting regions between a-1 syntrophin (residues 408–416) and a-dystrobrevin (residues 378–450) are also known [121,122]. Figure 2 suggests that although the a-1 syntrophin-interacting domain of a-dystrobrevin is located within the predominantly ordered region, the a-dystrobrevin-binding motif of a-1 syntro-phin is predicted to possess noticeable conformational flexibility (as indicated by its disorder scores noticeably deviating from 0.0). Curiously, conservation analysis revealed that the a-dystrobrevin-binding motif ofa-1 syntrophin possesses minimal conservation among different species (Figure 6A), whereas the mostly disordered a-1 syntrophin-interacting domain ofa-dystrobrevin showed more cross-species conservation (Figure 6B). Figure 2 shows that the interacting regions between the Dp71 (residues 420–460) and a-dystrobrevin (residues 460–500) are predicted to be highly disordered. Despite this fact, these intersubunit binding regions were shown to be highly conserved in the vertebrate species (see Figures 6B and 6C). Finally, since the Dp71 is one of the alternatively spliced isoforms of a canonical dystrophin, we analyzed the inter-isoform conservation of the dystrophin domains interacting with the SU-domain of a-1 syntrophin and with a-dystrobrevin and showed that these two binding domains are highly conserved among all the dystrophin DMD isoforms (Figure 6D).
Therefore, these analyses revealed that the intersubunit binding regions of the DAPC proteins are highly conserved. Importantly, our analysis also showed that in each interacting pair analyzed, at least one binding region involved in such intersubunit contacts was predicted to be intrinsically disordered. These results indicated that the DAPC proteins utilize highly conserved IDPRs for their intersubunit communications, thereby emphasizing the functional
Figure 3. Mean disorder scores evaluated for five DAPC proteins from six vertebrate species: Homo sapiens(black bars), Mus musculus(red bars),Gallus gallus(green bars),Anolis carolinensis(yellow bars),Xenopus laevis(blue bars), andBrachydanio rerio(pink bars).Error bars represent the corresponding standard errors.
Figure 4. Structural information on some members of the dystrophin-associated protein complex: A. Crystal structure of the human AQP-4 fragment (PDB ID: 3GD8, residues 32–254); B. Crystal structure of the human dystrophin fragment (PDB ID: 1EG3, residues 3046–3306). C. NMR solution structure of the mousea-1 syntrophin fragment (PDB ID: 1Z87, residues 2–264 that correspond to the PHN–
PDZ–PHCmodule).D. NMR solution structure of the mousea-1 syntrophin fragment (PDB ID: 2ADZ, residues 2–80/165–264 that correspond to the
PHN-‘L’-PHCconstruct). Ten representative members of the conformational ensemble are shown by chains of different color.E. Crystal structure of a
complex (PDB ID: 1QAV) between the PDZ domain of mousea-1 syntrophin (residues 77–164, shown as a colored chain) and the Neuronal nitric oxide synthase, nNOS (shown as gray surface).F. NMR solution structure of the fragment of humana-dystrobrevin (PDB ID: 2E5R, residues 237–292 that correspond to the ZZ-domain). Ten representative members of the conformational ensemble are shown by chains of different color. doi:10.1371/journal.pone.0073476.g004
Table 2.Intersubunit binding regions found in the DAPC members.
No. A: B Binding Site of A Binding Site of B Reference
1 AQP-4:a-1 syntrophin 319–323 PDZ (87–170) [90,126], UniProt
2 Kir4.1:a-1 syntrophin 375–379 PDZ (87–170) [90], UniProt
3 a-1 syntrophin: Dp71 SU (449–505) ‘Syntrophin Domain’ (362–412) [118,119], UniProt 4 a-1 syntrophin:a-dystrobrevin ‘Dystrobrevin Domain’ (408–426) ‘Dp71 Domain’ (378–450) [121,122], UniProt 5 a-dystrobrevin: Dp71 ‘Syntrophin Domain’ (460–500) ‘Dystrobrevin Domain’ (420–460) [107]
doi:10.1371/journal.pone.0073476.t002
Figure 5. Sequence conservation of the PDZ-binding motifs in AQP-4 (A) and Kir4.1 (B), and of thea-1 syntrophin PDZ-domain (C). Sequence conservation of thea-1 syntrophin SU domain (D) and of thea-1 syntrophin binding domain of Dp71 (E). In each plot, the position of the corresponding binding motifs and functional domains are highlighted as a colored rectangle.
Figure 6. Analysis of sequence conservation of the inter-subunit interaction sites in the DAPC. In each plot, the position of the corresponding binding motifs and functional domains are highlighted as a colored rectangle.A. Conservation of thea-dystrobrevin-interacting site ofa-1 syntrophin.B. Multi-domain sequence conservation analysis ofa-dystrobrevin (conservation of the domains interacting witha-1 syntrophin and Dp71). C. Conservation of the a-dystrobrevin-interacting domain of Dp71. D. Multi-domain sequence conservation analysis of Dp71 (conservation of the domains interacting with thea-1 syntrophin SU-domain anda-dystrobrevin).
doi:10.1371/journal.pone.0073476.g006
importance of intrinsic disorder in assembly of this important complex.
Predicted Intrinsic Disorder-Based Binding Sites in the DAPC proteins
We also analyzed the coincidence of known binding sites of various DAPC proteins with the potential binding sites predicted by two principally different computational tools for finding the disorder-based interaction features, the ANCHOR (http:// anchor.enzim.hu/) [123] and the MoRFpred (http://biomine-ws.ece.ualberta.ca/MoRFpred/ index.html) [124]. Results of this analysis are summarized in Table 3 which clearly shows that the majority of known binding sites are predicted by at least one of these computational tools. This finding provides further support to the idea that intrinsic disorder is important for the DAPC formation and stabilization, since many binding motifs of the DAPC proteins are located within the disordered regions. Also, it is obvious that there is some kind of disorder complementarity among binding sites, since when one interacting protein displays interaction-prone regions of intrinsic disorder, the binding site of its binding partner typically does not contain disorder. In this way, one protein acts as a donor, offering its intrinsically disordered region for binding, while the other protein acts as an acceptor, offering its more rigid region to complement the binding interaction.
Intrinsic Disorder and Diseases-Causing Mutations in the DAPC proteins
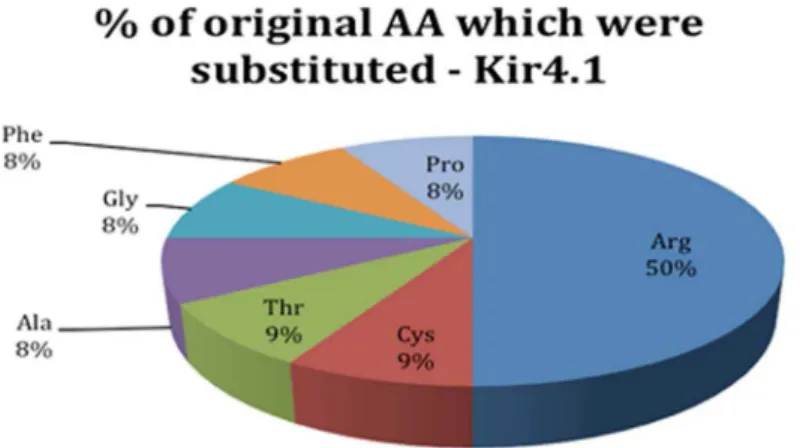
Next we analyzed the human DAPC proteins for the presence of mutations known to cause diseases. This analysis did not find reported mutations in the AQP-4 protein that were known to lead to disease phenotypes. However, twelve allelic variants were found in Kir4.1. Analysis of these mutations revealed that half of the allelic variants affected arginine (see Figure 7). The complete list of substitutions found in Kir4.1 and the positions at which they occurred are shown in Table 4. It is important to note that no disease-promoting mutations were found in the known binding site of Kir4.1 (amino acids 375–379).
Eleven disease-related mutations were identified in the Dp71-encoding gene DMD. In most cases, these mutations result in Duchenne muscular dystrophy (see Table 5). Six out of the eleven mutations were frame shifts downstream from either a Lysine or Leucine residue, causing the protein to be truncated. In addition, point mutations, which caused arginine to change into a stop codon, were observed three times at positions 122, 302 and 313. Interestingly, there were three frame-shift mutations, in thea-1 syntrophin binding site of Dp71, at positions 363, 404, and 411. Mutations of two of these positions (Leu363 and Leu404) lead to the frame shifts resulting in the Duchenne muscular dystrophy,
whereas the mutation of Ala411 was another frame-shift mutation that caused Becker muscular dystrophy.
The only disease-related mutation in thea-1 syntrophin is an A390V mutation which is linked to long QT syndrome 12. However, this mutation is positioned outside the PDZ- and SU-domains as well as outside the region that interacts with a-dystrobrevin. Finally, only one allelic variant (P121L) is known for a-dystrobrevin, which is also located outside any relevant binding sites.
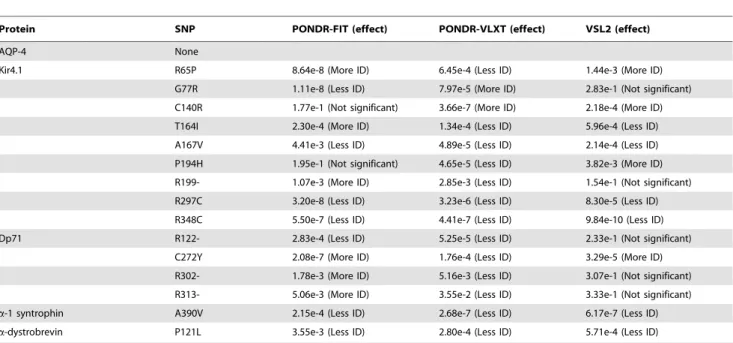
Because, intrinsic disorder is an important function-related feature, we analyzed whether the known SNPs can cause significant changes in the intrinsic disorder pattern of whole protein. To this end, a paired T-test between the wild type protein and each variant containing a single SNP was performed. Here, we analyzed the statistical significance of the single SNP effect on the disorder probabilities of proteins evaluated by PONDR-FIT, PONDRH VLXT, and PONDRH VSL2. Here, a paired T-test was applied to a pair of averaged per residue disorder scores calculated for the wild-type protein and variant and significance level of 0.05 was used to determine the statistical significance of the effect of a given SNP. Among numerous SNPs reported for each protein, only SNPs affecting binding sites and disease causing SNPs were considered. The analysis of SNPs affecting residues in the binding sites or binding domains revealed that the majority of such mutations caused the related protein to be less disordered than the corresponding wild type protein (i.e., the majority of SNPs resulted in some decrease in the overall disorder score of a corresponding protein) (Table 6). Here, among 40, 39 and 39 SNPs analyzed by PONDR-FIT, PONDRH VLXT, and PONDRH VSL2, there were 24, 29, and 25 SNPs, respectively, which were predicted to make whole protein to be less disordered. Similarly, the majority of disease-causing SNPs tend to change each protein to be less disordered than the corresponding wild type protein (see Table 7). Again, among 15-15-15 SNPs checked by PONDR-FIT, PONDRH VLXT, and PONDRH VSL2 algo-rithms, 7, 13 and 6 SNPs were predicted to decrease the mean disorder score of a corresponding protein. Importantly, there was no intersection between the SNPs in binding sites and disease causing SNPs. To further substantiate our conclusions, we also analyzed the effect of disease-causing SNPs located within the functional motifs and functional domains that are listed for the DACP members in the ELM (http://elm.eu.org/) and pFam (http://pfam.sanger.ac.uk/) databases. The corresponding data are listed in Table 8.
Our analysis revealed that although all five proteins contain multiple SNPs, disorder-based binding regions of these DAPC members are rarely affected by mutations. This observation suggests that the functional versatility of IDPRs in AQP-4, Kir4.1, Dp71,a-1 syntrophin, anda-dystrobrevin precludes these regions from being mutated, hence showing least number of mutations in them. However, it is also likely that mutations of individual
Table 3.Comparison of the ANCHOR and MoRFpred results with known binding site.
No. Protein ANCHOR MoRFpred Already known
1 AQP-4 None 319–323 319–323
2 Kir4.1 None 375–379 375–379
3 a-1 syntrophin 113–119, 129–135, 163–170 None 87–170, 449–505, 408–426 4 Dp71 362–401, 409–412, 420–460 387–395, 423–430, 442–449 362–412, 420–460 5 a-dystrobrevin 379–396, 406–416, 437–445 378–384, 434–442, 466–475, 477–480 378–450, 460–500
residues within the functional IDPRs of these proteins are well tolerated, since the evolutionary pressure may have shifted to maintaining global biophysical properties and structural mallea-bility of the IDPRs to safeguard the critical protein functions [125].
Visual Analyses of the Effects of SNPs on Protein Intrinsic Disorder Propensity
Going beyond the disease related mutations, further analysis was performed by looking at all available SNPs for each of the five proteins from the dystrophin-associated protein complex. As stated above, the Ensemble Genome Browser (http://useast.ensemble. org) was used to search for all SNPs related to the proteins in question. The total variation analysis of each gene showed that there were 2,775 SNPs for genes encoding for AQP-4, 730 SNPs for KCNJ-10 (Kir4.1), and 832, 2,563, and 2,427 SNPs fora-1 syntrophin, Dp71, and a-dystrobrevin, respectively. Only SNPs that corresponded to the actual amino acid substitutions in corresponding proteins were analyzed. Thus, any nonsense, non-coding, splice region, synonymous, 39or 59UTR variants, or any other type of variant that did not pertain to actual amino acid changes were omitted as this data related to areas of each protein transcriptome that would not impact the amino acid sequences of
the resulting protein forms. There were 242, 67, 81, 69, and 115 amino acid substitutions-inducing SNPs in AQP-4, Kir4.1, a-1 syntrophin, Dp71, anda-dystrobrevin, respectively.
The analyzed variations were broken down into an overall distribution of substitutions affecting polar and non-polar residues in each protein. Figure 8 shows which amino acids dominate the total polar and non-polar substitutions for each protein and gives insights into the likelihood of SNPs and related disorders being linked to specific amino acids, as some are much more common than others. These distributions also help to conceptualize the potential effects of substitutions and make a prediction on whether a given mutation can affect protein folding and functionality. For example, the addition of a polar or charged residue to a protein that is mostly non-polar and hydrophobic (such as AQP-4 or Kir4.1) could have drastic impacts on the ability of this protein to maintain both stability and function and therefore to interact with the conjugate proteins in the complex. It is this exact occurrence that is the focus of our study.
Figure 9 represents a series of scatter diagrams that show the frequencies of substitutions within the corresponding protein sequences. Here, a high frequency number means that a certain position within the protein has a high level of SNP occurrence. These diagrams give an idea of where in the sequence certain variations are prone to happen. One should keep in mind though that multiple variations at a certain point in a protein can generate
Figure 7. Frequencies of disease-related mutations in Kir4.1.
doi:10.1371/journal.pone.0073476.g007
Table 4.Disease-related amino acid substitutions in Kir4.1.
Original Substitution Position
Arg Pro 65
Arg Cys 65
Phe Leu 75
Gly Arg 77
Pro Leu 121
Cys Arg 140
Thr Ile 164
Ala Val 167
Arg His 194
Arg Ter 199
Arg Cys 297
Arg Cys 348
doi:10.1371/journal.pone.0073476.t004
Table 5.Disease-related amino acid substitutions in Dp71.
Original Effect AA Position
Ile Frame shift 89
Arg Termination 122
Arg Termination 122
Cys Substitution to Tyr 272
Arg Termination 302
Lys Frame shift 306
Arg Termination 313
Leu Frame shift 363
Leu Frame shift 404
Ala Frame shift 411
Leu Frame shift 414
doi:10.1371/journal.pone.0073476.t005
different residues. Areas of absence or abundance of points in these diagrams is a nice clue that can be linked to some other sequence specific features, such as distribution of intrinsic disorder propensities, thereby giving more insights in context of the overall stability/structure of the proteins of interest.
Specific SNPs are highlighted in each of these scatter plots to denote those that were present in specific binding regions. Different colors were used in order to distinguish between multiple binding regions present on a protein. All the different SNPs in
binding regions of these proteins are given in Tables 9–11 and are color coded to indicate the regions in which they occur. Note, that a plot for the Kir4.1 protein has two colors to highlight four specific SNP’s. While two SNPs (blue highlights, positions 375 and 376, Figure 9B) are associated with the actual binding region of this protein, the other two (red highlights, positions 26 and 199, Figure 9B) are SNPs resulting in gaining the stop-codons that lead to protein truncations. Therefore, these SNPs were considered important and included in the scatter plot for Kir4.1. The latter
Table 6.Paired T-test P-values of the SNPs in the intersubunit binding sites.
Protein SNP PONDR-FIT (effect) PONDR-VLXT (effect) VSL2 (effect)
AQP-4 V319I 1.72e-2 (Less ID) 1.62 e-3 (Less ID) 1.51e-9 (Less ID)
Kir4.1 R375H 7.88e-7 (Less ID) 1.26e-3 (Less ID) 1.90e-8 (Less ID)
Dp71 N399K 8.74e-9 (Less ID) 1.47e-6 (Less ID) 9.21e-8 (Less ID)
Q400R 7.57e-11 (Less ID) 4.76e-6 (Less ID) 2.18e-11 (Less ID) I428V 1.99e-7 (Less ID) 4.98e-7 (More ID) 2.84e-11 (Less IDP) R445H 1.65e-6 (Less ID) 3.98e-6 (Less ID) 4.41e-12 (Less ID) R445L 2.81e-10 (Less ID) 4.32e-6 (Less ID) 3.05e-13 (Less ID)
R445P 4.17e-4 (Less ID) None None
S456T 1.08e-7 (Less ID) 1.88e-5 (Less ID) 1.51e-14 (Less ID) S456Y 6.17e-12 (Less ID) 6.18e-5 (Less ID) 1.98e-15 (Less ID) L458V 3.31e-12 (Less ID) 3.33e-5 (More ID) 1.31e-15 (Less ID)
a-1 syntrophin R106Q 4.75e-4 (Less ID) 5.68e-6 (Less ID) 4.90e-1 (Less ID) I114F 1.13e-7 (Less ID) 2.05e-5 (Less ID) 8.81e-9 (Less ID) K116E 1.24e-8 (More ID) 8.99e-6 (More ID) 1.63e-4 (Less ID) A122T 3.63e-3 (Less ID) 4.92e-6 (Less ID) 7.71e-4 (More ID) Q125H 1.61e-1 (Not significant) 5.44e-5 (Less IDP) 1.07e-1 (Not significant) F130L 1.11e-1 (Not significant) 2.21e-6 (More IDP) 5.04e-7 (More ID) S144A 6.13e-8 (Less ID) 4.87e-7 (Less ID) 2.53e-8 (Less ID) T147N 1.32e-4 (More ID) 5.62e-7 (Less ID) 3.32e-3 (More ID) V154I 4.64e-6 (Less ID) 2.21e-5 (Less ID) 6.81e-11 (Less ID) R419C 3.82e-6 (Less ID) 1.87e-4 (Less ID) 7.86e-6 (Less ID) E451K 2.43e-3 (Less ID) 2.14e-6 (Less ID) 1.68e-3 (More ID) G460S 2.96e-6 (More ID) 5.08e-7 (More ID) 1.42e-6 (More ID) L463R 2.48e-4 (More ID) 9.35e-5 (Less ID) 1.17e-5 (More ID) S481L 1.36e-2 (More ID) 5.70e-5 (Less ID) 1.07e-4 (Less ID) S495- 1.13e-4 (More ID) 2.50e-1 (Not significant) 1.31e-2 (More ID) S495L 3.93e-1 (Not significant) 1.95e-3 (Less ID) 1.34e-4 (Less ID)
a-dystrobrevin A383S 6.72e-10 (More ID) 3.82e-5 (More ID) 3.36e-9 (More ID) N397D 1.02e-5 (More ID) 1.95e-1 (Not significant) 1.59e-8 (More ID) A403V 9.21e-12 (Less ID) 8.18e-7 (Less ID) 6.58e-9 (Less ID) H406Y 2.33e-7 (Less ID) 3.53e-5 (Less ID) 9.25e-10 (Less ID) G410R 1.33e-9 (More ID) 2.68e-5 (Less ID) 4.59e-10 (More ID) Y412S 1.28e-13 (More ID) 1.76e-7 (More ID) 6.58e-12 (More ID) R417W 6.83e-15 (Less ID) 2.80e-6 (Less ID) 2.31e-9 (Less ID) C422R 3.79e-13 (More ID) 1.95e-2 (More ID) 2.55e-9 (More ID) E425G 4.21e-10 (Less ID) 1.03e-5 (Less ID) 1.63e-9 (Less ID) A445T 1.07e-4 (More ID) 2.84e-6 (Less ID) 1.93e-10 (Less ID) S448F 1.62e-13 (Less ID) 6.80e-7 (Less ID) 5.48e-11 (Less ID) D467N 1.97e-1 (Not significant) 5.96e-4 (Less ID) 9.20e-7 (More ID) R494W 6.21e-11 (Less ID) 4.17e-7 (Less ID) 3.68e-13 (Less ID)
three scatter plots have many more SNPs associated with binding regions. However, as stated earlier no SNP within the binding regions of any of these proteins had known links to epileptic seizure phenotypes. Only Long QT Syndrome and multiple phenotypes of muscular dystrophy have been linked to mutations/ variants in these binding regions.
The results above show that only one SNP (rs200498749) was present in the AQP-4 binding region, at position 319. This was a missense variant that caused the amino acid change from valine to isoleucine. This mutation is located at the C-terminal end of the
protein which is responsible for interacting witha-1 syntrophin. As stated earlier, this SNP is not known to be associated with any disease. The same was true for our analysis of Kir4.1 which showed an SNP at position 376, which is in the C-terminally located binding region of this protein. However, as with AQP-4, this SNP is not associated with any disease phenotypes. These two proteins are thought to be directly responsible for certain seizure phenotypes because of the role they play in the DAPC and cell homeostasis. However, the scatter plots show that SNPs are frequent outside of their short binding regions. This could mean
Table 7.Paired T-test P-values of the disease-causing SNPs.
Protein SNP PONDR-FIT (effect) PONDR-VLXT (effect) VSL2 (effect)
AQP-4 None
Kir4.1 R65P 8.64e-8 (More ID) 6.45e-4 (Less ID) 1.44e-3 (More ID)
G77R 1.11e-8 (Less ID) 7.97e-5 (More ID) 2.83e-1 (Not significant) C140R 1.77e-1 (Not significant) 3.66e-7 (More ID) 2.18e-4 (More ID) T164I 2.30e-4 (More ID) 1.34e-4 (Less ID) 5.96e-4 (Less ID) A167V 4.41e-3 (Less ID) 4.89e-5 (Less ID) 2.14e-4 (Less ID) P194H 1.95e-1 (Not significant) 4.65e-5 (Less ID) 3.82e-3 (More ID) R199- 1.07e-3 (More ID) 2.85e-3 (Less ID) 1.54e-1 (Not significant) R297C 3.20e-8 (Less ID) 3.23e-6 (Less ID) 8.30e-5 (Less ID) R348C 5.50e-7 (Less ID) 4.41e-7 (Less ID) 9.84e-10 (Less ID) Dp71 R122- 2.83e-4 (Less ID) 5.25e-5 (Less ID) 2.33e-1 (Not significant)
C272Y 2.08e-7 (More ID) 1.76e-4 (Less ID) 3.29e-5 (More ID) R302- 1.78e-3 (More ID) 5.16e-3 (Less ID) 3.07e-1 (Not significant) R313- 5.06e-3 (More ID) 3.55e-2 (Less ID) 3.33e-1 (Not significant)
a-1 syntrophin A390V 2.15e-4 (Less ID) 2.68e-7 (Less ID) 6.17e-7 (Less ID)
a-dystrobrevin P121L 3.55e-3 (Less ID) 2.80e-4 (Less ID) 5.71e-4 (Less ID)
doi:10.1371/journal.pone.0073476.t007
Table 8.Functional motifs and functional domains of the DAPC members affected by the disease causing SNPs.
Protein SNP pFam ELM P-value IDPR Tendency Disease
Kir4.1 R65P IRK TRG_LysEnd_APsAcLL_1 LIG_PP1 8.64e-8 6 More ID Seizure
G77R MOD_GSK3_1
TRG_PEX_2
1.11e-11 6 Less ID Seizure
C140R None 1.77e-1 6 Not significant Seizure
T164I None 2.30e-4 6 More ID Seizure
A167V None 4.41e-3 6 Less ID Seizure
P194H None 1.95e-1 6 Not significant Deafness
R199- None 1.07e-3 6 More ID Seizure
R297C None 3.20e-8 6 Less ID Seizure
R348C MOD_PKA_2 MOD_PLK 5.50e-7 6 Less ID Deafness
Dp71 R122- EF-Hand 2 LIG_FHA_1 LIG_MAPK_1 2.83e-4 6 Less ID Muscle Dystrophy
C272Y ZZ None 2.08e-7 6 More ID Muscle Dystrophy
R302- pFam-B _2847 None 1.78e-3 6 More ID Muscle Dystrophy
R313- pFam-B _2847 CLV_PCSK_FUR_1 5.06e-3 6 More ID Muscle Dystrophy a-1 syntrophin A390V PH, pFam-B_796 &
_18143
None 2.15e-4 6 Less ID Long QT Syndrome 12
a-dystrobrevin P121L EF-Hand 2 SporeIII_AE
None 3.55e-3 6 Less ID Left Ventricular
Noncompaction 1
doi:10.1371/journal.pone.0073476.t008
that although the biding regions are primarily responsible for these proteins ability to interact, they have little to do with sustaining stability and overall protein functionality.
The scatter plots fora-1 syntrophin, Dp71 anda-dystrobrevin show a very different variation content as compared to those of the Kir4.1 and AQP-4 proteins. These plots emphasize the large difference in SNP frequency, especially in the binding regions of interest. As Figure 9 shows, the large majority of variations only have a frequency of one. This frequency forms the linear clustering that can be seen across the bottom of each respective scatter plot. Tables 9–11 give even more detail on these proteins, listing the ID, type, actual variation and amino acid position of each SNP as it
relates to the particular binding site. It is important to note that a single amino acid position can be affected by multiple SNP types. This is best represented in the SU-domain ofa-1 syntrophin where position 495 can have three different variations; a missense variant, a synonymous variant and a stop-codon variant. Although each of these SNPs can occur at the same location, they have drastically different impacts on the protein. The synonymous variant does not induce amino acid change, while the variant resulting in the stop-codon cuts off the last 11 amino acids, all of which are part of the SU-domain. As this domain is the region responsible fora-1 syntrophin interaction with both Dp71 and a-dystrobrevin, this SNP could have a significant impact on the
Figure 8. Distribution of SNPs affecting polar and non-polar residues in AQP-4 (A), KCNJ-10 (Kir4.1, B),a1-syntrophin (C), Dp71 (D), anda-dystrobrevin (E).
DAPC and its overall stability/function. Therefore, the scatter plots shown in Figure 9 and the associated data help to uncover meaningful results from the SNP data as well as aid in the visualization of where these variations are physically occurring within each proteins amino acid sequence.
Further analysis was performed on the available SNPs for each of these five proteins in order to determine the impact that specific variations had on protein intrinsic disorder propensity that can be translated to the potential effects of amino acid variations on protein stability and functionality. At this stage we got rid of any identical SNPs which were repeated multiple times at a specific
Figure 9. Scatter plots showing SNP distributions within the amino acid sequences of AQP-4 (A), Kir4.1 (B),a1-syntrophin (C), Dp71 (D), anda-dystrobrevin (E).SNPs happening in known binding regions are indicated by different colors that match colors in corresponding tables (see Tables 9-11).
doi:10.1371/journal.pone.0073476.g009
location. However, those SNPs which occurred at the same location but resulted in different amino acids were included. This allowed us to trim down the total variants of each protein to just those that were unique and which directly impacted the amino acid sequences. This pre-filtering generated 52, 56, 57, 56, and 80 unique SNPs for AQP-4, KCNJ-10 (Kir4.1), a-1 syntrophin, Dp71, and a-dystrobrevin, respectively that were used in all subsequent analyses.
Figure 10 is a visual representation of data on the effect of SNPs on the mean intrinsic disorder score of a given protein. The statistical significance of the effects of corresponding mutations on protein’s disorder score was already discussed above. In each plot of the Figure 10, disorder scores are shown on the Y-axis, whereas X-axis represents the SNP numbers. Note that these SNP numbers are used as identifiers of given SNPs and are not related to the SNP positions within the protein sequence. Figure 10 shows that
Table 9.Binding site SNPs ina-1 syntrophin.
Region SNP ID SNP Type Variation AA Position
PDZ Domain (87–170, red) rs75025585 Missense R/Q 106
TMP_ESP_20_32026803 Missense I/F 114
TMP_ESP_20_32026797 Missense K/E 116
rs151113230 Missense A/T 122
rs201421292 Missense Q/H 125
rs199964677 Missense F/L 130
rs142978180 Missense S/A 144
rs141724500 Missense T/N 147
rs200241523 Missense V/I 154
rs200647905 Synonymous L 164
Dystrobrevin Domain (408–416, green)
rs142580715 Synonymous V 410
SU Domain (449–505, blue) rs116747979 Synonymous F 450
rs148604302 Missense E/K 451
rs146134721 Synonymous D 459
TMP_ESP_20_31996554 Missense G/S 460
rs188835994 Missense L/R 463
rs201485963 Synonymous H 480
TMP_ESP_20_31996389 Missense S/L 481
TMP_ESP_20_31996346 Synonymous S 495
rs144006909 Missense S/L 495
rs144006909 Stop gained S/* 495
rs34901081 Synonymous A 496
doi:10.1371/journal.pone.0073476.t009
Table 10.Binding site SNP in Dp71.
Region SNP ID SNP Type Variation AA Position
Syntrophin Domain (362–412, blue)
rs190867451 Synonymous C 395
TMP_ESP_X_31187673 Missense N/K 399
TMP_ESP_X_31187671 Missense Q/R 400
Dystrobrevin Domain (420–460) green
rs149723217 Missense I/V 428
rs139547504 Missense R/H 445
COSM216862 Missense R/L 445
COSM216863 Missense R/H 445
rs150957972 Missense S/T 456
rs145123497 Missense S/Y 456
TMP_ESP_X_31165574 Missense L/V 458
rs72466538 Synonymous P 459
some proteins have very little variation associated with their SNPs while others have a wide range of differences. Additionally, proteins differ from each other not only by the number of SNPs affecting their mean disorder scores, but also by the amplitudes of these changes. Therefore, these plots provide a simple illustrative mean to discern which proteins are more likely to be effected by changes in their amino acid sequences. For example, the comparison of plots corresponding to AQP-4 anda-dystrobrevin shows that AQP-4 has only a few spots of extreme deviation from the wild type values, whereasa-dystrobrevin has numerous spots that differ from the wild type disorder value. This suggests that the disorder propensity of AQP-4 is much less affected by most variations. We believe that these types of graphs are helpful in that they give a clear picture of those SNPs which do or do not affect the disorder status of a protein. In this way, the number of unique SNPs which have to be focused on for further analysis can be trimmed down. Also, SNPs that do affect the mean disorder level can be ranked based on the severity of their effects (the scale of deviation from the mean disorder scores of wild type proteins), which provides another way to focus on specific variations.
Another way of showing the effects of SNPs on the protein’s disorder propensity is a plot where the per-residue disorder scores of the SNP-produced variant are correlated with the per-residue disorder scores of the corresponding wild type protein (see Figure 11). In corresponding plots, the X-axis shows the per-residue disorder scores for the wild type proteins, whereas the Y-axis shows the position matched disorder scores of the mutant protein. Obviously, when mutations do not affect the protein’s disorder score, the corresponding dependence is described as a straight line following the diagonal of a given plot, whereas any deviation from this diagonal straight line is a representation of an effect of an SNP on protein’s disorder propensity. Here, the
positive deviations (i.e., moving plots above the diagonal) reflect the SNP-induced increase of intrinsic disorder propensity in a given protein, whereas the negative deviations (i.e., those moving plots below the diagonal) denote the SNP-promoted decrease in protein’s disorder level. Obviously, the severity of the effect of an SNP on protein disorder propensity can be evaluated by the magnitude of the corresponding line deviation from the diagonal. Figure 11A represents the corresponding disorder correlation graph for AQP-4 that has only a few SNPs that significantly shift the disorder line away from the diagonal. The three that stand out the most are SNPs at positions 136 (Valine-Phenylalanine), 182 (Arginine-Tryptophan), and 260 (Arginine-Cysteine). Figure 11A shows that these three variants pushed the protein towards more order. Most changes in disorder propensity happen in a window of about 15–30 amino acids surrounding the SNP. The range seems to be dependent on how different the amino acid is from the wild type and the characteristics of the residues surrounding it.
Figure 11B shows that Kir4.1 has five SNPs causing severe shifts in protein’s order/disorder propensity. These are SNPs at positions 18 (Arginine-Tryptophan), 26 (Arginine-Stop Codon), 36 (Arginine-Cytosine), 171 (Arginine-Glutamine), and 181 (Phenylalanine-Leucine). The stop codon at position was the most severe as it truncated the protein to a length of only 25 residues and caused noticeable increase in protein’s disorder propensity. The SNP at position 181 also increased disorder noticeably. The other three SNPs, 18, 36 and 171, all resulted in increased order in a protein.
a-1-Syntrophin was mostly unaffected by a majority of SNP’s. However, Figure 11C shows that there is a general shift below the diagonal which would denote more order in variants produced by SNPs. The SNPs at positions 189 (Serine-Leucine), 207 (Arginine-Tryptophan), and 495 (Serine-Leucine) were the most
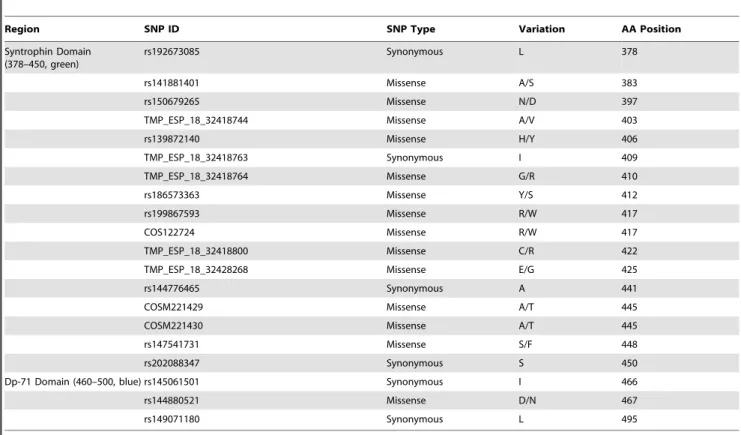
order-Table 11.Binding site SNPs ina-dystrobrevin.
Region SNP ID SNP Type Variation AA Position
Syntrophin Domain (378–450, green)
rs192673085 Synonymous L 378
rs141881401 Missense A/S 383
rs150679265 Missense N/D 397
TMP_ESP_18_32418744 Missense A/V 403
rs139872140 Missense H/Y 406
TMP_ESP_18_32418763 Synonymous I 409
TMP_ESP_18_32418764 Missense G/R 410
rs186573363 Missense Y/S 412
rs199867593 Missense R/W 417
COS122724 Missense R/W 417
TMP_ESP_18_32418800 Missense C/R 422
TMP_ESP_18_32428268 Missense E/G 425
rs144776465 Synonymous A 441
COSM221429 Missense A/T 445
COSM221430 Missense A/T 445
rs147541731 Missense S/F 448
rs202088347 Synonymous S 450
Dp-71 Domain (460–500, blue) rs145061501 Synonymous I 466
rs144880521 Missense D/N 467
rs149071180 Synonymous L 495
doi:10.1371/journal.pone.0073476.t011
Figure 10. Analyzing the effect of SNPs on the fraction of disordered residues in a target protein: AQP-4 (A), Kir4.1 (B), Dp71 (C),a 1-syntrophin (D), anda-dystrobrevin (E).For a given protein, faction of disordered residues was determined as a relative content of residues with the disorder score above the 0.5 threshold. Note that numbers on the X-axis correspond to the identification numbers of SNPs and not to their positions within the protein sequence.
Figure 11. Correlation between the per-residue disorder scores of the wild type proteins and SNP-produced variants of AQP-4 (A), Kir4.1 (B),a1-syntrophin (C), Dp71 (D), anda-dystrobrevin (E).These graphs are generated by plotting the per-residue disorder scores of SNP-produced variants versus the per-residue disorder scores of corresponding wild type proteins. Each line in these plots corresponds to the pre-residue disorder scores correlation evaluated for one SNP-produced variant.
doi:10.1371/journal.pone.0073476.g011
promoting, whereas the SNPs affecting residues 442 (Arginine-Stop Codon) and 495 (Serine-(Arginine-Stop Codon) both truncated the protein and caused significant increases in disorder.
Figure 11D illustrates that the SNP-induced variability of the Dp71 disorder propensity is rather high. Four SNPs, 122 (Arginine-Stop Codon), 242 (Glutamine-Stop Codon), 302 (Argi-nine-Stop Codon) and 313 (Argi(Argi-nine-Stop Codon), incorporated stop codons and resulted in the great increase in the disorder propensity. SNPs that occur at positions 7 (Glycine-Serine), 64 (Alanine-Aspartic Acid), 583 (Asparagine-Lysine), and 583 (As-paragine-Serine) all promote a little more disorder, whereas SNPs at positions 196 (Arginine-Tryptophan), 399 (Asparagine-Lysine), 485 (Arginine-Cysteine), and 600 (Methionine-Valine) all resulted in increased order.
Finally, Figure 11E shows thata-dystrobrevin is impacted the most by a majority of SNPs. However, this effect could partly be attributed to the fact thata-dystrobrevin has the largest number of unique SNPs. Standouts include SNPs at positions 31 (Arginine-Glutamine), 121 (Proline-Leucine), 308 (Serine-Isoleucine), 448 (Serine-Phenylalanine), 448 (Serine-Phenylalanine), 494 Tryptophan), 519 Tryptophan) and 691 (Arginine-Cysteine), which all result in an increased order. Alternatively, SNPs affecting positions 9 (Glycine-Arginine), 246 (Cysteine-Serine), 412 (Tyrosine-Serine) and 422 (Cysteine-Arginine) all cause somewhat increased disorder, whereas an SNP at position 676 (Arginine-Stop Codon) is the most detrimental as it cut off the last 69 amino acids and greatly increases disorder.
Concluding, presented in this study several types of visual analyses constitute a practical tool in determining which SNPs change the intrinsic disorder predisposition in a target protein. They also allow for visual representation of the severity of the resulting changes. Thus, for a given protein, the analysis of a few hundred SNPs can be reduced to a small subset comprising of SNPs that possess the most detrimental effects on the protein intrinsic disorder propensity. Since the correlation between the peculiarities of intrinsic disorder profiles and functionality is established for several proteins, we believe that the described analyses represent a useful addition to the arsenal of tools for computational analysis of disorder-based protein functions.
Materials and Methods
Conserved Sequence Analysis
Proteins from mammals (Homo sapiens and Mus musculus), fish (Brachydanio rerio), amphibian (Xenopus laevis), bird (Gallus gallus), and reptile (Anolis carolinensis) analyzed in this study are listed in Table 1 together with their corresponding UniProt IDs (www.UniProt. org). Alignments of different sequences performed to find the conservation levels were done using the alignment tools available at the UniProt website (www.UniProt.org), Clustal O 1.1.0 (http://www.clustal.org/omega/). Each binding site was deter-mined based on the analysis of the available literature data [90,107,118,119,121,122,126] and the UniProt database (www. UniProt.org).
Mutation Analysis
Information on the mutations in AQP-4, Kir4.1, Dp71, a-1 syntrophin, and a-dystrobrevin associated with various diseases was extracted from the corresponding articles (which have been referenced in the introduction and discussion sections). The National Center for Biotechnology Information (www.NCBI.nlh. nih.gov) was used to look up for related publications and served as a platform when searching for specific information related to the DAPC proteins. Databases, including OMIM and DMDM, were
consulted to find allelic variants within the amino acid sequences of each protein. For the dystrophin protein, allelic variants were only available for its entire DMD gene, but not for the fifth isoform, Dp71, which we were interested in. However, the UniProt website provided the information necessary to convert DMD gene to Dp71. A special protocol was developed that allowed us to interpret sequence information from theDMDand change it to the correct sequence numbering when converting from one isoform to the other. In this way it was possible to find allelic variants related to the Dp71 isoform.
Single Nucleotide Polymorphisms Analysis
The Single Nucleotide Polymorphisms (SNPs) for each protein in the DAPC were identified using the Ensemble Genome Browser website (http://useast.ensembl.org). Each DAPC protein and all related variations, mutations and SNPs were found within the corresponding genome browser. Genetic variations for each protein analyzed were presented by the website as tables, with the total number of variants sub-divided into categories such as missense variants, stop gain/loss variants, synonymous variants, splice region variants,etc. These tables were downloaded for each of the proteins in the complex. Every type of variation, for each respective protein, was compiled into an excel spreadsheet, where it was sorted according to the location of the amino acid substitutions. In this regard, every SNP that had an assigned/ known AA variant was analyzed. Variations that did not correspond to specific locations in a proteins amino acid (AA) sequence were discarded, as these did not give any relevant SNP data. In most cases, a majority of the variation table was composed of variants that did not correspond to specific AA locations, such as intron variants and downstream un-translated region (UTR) variants. The AA substitutions were separated according to whether they were affecting polar or non-polar residues and then summed. The corresponding data are listed in Table 12.
Disorder predictions were performed for each of the wild type and mutant proteins by creating complete, unique amino acid sequences based on each SNP. We did this by taking the wild type sequences of each respective protein and substituting a single unique variant at its appropriate position to create a new sequence that differed from the wild type by a single amino acid. Therefore, each SNP had a complete amino acid sequence associated with it that could be used for disorder prediction analysis and which could then be compared to the wild type sequences.
To see the effect of SNPs on protein disorder characteristics and to check the statistical meaning of disease-causing SNPs a paired T-test between the wild type protein and each variant was performed. In the paired T-test, significance level of 0.05 was utilized. For each protein, the disorder probability values were obtained from disorder predictor algorithms, such as PONDR-FIT [127], PONDRHVLXT [128], and PONDRHVSL2 [129]. Also, to verify the effect of disease-causing variants, their locations within the functional motifs or protein domains were checked through ELM (http://elm.eu.org/) and pFam (http://pfam. sanger.ac.uk/) databases.
Binding Site Prediction
Author Contributions
Conceived and designed the experiments: VU. Performed the experiments: IN DR MK YQ BX VU. Analyzed the data: IN DR BX VU. Contributed reagents/materials/analysis tools: BX. Wrote the paper: IN DR VU.
References
1. Wright PE, Dyson HJ (1999) Intrinsically unstructured proteins: re-assessing the protein structure-function paradigm. J Mol Biol 293: 321–331. 2. Uversky VN, Gillespie JR, Fink AL (2000) Why are "natively unfolded"
proteins unstructured under physiologic conditions? Proteins 41: 415–427. 3. Dunker AK, Lawson JD, Brown CJ, Williams RM, Romero P, et al. (2001)
Intrinsically disordered protein. J Mol Graph Model 19: 26–59.
4. Dunker AK, Obradovic Z (2001) The protein trinity--linking function and disorder. Nat Biotechnol 19: 805–806.
5. Dyson HJ, Wright PE (2002) Coupling of folding and binding for unstructured proteins. Curr Opin Struct Biol 12: 54–60.
6. Dunker AK, Brown CJ, Lawson JD, Iakoucheva LM, Obradovic Z (2002) Intrinsic disorder and protein function. Biochemistry 41: 6573–6582. 7. Dunker AK, Brown CJ, Obradovic Z (2002) Identification and functions of
usefully disordered proteins. Adv Protein Chem 62: 25–49.
8. Tompa P (2002) Intrinsically unstructured proteins. Trends Biochem Sci 27: 527–533.
9. Uversky VN (2002) Natively unfolded proteins: a point where biology waits for physics. Protein Sci 11: 739–756.
10. Uversky VN (2002) What does it mean to be natively unfolded? Eur J Biochem 269: 2–12.
11. Uversky VN (2003) Protein folding revisited. A polypeptide chain at the folding-misfolding-nonfolding cross-roads: which way to go? Cell Mol Life Sci 60: 1852–1871.
12. Tompa P, Csermely P (2004) The role of structural disorder in the function of RNA and protein chaperones. FASEB J 18: 1169–1175.
13. Daughdrill GW, Pielak GJ, Uversky VN, Cortese MS, Dunker AK (2005) Natively disordered proteins. In: Buchner J, Kiefhaber T, editors. Handbook of Protein Folding. Weinheim, Germany: Wiley-VCH, Verlag GmbH & Co. pp. 271–353.
14. Dunker AK, Cortese MS, Romero P, Iakoucheva LM, Uversky VN (2005) Flexible nets: The roles of intrinsic disorder in protein interaction networks. FEBS Journal 272: 5129–5148.
15. Dyson HJ, Wright PE (2005) Intrinsically unstructured proteins and their functions. Nat Rev Mol Cell Biol 6: 197–208.
16. Oldfield CJ, Cheng Y, Cortese MS, Romero P, Uversky VN, et al. (2005) Coupled folding and binding with alpha-helix-forming molecular recognition elements. Biochemistry 44: 12454–12470.
17. Tompa P (2005) The interplay between structure and function in intrinsically unstructured proteins. FEBS Lett 579: 3346–3354.
18. Tompa P, Szasz C, Buday L (2005) Structural disorder throws new light on moonlighting. Trends Biochem Sci 30: 484–489.
19. Uversky VN, Oldfield CJ, Dunker AK (2005) Showing your ID: intrinsic disorder as an ID for recognition, regulation and cell signaling. J Mol Recognit 18: 343–384.
20. Radivojac P, Iakoucheva LM, Oldfield CJ, Obradovic Z, Uversky VN, et al. (2007) Intrinsic disorder and functional proteomics. Biophys J 92: 1439–1456. 21. Xie H, Vucetic S, Iakoucheva LM, Oldfield CJ, Dunker AK, et al. (2007) Functional anthology of intrinsic disorder. 1. Biological processes and functions of proteins with long disordered regions. J Proteome Res 6: 1882–1898. 22. Vucetic S, Xie H, Iakoucheva LM, Oldfield CJ, Dunker AK, et al. (2007)
Functional anthology of intrinsic disorder. 2. Cellular components, domains, technical terms, developmental processes, and coding sequence diversities correlated with long disordered regions. J Proteome Res 6: 1899–1916. 23. Xie H, Vucetic S, Iakoucheva LM, Oldfield CJ, Dunker AK, et al. (2007)
Functional anthology of intrinsic disorder. 3. Ligands, post-translational modifications, and diseases associated with intrinsically disordered proteins. J Proteome Res 6: 1917–1932.
24. Cortese MS, Uversky VN, Dunker AK (2008) Intrinsic disorder in scaffold proteins: getting more from less. Prog Biophys Mol Biol 98: 85–106. 25. Dunker AK, Silman I, Uversky VN, Sussman JL (2008) Function and structure
of inherently disordered proteins. Curr Opin Struct Biol 18: 756–764. 26. Dunker AK, Oldfield CJ, Meng J, Romero P, Yang JY, et al. (2008) The
unfoldomics decade: an update on intrinsically disordered proteins. BMC Genomics 9 Suppl 2: S1.
27. Dunker AK, Uversky VN (2008) Signal transduction via unstructured protein conduits. Nat Chem Biol 4: 229–230.
28. Oldfield CJ, Meng J, Yang JY, Yang MQ, Uversky VN, et al. (2008) Flexible nets: disorder and induced fit in the associations of p53 and 14-3-3 with their partners. BMC Genomics 9 Suppl 1: S1.
Table 12.SNPs causing amino acid substitutions in the DAPC proteins.
AQP-4 Polar Arg Asn Asp Cys Glu Gln His Lys Ser Thr Stop gained
Counts 38 6 12 3 17 21 20 13 11 52 0
Non-polar Ala Gly Ile Leu Met Phe Pro Trp Tyr Val
Counts 34 17 39 49 16 9 18 6 4 32
Kir4.1 Polar Arg Asn Asp Cys Glu Gln His Lys Ser Thr Stop gained
Counts 21 4 7 5 10 9 6 3 6 5 2
Non-polar Ala Gly Ile Leu Met Phe Pro Trp Tyr Val
Counts 5 5 2 8 1 3 8 2 1 8
a-1 Syntrophin Polar Arg Asn Asp Cys Glu Gln His Lys Ser Thr Stop gained
Counts 13 3 6 5 6 7 4 5 15 9 2
Non-polar Ala Gly Ile Leu Met Phe Pro Trp Tyr Val
Counts 15 8 5 12 2 4 5 3 2 7
Dp71 Polar Arg Asn Asp Cys Glu Gln His Lys Ser Thr Stop gained
Counts 19 8 5 5 5 5 5 7 13 5 0
Non-polar Ala Gly Ile Leu Met Phe Pro Trp Tyr Val
Counts 7 4 5 12 1 2 6 1 2 6
a-Dystrobrevin Polar Arg Asn Asp Cys Glu Gln His Lys Ser Thr Stop gained
Counts 31 8 5 4 8 12 9 2 15 17 0
Non-polar Ala Gly Ile Leu Met Phe Pro Trp Tyr Val
Counts 17 11 5 13 7 2 13 5 3 11
doi:10.1371/journal.pone.0073476.t012