ACPD
10, 30731–30776, 2010Global and regional trends in aerosol
optical depth
A. de Meij et al.
Title Page
Abstract Introduction
Conclusions References
Tables Figures
◭ ◮
◭ ◮
Back Close
Full Screen / Esc
Printer-friendly Version Interactive Discussion
Discussion
P
a
per
|
Dis
cussion
P
a
per
|
Discussion
P
a
per
|
Discussio
n
P
a
per
|
Atmos. Chem. Phys. Discuss., 10, 30731–30776, 2010 www.atmos-chem-phys-discuss.net/10/30731/2010/ doi:10.5194/acpd-10-30731-2010
© Author(s) 2010. CC Attribution 3.0 License.
Atmospheric Chemistry and Physics Discussions
This discussion paper is/has been under review for the journal Atmospheric Chemistry and Physics (ACP). Please refer to the corresponding final paper in ACP if available.
Global and regional trends in aerosol
optical depth based on remote sensing
products and pollutant emission
estimates between 2000 and 2009
A. de Meij1, A. Pozzer1, and J. Lelieveld1,2
1
Energy, Environment and Water Research Centre, The Cyprus Institute, 20 Kavafi Street, 1645, Nicosia, Cyprus
2
Max Planck Institute for Chemistry, Becherweg 27, 55128 Mainz, Germany
Received: 11 October 2010 – Accepted: 6 December 2010 – Published: 17 December 2010
Correspondence to: A. de Meij ([email protected])
ACPD
10, 30731–30776, 2010Global and regional trends in aerosol
optical depth
A. de Meij et al.
Title Page
Abstract Introduction
Conclusions References
Tables Figures
◭ ◮
◭ ◮
Back Close
Full Screen / Esc
Printer-friendly Version Interactive Discussion
Discussion
P
a
per
|
Dis
cussion
P
a
per
|
Discussion
P
a
per
|
Discussio
n
P
a
per
|
Abstract
This study evaluates global and regional aerosol optical depth (AOD) trends in view of aerosol (precursor) emission changes between 2000 and 2009. We use AOD products from MODIS, MISR and AERONET, and emission estimates from the EMEP, REAS and IPCC inventories. First we compare trends in global Level 3 AOD products of 5
MODIS, MISR and AERONET (Level 2). We find generally negative trends over Eu-rope and North America, whereas over South and East Asia they are mostly positive. The negative trends over parts of Europe and North-East America appear to be sig-nificant. Second, we analyze MODIS Level 2 AODs for three selected regions with good data coverage (Central Mediterranean, North-East America and East Asia) and 10
compare with Level 3 products. This corroborates that the 2000–2009 AOD trend over the Central Mediterranean is negative and corresponds well with the MODIS Level 3 analysis. Also for North-East America the trend is generally negative and in agreement with MODIS Level 3 products. For East Asia the trends derived from Level 2 products are mostly positive and correspond with the MODIS Level 3 results. Over Europe, the 15
trends in aerosol single scattering albedo, as derived from MISR data, appear to be positive (declining solar radiation absorption), whereas this is not the case over the USA, though these data are not yet validated. Third we compare trends in AOD with emission changes of SO2, NOx, NH3 and black carbon. We associate the downward trends in AOD over Europe and North America with decreasing emissions of SO2, NOx, 20
and other criteria pollutants, and consequently declining aerosol concentrations. Over East Asia the MODIS Level 2 trends are generally positive, consistent with increasing pollutant emissions by fossil energy use and growing industrial and urban activities. It appears that SO2emission changes dominate the AOD trends, although especially in Asia NOxemissions may become increasingly important. Our results suggest that so-25
ACPD
10, 30731–30776, 2010Global and regional trends in aerosol
optical depth
A. de Meij et al.
Title Page
Abstract Introduction
Conclusions References
Tables Figures
◭ ◮
◭ ◮
Back Close
Full Screen / Esc
Printer-friendly Version Interactive Discussion
Discussion
P
a
per
|
Dis
cussion
P
a
per
|
Discussion
P
a
per
|
Discussio
n
P
a
per
|
1 Introduction
The concentration changes of atmospheric aerosols cause radiative forcings of cli-mate, known as the aerosol direct effect, and may modify cloud properties, known as aerosol indirect effects (Ramanathan et al., 2001a,b; Kaufman et al., 2002). Depend-ing on their composition, aerosols scatter (e.g. sulfate) and absorb (e.g. black carbon) 5
sunlight, mostly cooling the Earth’s surface. Recent studies focusing on the Northern Hemisphere (Wild et al., 2005; Wild, 2010, and references therein) have shown that since the late 1980s the decline in solar radiation at the Earth’s surface due to aerosol pollution (dimming) has reversed. This change from dimming to brightening has impor-tant consequences for climate change, affecting the hydrological cycle, cloud formation 10
processes and surface temperatures, possibly intensifying the warming trend caused by CO2and other greenhouse gases.
Several studies have investigated the global and regional surface solar radiation bud-get using data of the Global Energy Balance Archive (GEBA), such as Ohmura (2009), Gilgen et al. (2009), Long et al. (2009), Norris and Wild (2009). Pinker et al. (2005) and 15
Hinkelman et al. (2009) analyzed long-term variations in solar radiation at the Earth’s surface using satellite data. Mishchenko et al. (2007) use Aerosol Optical Depth (AOD) from the Advanced Very High Resolution Radiometer (AVHRR) satellite to study the dimming and brightening tendencies. The AOD is the integral of the extinction (scat-tering plus absorption) by the aerosols over the atmospheric column, and trends have 20
been shown to be largely anthropogenic (Streets et al., 2009). Remer et al. (2008) analyzed Moderate resolution Imaging Spectroradiometer (MODIS) Terra and Aqua Level 2 and Level 3 aerosol products over land and the ocean for 2002–2006. They found elevated AODs over India and East Asia and reduced AODs over North America and Europe. Chylek et al. (2007) analyzed Multi-angle Imaging Spectro Radiometer 25
ACPD
10, 30731–30776, 2010Global and regional trends in aerosol
optical depth
A. de Meij et al.
Title Page
Abstract Introduction
Conclusions References
Tables Figures
◭ ◮
◭ ◮
Back Close
Full Screen / Esc
Printer-friendly Version Interactive Discussion
Discussion
P
a
per
|
Dis
cussion
P
a
per
|
Discussion
P
a
per
|
Discussio
n
P
a
per
|
the MODIS and MISR instruments. A modeling study by Streets et al. (2006) showed that the trends in surface radiation are correlated with the trends in calculated emis-sions of sulfur dioxide (SO2), black carbon (BC) and AODs. Zhang and Reid (2010) analyzed global and regional trends in AOD of MODIS and MISR over the oceans, using Level 2 products. They show that for both instruments a statistically negligible 5
global trend of 0.0003/yr is found, with strong regional trends over the Bay of Bengal (0.07/decade), the east coast of Asia (0.06/decade) and the Arabian Sea (0.06/decade) by MODIS and MISR. Kishcha et al. (2009) studied the meridional distribution of AODs over the ocean between 2000 and 2008 using MODIS and MISR products. They con-cluded that the brightening phenomenon over land was not observed over the oceans 10
at mid-latitudes (30◦–60◦N).
To our knowledge no work has been reported comparing the AOD trends of the MODIS and MISR measurements with data of the AERONET network for the period 2000–2009 on global (using Level 3 products) and regional scales (also using Level 2 products), and comparing these trends to aerosol (precursors) emissions.
15
This study has three main objectives. The first is to compare trends in global Level 3 AOD products of MODIS, MISR and AERONET (Level 2) for the period 2000–2009. Us-ing Level 3 data gives a first impression of the trend. However, it is not recommended to draw strong conclusions based on Level 3 data products, because the sampling of actual retrievals is highly non-uniform in space and time, even at the resolution of these 20
products (MODIS 1◦×1◦ and MISR 0.5◦×0.5◦) (Kahn et al., 2009). Therefore our sec-ond objective is to also analyze MODIS Level 2 AODs between 2000 and 2009 for three selected regions with good data coverage and compare the trends with MODIS Level 3 data. The advantage of Level 2 is that it provides information about the sampling time and has a better spatial representation (10×10 km), which is relevant for the com-25
ACPD
10, 30731–30776, 2010Global and regional trends in aerosol
optical depth
A. de Meij et al.
Title Page
Abstract Introduction
Conclusions References
Tables Figures
◭ ◮
◭ ◮
Back Close
Full Screen / Esc
Printer-friendly Version Interactive Discussion
Discussion
P
a
per
|
Dis
cussion
P
a
per
|
Discussion
P
a
per
|
Discussio
n
P
a
per
|
and iii) the north eastern part of China (min/max longitude 103.0◦;127.0◦; min/max latitude 20.0◦; 44.0◦), i.e. densely populated areas with intense industrial activities.
Our third objective is to compare the trends in AODs with the trends in emissions of SO2, which contribute substantially to the global AOD (Streets et al., 2006), nitrogen oxides (NOx), ammonia (NH3) and black carbon (BC). For this purpose we analyze 5
estimated source strengths for the years 1990, 1995, 2000, 2005 and 2010 from global and regional emission inventories.
2 Methodology
Satellite data of the Multi-angle Imaging Spectro Radiometer (MISR) and MODerate resolution Imaging Spectro radiometer (MODIS) are used for quantitative comparisons 10
with the sun photometer data of the AErosol RObotic NETwork (AERONET). MISR and MODIS are both on NASA’s Earth Observing System (EOS) Terra platform, launched in December 1999. First we evaluate the global AOD trends from the MODIS and MISR Level 3 products by analyzing the change in the AODs between 2000 and 2009. Second, we compare the monthly mean Level 3 AODs between MODIS and MISR for 15
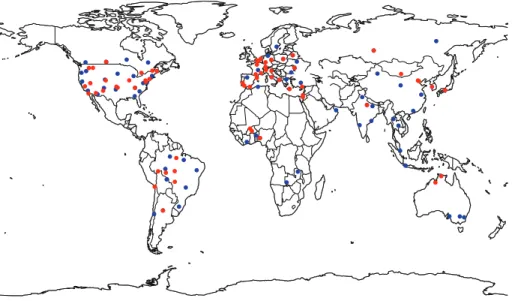
152 locations. We identify within the MODIS and MISR Level 3 data sets the geo-graphical pixel location of the AERONET station and we extract the AODs. In Fig. 1 an overview of the AERONET stations is given (blue and red dots) for which we com-pare with MODIS and MISR data for the period February 2000–December 2009. Third we select the AERONET stations for which sufficient AERONET daily Level 2 data is 20
available (>50 months) and compare these AOD profiles with MODIS and MISR (62 stations, red dots). Fourth we analyze the AOD trend of MODIS Level 2 product for three regions and compare the results with MODIS Level 3 data. For MODIS Level 2 we extract from the overpasses the AODs within the geographical range of±15×30 km around the AERONET station.
25
ACPD
10, 30731–30776, 2010Global and regional trends in aerosol
optical depth
A. de Meij et al.
Title Page
Abstract Introduction
Conclusions References
Tables Figures
◭ ◮
◭ ◮
Back Close
Full Screen / Esc
Printer-friendly Version Interactive Discussion
Discussion
P
a
per
|
Dis
cussion
P
a
per
|
Discussion
P
a
per
|
Discussio
n
P
a
per
|
collection 5.0 Level 2 and Level 3 data is used, for MISR F15 Level 3 and for AERONET Level 2 data. More details regarding the satellites and the AERONET network are given in Sect. 2.1.
Finally we compare the AOD trends with emission estimates of SO2, NOx, NH3and BC for the years 1990, 1995, 2000, 2005 and 2010 for the different regions. The 5
emission estimations are taken from the Co-operative Programme for Monitoring and Evaluation of the Long-range Transmission of Air Pollutants (EMEP) for Europe, the Region Emission Inventory for Asia (REAS) and the Intergovernmental Panel on Cli-mate Change (IPCC, RCP 3PD) for North America and the entire globe.
2.1 Description of the data sets
10
2.1.1 AERONET
The sun photometer data used in this study have been obtained by Cimel instruments which are part of the AERONET global network (Holben et al., 1998). AERONET data are widely used as a reference for satellite validation and model evaluation studies, be-cause the measurement characteristics are well understood (Dubovik et al., 2000). The 15
sun photometer measures the attenuation (every 15 min) in a 1.2 degree field of view, at eight solar spectral bands (340, 380, 440, 500, 670, 870, 940 and 1020 nm). The solar extinction measurements are used to calculate for each wavelength the aerosol optical depth with an accuracy of about 0.01–0.02 AOD units (Eck et al., 1999). Sun photometers acquire aerosol data only during daylight and in clear sky conditions. In 20
this work the cloud-screened monthly mean Level 2 data are used. Data is obtained from the website: http://aeronet.gsfc.nasa.gov/.
We use AOD at 550 nm (the solar irradiance is most intense in the green/yellow part of the spectrum around 550 nm) calculated from the AOD values reported at 870 and 440 nm by using the information of the ˚Angstr ¨om coefficient (α). This allows us to 25
ACPD
10, 30731–30776, 2010Global and regional trends in aerosol
optical depth
A. de Meij et al.
Title Page
Abstract Introduction
Conclusions References
Tables Figures
◭ ◮
◭ ◮
Back Close
Full Screen / Esc
Printer-friendly Version Interactive Discussion
Discussion
P
a
per
|
Dis
cussion
P
a
per
|
Discussion
P
a
per
|
Discussio
n
P
a
per
|
The AOD values of the AERONET dataset are interpolated to 550 nm. First the ˚
Angstr ¨om coefficient is calculated by using two wavelengths (870 nm and 440 nm, see Eq. 1). Then the AOD (τ) at 550 nm is calculated (Eq. 2).
α=−ln[τ(0.440)/τ(0.870)]/ln(0.44/0.87) (1) τ(550)=exp{−α∗ln(0.55/0.44)+ln[τ(440)]} (2) 5
2.1.2 MISR
The Multi-angle Imaging Spectro-Radiometer (MISR) (Diner et al., 1998) has four for-ward looking cameras, one nadir and four backfor-ward looking (at viewing angles of 70.5◦, 60.0◦, 45.6◦, 26.1◦, and 0◦), and each camera measures in four different wavelengths centered at 446 nm (blue), 558 nm (green), 671 nm (red) and 866 nm (near-infrared). 10
The AOD in the Level 2 data is reported at 17.6×17.6 km resolution, by analyzing top-of-atmosphere radiances from 16×16 pixels patches of 1.1 km resolution (Martonchik et al., 2009; Diner et al., 2009; Kahn et al., 2009). This feature of observing at dif-ferent angles enables retrieval of total-column AOD, which is defined as the integral of aerosol extinction from the surface to the top of the atmosphere, and aerosol type 15
over both land and ocean (Martonchik et al., 2009). There is a time difference of 7.5 min between the first and the last camera recording to view the exact geographic position as the satellite passes over. Each path has a swath width of 360 km with a 16-day repeat cycle. In this work global Level 3 CGAS-F15 products are used (Op-tical Depth Average), which are derived from Level 1 and Level 2 products, and are 20
averaged over a month, season or year. Level 3 product files contain AOD at 558 nm and the products are stored on a geographic grid of 0.5×0.5 degrees. A comparison over land and ocean with AERONET data showed that MISR AODs are within 0.05 or 20% of that of AERONET (Kahn et al., 2005, 2010). MISR AODs are obtained from https://wist.echo.nasa.gov/api/.
ACPD
10, 30731–30776, 2010Global and regional trends in aerosol
optical depth
A. de Meij et al.
Title Page
Abstract Introduction
Conclusions References
Tables Figures
◭ ◮
◭ ◮
Back Close
Full Screen / Esc
Printer-friendly Version Interactive Discussion
Discussion
P
a
per
|
Dis
cussion
P
a
per
|
Discussion
P
a
per
|
Discussio
n
P
a
per
|
2.1.3 MODIS
The MODerate resolution Imaging Spectro-radiometer (MODIS) has one camera, measuring radiances in 36 spectral bands, from 0.4 µm–14.5 µm with spatial reso-lutions of 250 m (bands 1–2), 500 m (bands 3–7) and 1000 m (bands 8–36). Daily Level 2 (MOD04) aerosol optical thickness data (550 nm) are produced on the spa-5
tial resolution of 10×10 km over land, using the 1 km×1 km cloud-free pixel size. The MODIS Level 2 product refers to a swath width of about 2330 km, therefore the instrument has almost daily global coverage. MODIS aerosol products are pro-vided over land (Kaufman et al., 1997) and water surfaces (Tanr ´e et al., 1997). In this work both Level 2 and global Level 3 (MOD08) Collection 005 products are 10
used (Optical Depth Land And Ocean Mean). The latter is derived from the statis-tics of the Level 2 products and stored on a 1×1 degree equal-angle grid in the MOD08 Level 3 product file. Reported MODIS aerosol uncertainties over land are
∆τ=±0.05±0.151∗AOD (Remer et al. 2008; Levy et al., 2010). There is no aerosol retrieval possible over bright surfaces, such as deserts and ice. MODIS AODs can be 15
obtained from https://wist.echo.nasa.gov/api/.
2.1.4 Emission inventories
In this study we use independent emission inventories to estimate the total sources of anthropogenic SO2, NOx, NH3 and BC for 1990, 1995, 2000, 2005 and 2010. Below a brief description of the emission inventories is given.
20
2.1.4.1 EMEP emission inventory
ACPD
10, 30731–30776, 2010Global and regional trends in aerosol
optical depth
A. de Meij et al.
Title Page
Abstract Introduction
Conclusions References
Tables Figures
◭ ◮
◭ ◮
Back Close
Full Screen / Esc
Printer-friendly Version Interactive Discussion
Discussion
P
a
per
|
Dis
cussion
P
a
per
|
Discussion
P
a
per
|
Discussio
n
P
a
per
|
each European country, complemented by expert judgments when incomplete or erro-neous data reports are detected. The 50 km×50 km emission inventory contains SO2, NOx, NH3, NMVOC, CO, PM2.5and PM10 for 11 CORINAIR source sectors (Vestreng et al., 2007, 2008).
2.1.4.2 REAS emission inventory
5
For Asia we use the anthropogenic emissions of SO2 and BC of the Region Emis-sion Inventory for Asia (REAS), Ohara et al. (2007), http://www.jamstec.go.jp/frcgc/ research/p3/emission.htm. The REAS inventory includes NOx, SO2, CO, BC, OC, CO2, N2O, NH3, CH4, and NMVOC from anthropogenic activities (combustion, non-combustion, agriculture, and others) on a 0.5◦×0.5◦resolution. Open biomass burning 10
is not included in REAS.
2.1.4.3 IPCC emission inventory
For North America and global sources of trace species we use the historical and pro-jected Intergovernmental Panel on Climate Change (IPCC) emission estimates, which include both anthropogenic and biogenic emissions. We use the Representative Con-15
centration Pathways (RCPs) 3-PD emission scenario (Vuuren et al., 2007), which is to be used in the IPCC 5th Assessment Report (AR5). This scenario is developed by the IMAGE modeling team of the Netherlands Environmental Assessment Agency. The number of the RCP scenario represents the radiative forcing level in 2100.
The IPCC emission inventory includes international shipping emissions; ship emis-20
sion totals for the year 2000 are taken from Table 3 of Eyring et al. (2010). Historical CO2 ship emission totals from 1850 to 2000 are based on the Second International Maritime Organization (IMO) GHG Study (Buhaug et al., 2009). Historical non-CO2 shipping emission totals are scaled backwards in time by using the IMO CO2emission time series. Aviation emissions are based on Lee et al. (2009). Sulfur emissions of all 25
ACPD
10, 30731–30776, 2010Global and regional trends in aerosol
optical depth
A. de Meij et al.
Title Page
Abstract Introduction
Conclusions References
Tables Figures
◭ ◮
◭ ◮
Back Close
Full Screen / Esc
Printer-friendly Version Interactive Discussion
Discussion
P
a
per
|
Dis
cussion
P
a
per
|
Discussion
P
a
per
|
Discussio
n
P
a
per
|
Black and organic carbon emissions of all other sectors, both historical and year 2000 emissions are from Bond et al. (2007). NOx and NH3 emissions of all other sectors are from Lamarque et al. (2010). The emissions estimates are provided on a 0.5◦×0.5◦ latitude/longitude resolution.
3 Results
5
In Sect. 3.1 we analyze global AOD trends by MODIS and MISR and we determine their significance. In Sect. 3.2 we analyze MODIS Level 3 and MISR Level 3 monthly mean AODs between 2000 and 2009 for 152 locations. In Sect. 3.3 we include the AERONET daily Level 2 products, followed by analyzing MODIS Level 2 data for three selected regions between 2000 and 2009 in Sect. 3.4. In the same section we explain 10
the increase or decrease in the AOD trends by analyzing the emission trends of SO2, NOx, NH3and BC for these three regions.
3.1 Global AOD trends by MODIS and MISR and their significance
In Fig. 2 the slopes of the linear trend per year of the global AOD between 2000 and 2009 for MODIS (a) and MISR (b) are presented, together with the difference based on 15
the slope of the AOD between 2000 and 2009 for the two instruments (c and d). The negative trends in the MODIS and MISR AODs between 2000 and 2009 are indicated in blue and the positive trends in red. Areas presented in white indicate that the annual AOD trend is insignificant, i.e. between−0.001 and 0.001 (Fig. 2a,b,e,f), the change in the AOD is between−0.02 and 0.02 (Fig. 2c,d), or no data is available (due to the limita-20
ACPD
10, 30731–30776, 2010Global and regional trends in aerosol
optical depth
A. de Meij et al.
Title Page
Abstract Introduction
Conclusions References
Tables Figures
◭ ◮
◭ ◮
Back Close
Full Screen / Esc
Printer-friendly Version Interactive Discussion
Discussion
P
a
per
|
Dis
cussion
P
a
per
|
Discussion
P
a
per
|
Discussio
n
P
a
per
|
−0.007/yr. MISR registers a decrease over parts of Europe and the eastern part of North America, however more to the west (e.g. parts over the Rocky Mountains and Canada) a positive trend is observed. The differences in AOD trends between MODIS and MISR could be related to i) the difference in cloud screening, ii) the number of days for obtaining global coverage (difference in swath width between the instruments results 5
in fewer data points by MISR to construct a monthly average). Analyzing the number of months for which AOD data is available, we see that MODIS has more valid months for which AODs are available than MISR over the eastern part of North America, Europe, Amazon Forest, Central Africa, Indonesia and South East Asia (not shown). iii) Diff er-ence in sampling coincider-ence, iv) the fact that MISR provides radiance measurements 10
at nine different viewing angles compared to one (nadir) on MODIS. This gives MISR greater sensitivity to thin aerosol layers, especially over bright land surfaces. Finally v) other algorithmic issues occur for MODIS and MISR (e.g., Levy et al., 2010; Kahn et al., 2010) that can also contribute to differences. For example, the current MISR al-gorithm does not account for mixtures of biomass burning and dust aerosols and tends 15
to overestimate AOD in such situations, whereas MODIS tends to overestimate AOD over bright surfaces (Kahn et al., 2009).
Over India and parts of China the changes in AOD are positive by MODIS and MISR, up to 0.2 (∼0.01/yr) in the northeastern part of China. Interesting is the increase in AODs by the two instruments over the Bay of Bengal and the Arabian Sea region (up 20
to 0.009/yr), which is in line with the study of Zhang and Reid (2010). They found increasing trends from MODIS data over the Bay of Bengal, Arabian Sea of 0.07 and 0.06 per decade, respectively. These increases can be explained by the transport of air pollution from the adjacent continents (Leon et al., 2001; Heymsfield and McFarquhar, 2001; Ramanathan et al., 2001a; Lelieveld et al., 2001).
25
ACPD
10, 30731–30776, 2010Global and regional trends in aerosol
optical depth
A. de Meij et al.
Title Page
Abstract Introduction
Conclusions References
Tables Figures
◭ ◮
◭ ◮
Back Close
Full Screen / Esc
Printer-friendly Version Interactive Discussion
Discussion
P
a
per
|
Dis
cussion
P
a
per
|
Discussion
P
a
per
|
Discussio
n
P
a
per
|
Here we determine the significance of these trends by analyzing global MODIS and MISR Level 3 products.
A trend is significant at a confidence level of 95% when|σω
ω|, whereωis the yearly trend estimate andσω is the standard deviation of the trend estimate. σω andωhave been estimated using the method of Weatherhead et al. (1998) and references therein. 5
In Fig. 2e,f we present the significance of the MODIS and MISR Level 3 AOD trend between 2001 and 2009 (only slopes >0.001) with confidence level >95%. We se-lected 2001 to have a full year of data, which is not the case for 2000. Over the Eastern USA and Europe the negative trend in the AODs is significant (blue), which appears to be related to the reduction of SO2 and NOx emissions, see Sect. 3.4. 10
Significant positive trends are found over the Bay of Bengal, Arabian Sea and the Arabian Gulf region (red, yellow) which are related to the transport of anthropogenic air pollution origination from the adjacent continental regions, as mentioned earlier. Over large parts of Asia (i.e. Northern India and Eastern China) no significant positive trends are found, which corroborates the AERONET trends based on Daily Level 2 15
data, and will be further discussed in Sect. 3.3. South of Hawaii both MODIS and MISR show a significant positive trend. Analyzing the temporal profile of the AOD around Hawaii, we see a strong increase in the AOD in March and April 2008. The reason for the increase is the eruption of the Kilauea volcano in Hawaii on March 19 2008. The eruption of the volcano led to a strong increase in SO2 and volcanic ash 20
emissions and consequently increasing AODs, which has been observed by satellites (http://earthobservatory.nasa.gov/NaturalHazards/view.php?id=19711&oldid=14759).
Over other regions such as the west coast of Southern Africa, Russia, Central Amer-ica, Central AfrAmer-ica, parts over the Atlantic Ocean and the northeastern part of Australia, significant AOD trends with a high confidence level (positive or negative) are observed, 25
ACPD
10, 30731–30776, 2010Global and regional trends in aerosol
optical depth
A. de Meij et al.
Title Page
Abstract Introduction
Conclusions References
Tables Figures
◭ ◮
◭ ◮
Back Close
Full Screen / Esc
Printer-friendly Version Interactive Discussion
Discussion
P
a
per
|
Dis
cussion
P
a
per
|
Discussion
P
a
per
|
Discussio
n
P
a
per
|
3.2 Regional AOD trends by MODIS and MISR
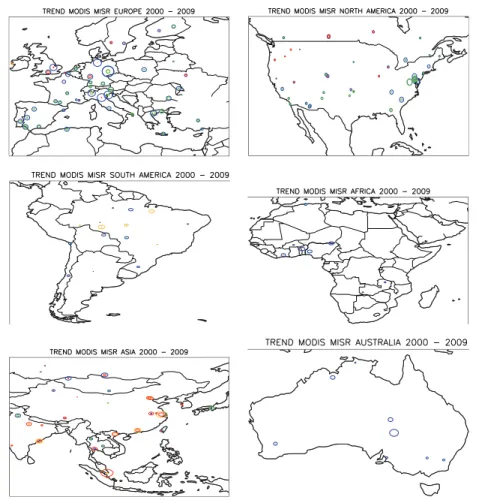
In this section we compare the AOD trends between MODIS and MISR Level 3 for the 152 locations, as presented in Fig. 1. The locations correspond with the locations of AERONET stations from which data will be used to compare the MODIS and MISR AOD trends in Sect. 3.2.
5
3.2.1 Europe
In Fig. 3 the slope of the linear AOD trend for each station is given. The diameter of the circle indicates the magnitude of the slope, see Table S1 of the electronic supplement. Blue and green circles represent negative trends by MODIS and MISR, respectively. Orange and red represent positive trends by MODIS and MISR, respectively. The 10
slope of the trend line is calculated from the linear regression of the AOD trend and the absolute difference of the AOD is the difference between the maximum and minimum value of the regression line.
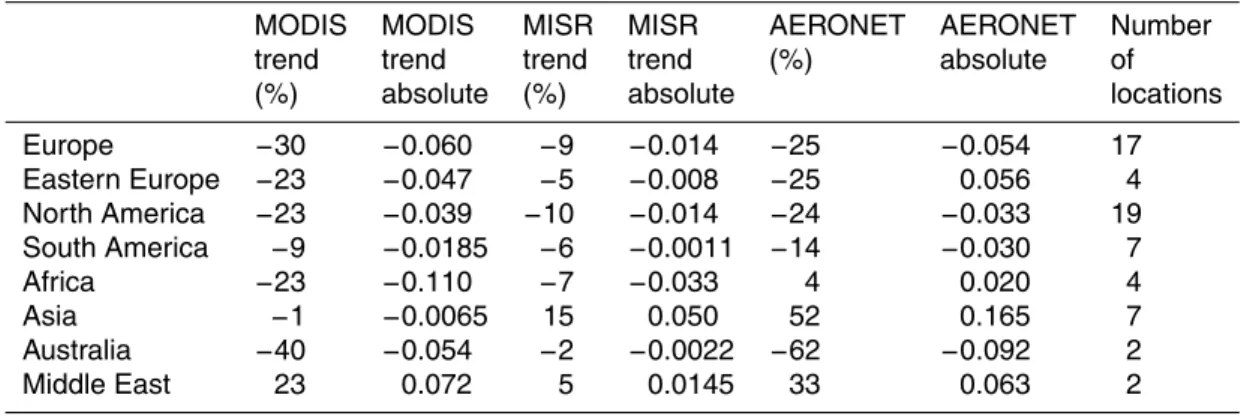
In general both MODIS and MISR show an overall negative AOD trend between 2000 and 2009 over Europe (46 locations) of −32% (−0.06 AOD, slope −4.72×10⁻⁴) and 15
−7% (−0.01 AOD, slope −1.30×10⁻⁴), respectively (Fig. 3a and Table 1). Comparing the AOD trend between MODIS and MISR we find that for∼83% of the locations the trends are similar (negative). MODIS shows a negative AOD trend for almost all the locations in Europe (except Mace Head, Ireland), whereas MISR shows a positive trend for 14 stations (Table S1). In general MODIS shows a larger negative trend than 20
MISR. An explanation for the observed AOD reductions could be a decrease of the anthropogenic emissions of SO2, NOx, NH3and BC and related pollutants, associated with the implementation of air pollution legislation (Sect. 3.3).
For the SMHI station in Norrkoping (SE) on May 2005 MISR produces an outlier in the AOD of 0.61, which is a factor 7 higher than the 10-year average, leading to 25
ACPD
10, 30731–30776, 2010Global and regional trends in aerosol
optical depth
A. de Meij et al.
Title Page
Abstract Introduction
Conclusions References
Tables Figures
◭ ◮
◭ ◮
Back Close
Full Screen / Esc
Printer-friendly Version Interactive Discussion
Discussion
P
a
per
|
Dis
cussion
P
a
per
|
Discussion
P
a
per
|
Discussio
n
P
a
per
|
too low for this station. For the stations in Eastern Europe, both MODIS and MISR show a negative trend, but for one location (Kiev) MISR indicates a positive trend of 17% (0.025 AOD). The differences in AOD trends between MODIS and MISR could be related to the difference in cloud screening and the number of days for obtaining global coverage, as mentioned earlier.
5
We clearly see a seasonal cycle with elevated AODs in the summer period (not shown). The reasons could be (i) the enhanced formation of secondary aerosols during summer, i.e. photochemical oxidation of SO2to sulfate and NOx to nitrate, (ii) aerosols from biomass burning (dry season), (iii) long-distance dust intrusions from the Saharan desert, and (iv) less efficient removal of aerosols by precipitation compared to the 10
winter. The contribution of Saharan dust to the total AOD is profound for the stations around the Mediterranean area during spring and summer (Dayan et al., 2008; De Meij and Lelieveld, 2010). In general MODIS AOD is higher than of MISR over land, which has been previously noted in other studies e.g., Abdou et al. (2005). Minimum monthly mean AODs are between 0.07 and 0.11.
15
Analyzing the MISR Level 3 single scattering albedo (SSA) for Forth Crete, Rome Tor Vergata, Lecce University, OHP observatoire, Birkenes, Xanthi, Bucarest and Tuz Gulu (for these stations substantial SSA data is available), we observe a generally positive trend in the SSA between 2000 and 2009. This indicates a decrease in sunlight ab-sorbing material (BC, dust). This could be explained by the increased implementation 20
of soot filters on diesel engine vehicles and the improvement of combustion technol-ogy. Only for Valladolid, Kiev and Moldova the trends in SSA are negative, indicating an increase in absorbing aerosols over these areas. Although these trends follow the expectation based on emission estimates, it is not recommended to draw strong con-clusions using MISR SSA products, because a limited selection of absorbing particles 25
ACPD
10, 30731–30776, 2010Global and regional trends in aerosol
optical depth
A. de Meij et al.
Title Page
Abstract Introduction
Conclusions References
Tables Figures
◭ ◮
◭ ◮
Back Close
Full Screen / Esc
Printer-friendly Version Interactive Discussion
Discussion
P
a
per
|
Dis
cussion
P
a
per
|
Discussion
P
a
per
|
Discussio
n
P
a
per
|
3.2.2 North America
For North America both MODIS and MISR show a decrease in the AOD, of −25% (−0.043 AOD, slope −3.42×10⁻⁴) and −13% (−0.017 AOD, slope −1.46×10⁻⁴), re-spectively (Table 1). For almost all locations (40) MODIS indicates a negative trend of which 27 are corroborated by the MISR measurements (Fig. 3b and Table S1). 5
Only for one location (Rimrock) MODIS shows a positive trend (7%, 0.006 AOD, slope 5.16×10⁻⁵). For 13 locations MISR shows a positive trend, of which some are signifi-cant. Both instruments indicate a negative trend over the eastern part of North Amer-ica. Again the deviations in slope (negative or positive) between MODIS and MISR could be related to differences in locations and sampling coincidences of the data used 10
to construct the monthly averages, and the cloud screening algorithms.
Also for North America we observe a seasonal cycle in the AOD (not shown), with peak values during summertime, similar to the cycle over Europe. Minimum AODs are between 0.05 and 0.10, which is somewhat lower than the minimum AODs found for Europe. Again, MODIS AOD is higher than of MISR. The negative trends by MODIS 15
and MISR are somewhat smaller than those over Europe.
For North America we have a sufficient MISR Monthly Level 3 data volume of SSA available for Biggs, Table Mountain, Oklahoma State University, Kellog LTER, Columbia Science Centre, Burtonsville, Calipso Wilston LK, Jones RC, Sioux Falls, and Los Alamos. Only for Biggs and Los Alamos the trends in SSA between 2000 and 2009 are 20
positive. This means that for all other locations relatively more light absorbing aerosols are found. This deviates from the overall trend in Europe.
3.2.3 South America
MODIS generally shows a negative trend of −11% (−0.020 AOD, slope−2.05×10⁻⁴) for the 15 locations considered, whereas MISR shows a small upward trend of 5% 25
ACPD
10, 30731–30776, 2010Global and regional trends in aerosol
optical depth
A. de Meij et al.
Title Page
Abstract Introduction
Conclusions References
Tables Figures
◭ ◮
◭ ◮
Back Close
Full Screen / Esc
Printer-friendly Version Interactive Discussion
Discussion
P
a
per
|
Dis
cussion
P
a
per
|
Discussion
P
a
per
|
Discussio
n
P
a
per
|
Foresta, Uberlandia Rio Branco and Tukuri. For Tukuri in December 2009 an outlier of 1.65 AOD occurs (not shown). By excluding this outlier the AOD trend becomes neg-ative. MISR shows a positive trend for ten locations, while for seven of them MODIS shows a negative trend. Both MODIS and MISR indicate high AODs (up to 1.6) be-tween August and October for Alta Foresta, Cuiaba-Miranda, Abracos Hill and Rio 5
Branco (not shown). Between August and October biomass burning (deforestation fires as well as sugar cane agricultural burning) lead to high AODs with peak values up to 1.0. Minimum AODs are observed during the wet season (November–May) when the aerosols are washed out from the atmosphere and burning is at minimum.
3.2.4 Africa
10
In general the AOD trends for the 8 locations in Africa by both MODIS (−18%;
−0.063 AOD, slope −5.0×10⁻⁴) and MISR (−6%; −0.023 AOD, slope −3.0×10⁻⁴) are negative, however for some stations the slope of the trend line is positive. Biomass burning is common practice in many regions in Africa, which is represented in the yearly cycles of high AODs ranging between 0.5 and 1.0 (not shown). High AODs are 15
observed by both satellite instruments for Djougou (Benin) in February-March, Lamto (Ivory Coast) in January–March, Ilorin (Nigeria) in January–March, Burkina Fasso in April–June, and Kasama (Zambia) in September-October.
3.2.5 Asia
The AOD trends in Asia derived from MODIS data are generally negative (−2%; 20
−0.007 AOD, slope −5.04×10⁻⁵) and for MISR positive (11%; 0.032 AOD, slope 2.69×10⁻⁴). Analyzing the trend for the 32 locations in Asia (Fig. 3e and Table 1), we see that MODIS shows a positive trend for 12 locations and MISR for 23 locations. The two instruments show the same sign for 18 locations (negative or positive). In Fig. 3e we see a strong positive trend for both instruments over the east coast of China 25
ACPD
10, 30731–30776, 2010Global and regional trends in aerosol
optical depth
A. de Meij et al.
Title Page
Abstract Introduction
Conclusions References
Tables Figures
◭ ◮
◭ ◮
Back Close
Full Screen / Esc
Printer-friendly Version Interactive Discussion
Discussion
P
a
per
|
Dis
cussion
P
a
per
|
Discussion
P
a
per
|
Discussio
n
P
a
per
|
circles (MISR). The likely reason is the growth of SO2and other pollutant emissions by industrial activities (Cofala et al., 2004; Streets and Waldhoff2000; Garg et al., 2000; Lei et al., 2010). More details are given in Sect. 3.4. For 11 stations in China we derive a generally upward AOD trend by MISR, and only for two stations the trends are negative Jingtai (−7%, −0.021 AOD) and Liangning (−4%, −0.008 AOD). MODIS 5
shows a negative trend for four locations, i.e. Asia1 (−18%, 0.006 AOD), Jingtai (−6%,
−0.021), Lhasa (−30%,−0.046) and Hefei (−3%,−0.025). For Dunhuang (CN) there is no data available for MODIS, because it is located in the desert of the Gansu province in China and the MODIS algorithm has difficulties in retrieving aerosol optical proper-ties over bright surfaces. For the stations in China MISR Monthly Level 3 SSA trends 10
are negative, indicating an increase in absorbing aerosols. The differences in AOD between MODIS and MISR could be related to e.g. the difference in cloud screening and sampling, as mentioned earlier.
The AOD trends in India are positive in four locations for both MODIS and MISR, and only for Chitkara (North-West India) the trend is negative. For Kanpur, Vishkhap-15
atnam, Chitkara and Gandhi College the AODs are high (decadal average>0.4), with peak values up to 1.53 by MODIS for Chitkara. In India power plants and associ-ated fossil fuel consumption by industry and additionally by transport are responsible for a strong increase in SO2 and other pollutant emissions (Garg et al., 2000). Uttar Pradesh, located in the north of India is the most highly populated state of the country 20
with about 190 million people. Emissions appear to be closely linked to the population growth (IPCC, 2007, WG1-AR4). Both MODIS and MISR indicate a positive trend for the stations Kanpur and Gandhi College, which are located in Uttar Pradesh province. Analyzing the MISR Monthly Level 3 SSA for Dharwar, Viskhapatnam, Chitkara, Kan-pur, Gandhi College indicates that only for Dharwar the SSA trend is negative. This 25
ACPD
10, 30731–30776, 2010Global and regional trends in aerosol
optical depth
A. de Meij et al.
Title Page
Abstract Introduction
Conclusions References
Tables Figures
◭ ◮
◭ ◮
Back Close
Full Screen / Esc
Printer-friendly Version Interactive Discussion
Discussion
P
a
per
|
Dis
cussion
P
a
per
|
Discussion
P
a
per
|
Discussio
n
P
a
per
|
Kanpur and the other stations, which corresponds with Dey and Di Girolamo (2010). They found that MISR overestimate SSA for India, because the current algorithm does not account for aerosol mixtures of BC and dust.
For the Siberian sites (Tomsk, Irkutsk and Yaktusk) MODIS registers negative trends (−1.47×10⁻⁴,−9.85×10⁻⁴ and −1.04×10⁻⁴, respectively), while MISR shows a pos-5
itive trends (4.80×10⁻⁵, 4.38×10⁻⁴ and 2.03×10⁻⁴, respectively). Both instruments are “blind” during winter, due to snow/ice (bright) surfaces and cloud cover. In Osaka (Japan) both instruments indicate a significant reduction in AOD, which is related to the reduction in emissions since the 1990s (Cofala et al., 2004; Nurrohim and Hiroshi, 2003). This reduction in AOD confirms the finding by Lu et al. (2010), who emphasized 10
the nationwide SO2reduction in Japan, in response to the national air pollution legis-lation. However, long-range transport of SO2from China can contribute to air pollution in Japan, possibly contributing to a slowdown of the negative trend (Lu et al., 2010).
The generally more negative trends shown by MODIS as compared to MISR at nearly all sites could be related to sampling differences between the two instruments (Zhang 15
and Reid, 2010).
On average MODIS AOD is a factor 1.4 higher than MISR AOD for Asia. The mini-mum AODs by MODIS range between 0.3 and 0.38, which is a factor 1.5 higher than the minimum AODs by MISR (0.2–0.3). MODIS collection 5 tends to overestimate AOD over bright surfaces (Levy et al., 2010). A low bias in MISR AOD appears for 20
AOD >∼0.4, and increases with increasing AOD (Kahn et al., 2005, 2010; Di Giro-lamo et al., 2004). Both the MODIS and MISR artifacts contribute to the systematic difference in trend magnitudes.
3.2.6 Australia
For Australia we examine 8 locations. On average MODIS indicates a negative trend 25
ACPD
10, 30731–30776, 2010Global and regional trends in aerosol
optical depth
A. de Meij et al.
Title Page
Abstract Introduction
Conclusions References
Tables Figures
◭ ◮
◭ ◮
Back Close
Full Screen / Esc
Printer-friendly Version Interactive Discussion
Discussion
P
a
per
|
Dis
cussion
P
a
per
|
Discussion
P
a
per
|
Discussio
n
P
a
per
|
and Jabiru (−2%,−0.002 AOD). For Canberra we observe in the MISR AOD an outlier of 0.563 on January 2005, while the 2000–2009 average is 0.052. Excluding the outlier changes the trend for Canberra from−5% to+20%. No MODIS data is available for Ting Tingana and Birdsville, because these locations are situated in the Strzelecki Desert and Simpson Desert, respectively and the MODIS algorithm does not retrieve 5
data over bright surfaces.
3.2.7 Middle East
s3.2.7
The number of locations in the Middle East is limited related to the difficulties of MODIS to observe aerosol optical properties over bright surfaces. For 2 stations in the 10
Middle East (Dhabi and Dhadnah) MODIS and MISR show significant positive trends in the AOD. For Nes Ziona (Israel) the trends by both instruments are negative, i.e.
−22% (−0.072 AOD, slope −5.67×10⁻⁴) for MODIS and −15% (−0.037 AOD, slope
−2.76×10⁻⁴) for MISR.
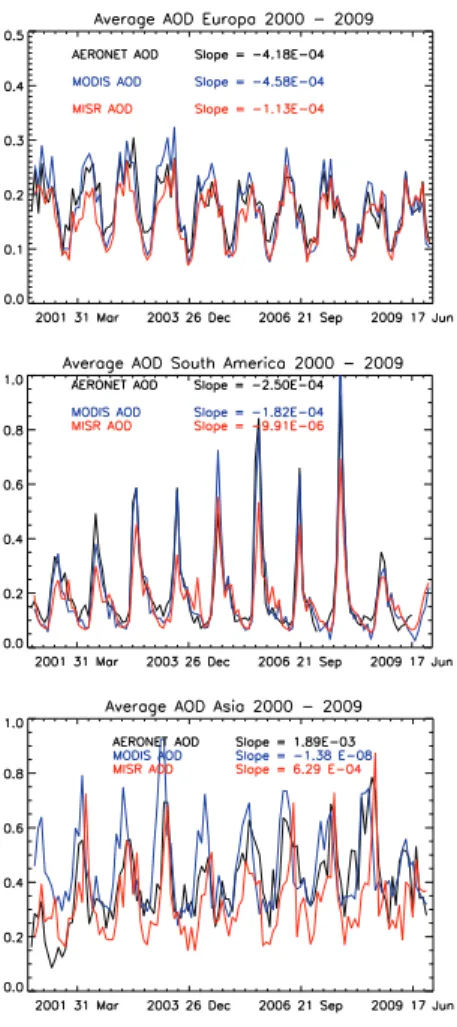
3.3 Global AOD trends by MODIS, MISR and AERONET
15
In this section we analyze the MODIS and MISR AOD trends between 2000 and 2009, together with the AERONET AODs. We selected the 62 locations for which the AERONET stations have at least 50 monthly mean data points. We compare MODIS and MISR AODs with AERONET, starting from the first month for which the AERONET station registers AOD. Therefore the number of months for which AOD data is available 20
for each station can differ. The locations are represented by red dots in Fig. 1.
3.3.1 Europe
ACPD
10, 30731–30776, 2010Global and regional trends in aerosol
optical depth
A. de Meij et al.
Title Page
Abstract Introduction
Conclusions References
Tables Figures
◭ ◮
◭ ◮
Back Close
Full Screen / Esc
Printer-friendly Version Interactive Discussion
Discussion
P
a
per
|
Dis
cussion
P
a
per
|
Discussion
P
a
per
|
Discussio
n
P
a
per
|
while the decrease by MISR is smaller (−9%; −0.014 AOD), see Table 1b. MODIS, MISR and AERONET show a negative AOD trend for all locations in Europe (Table S2), except for IMS-METU-ERDEMLI (Turkey). The seasonal cycles in the AOD are clearly discernable and can be related to photochemical oxidation processes, aerosol scav-enging by rain, biomass burning and dust transport, as mentioned earlier. Table S3 5
presents the MODIS, MISR and AERONET average AODs between 2000 and 2009, together with the standard deviations and the temporal correlation coefficients with AERONET and the number of months for which AOD data is available for each station. The decadal overall average of MODIS (0.185±0.074) is a factor 1.2 higher than of MISR (0.153±0.077) and 5% higher than of AERONET 0.176±0.062. The temporal 10
correlation coefficients with AERONET data are 0.72 and 0.54 for MODIS and MISR, respectively. For Eastern Europe the MODIS AOD (0.194±0.108) is again higher than of MISR (0.171±0.084), but corresponds very well with the average by AERONET (0.197±0.086).
In Table S4 we list the linear AOD trends for the AERONET stations, based on the 15
Daily Level 2 product and we compare these to the trends obtained with the Monthly Level 2 products. For 15 stations we derive a similar (negative) trend in the AOD. Only for Barcelona and Mainz the trends are positive for Daily Level 2. Note that the positive trends for these two stations are small (2%). For the East European stations the trends are similar and both AERONET Daily and Monthly Level 2 show a positive trend for the 20
IMS-METU-ERDEMLI station in Turkey.
3.3.2 North America
For North America (Fig. 4b) the general negative trend of−24% (−0.033) by AERONET corresponds well with the negative trend by MODIS (−23%, −0.039). The negative trend by MISR is −10% (−0.014). In the previous section we have seen that MODIS 25
ACPD
10, 30731–30776, 2010Global and regional trends in aerosol
optical depth
A. de Meij et al.
Title Page
Abstract Introduction
Conclusions References
Tables Figures
◭ ◮
◭ ◮
Back Close
Full Screen / Esc
Printer-friendly Version Interactive Discussion
Discussion
P
a
per
|
Dis
cussion
P
a
per
|
Discussion
P
a
per
|
Discussio
n
P
a
per
|
(10%; AOD 0.013). In general the decadal average by MODIS (0.150±0.077) is higher than MISR (0.125±0.075) and is a factor 1.25 higher than AERONET (0.120±0.065), and again the seasonal cycles are clearly discernable. The temporal correlation co-efficients with AERONET data are 0.66 and 0.62 for MODIS and MISR, respectively. Comparing the trend between Daily and Monthly AERONET Level 2 we see that for 5
all North American stations a similar trend in the AOD is found (positive or negative), except for Rimrock.
3.3.3 South America
Analyzing the trend for 7 locations in South America we find a negative trend for MODIS (−1.82×10⁻⁴,−0.019 AOD), MISR (−9.91×10⁻⁶,−0.001 AOD) and AERONET 10
(−2.50×10⁻⁴,−0.03 AOD). We derive a strong seasonal cycle in the AOD, related to emissions by biomass burning. For the 7 stations in South America the trends for AERONET Daily (Table S4) and Monthly Level 2 (Table S2) are similar, i.e. either neg-ative or positive. The temporal correlation coefficients with AERONET data are 0.75 for MISR and 0.82 for MODIS.
15
3.3.4 Africa
MODIS and MISR indicate an average negative trend of −0.11 (−23%) and −0.033 (−7%), respectively. These negative trends are not statistically robust, because of the limited number of stations for which we compare AODs (4). We see a strong seasonal cycle in the AODs, related biomass burning activities and dust events. For Blida the 20
trend is positive using AERONET Monthly Level 2 (Table S2), while for AERONET Daily Level 2 the trend is negative (Table S4). The reason is that in the Daily Level 3 AODs peak values of 1.2 are observed (caused by Saharan dust). These high values are not present in the Monthly mean Level 2 AODs (max is 0.46) and therefore their influence on the trend is less profound.
ACPD
10, 30731–30776, 2010Global and regional trends in aerosol
optical depth
A. de Meij et al.
Title Page
Abstract Introduction
Conclusions References
Tables Figures
◭ ◮
◭ ◮
Back Close
Full Screen / Esc
Printer-friendly Version Interactive Discussion
Discussion
P
a
per
|
Dis
cussion
P
a
per
|
Discussion
P
a
per
|
Discussio
n
P
a
per
|
3.3.5 Asia
The average trends for Asia over 2000–2009 derived from MODIS (−1%,−0.006 AOD), MISR (24%, 0.07 AOD) and AERONET (24%, 0.07 AOD) are generally positive. The difference in the trend for MODIS compared to the previous section is that the time span for which the AODs are analyzed is not the same, and we use fewer stations (7) for our 5
comparison. Here we compare the trends for the months for which we have AERONET data available. MODIS AODs are in general higher than MISR and AERONET AODs. For Kanpur, Beijing, Xianghe, Osaka, Anmyon the trends are similar for AERONET Daily and Monthly products, i.e. both either negative or positive. Only for Dalazanagad (MN) we see a small difference between the two data sets. The trend based on the 10
Monthly Mean product is less than−1% for this station.
For Australia we have only data available for Lake Argyle and Jabiru, which is insuf-ficient for a meaningful comparison.
Overall the AOD trends derived from MODIS, MISR Level 3and AERONET Level 2 data are similar (either negative or positive). As mentioned in the introduction the use 15
of monthly mean Level 3 data does not provide information about the sampling of the satellite products and the grid resolution is too coarse to accurately represent the loca-tion of the AERONET staloca-tion. Therefore we analyze in the next secloca-tion MODIS Level 2 data for three regions. MODIS Level 2 provides an AOD product on 10×10 km and has (almost) daily global coverage and the sampling times are known. The selected 20
regions are the Central Mediterranean, North-East USA and North-East China.
In summary, there is qualitative agreement among MODIS, AERONET, and MISR for the trends over the 10-year period in most regions examined. Negative trends appear for most of Europe and North-East America, whereas positive trends are generally found over India and parts of China. Note that MISR sampling is insufficient to draw 25
ACPD
10, 30731–30776, 2010Global and regional trends in aerosol
optical depth
A. de Meij et al.
Title Page
Abstract Introduction
Conclusions References
Tables Figures
◭ ◮
◭ ◮
Back Close
Full Screen / Esc
Printer-friendly Version Interactive Discussion
Discussion
P
a
per
|
Dis
cussion
P
a
per
|
Discussion
P
a
per
|
Discussio
n
P
a
per
|
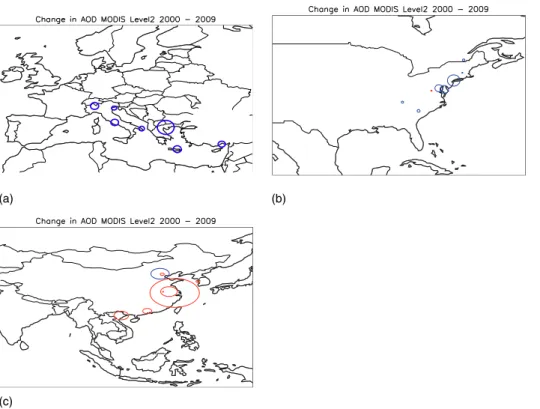
3.4 MODIS Level 2 AOD trend and pollution emissions
In this section we analyze the AOD trends from MODIS Level 2 product data for three regions, i.e. the Central Mediterranean (min/max longitude 5.0◦; 27.0◦; min/max latitude 34.0◦; 46.0◦), North-East America (min/max longitude−85.0◦;−70.0◦; min/max latitude 30.0◦; 47.0◦) and the eastern part of China (min/max longitude 103.0◦; 127.0◦; min/max 5
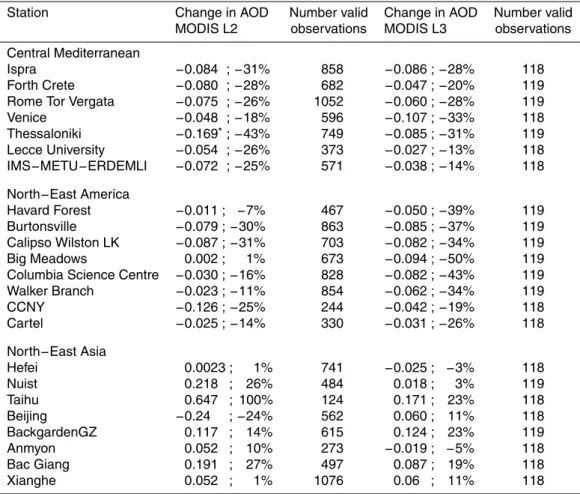
latitude 20.0◦; 44.0◦), which results in >10 000 data files per region. We analyze the AODs for the locations corresponding to AERONET stations, see Table 2. The numbers of valid observations are included in the table, which depend on the satellite overpass pattern and cloud free days.
3.4.1 Central Mediterranean
10
In Fig. 5a the change in MODIS Level 2 AOD between 2000 and 2009 is presented for 7 locations. Larger diameter circles represent stronger AOD trends. In Table 2 the actual change and the relative change of the regression line are given for the stations, together with the change in AOD for the Level 3 products. Comparing these changes in the AOD between Level 2 and Level 3, we note that for both product levels the changes 15
are negative and numbers are of the same magnitude. The number of successful AOD retrievals within the selected domain is lower closer to the boundary of the selected domain than at its center. Analyzing in Table S4 the trend of AERONET Daily Level 2 data for those stations for which substantial Daily Level 2 data is available within the domain of interest (Forth Crete, Rome Tor Vergata, Ispra, Venice and Lecce University) 20
we see that the trends are negative, which corroborates at least qualitatively the results from MODIS Level 2 data.
The decrease of the AOD (presumably mainly anthropogenic aerosols) coincides with the implementation of European air quality legislation to reduce the emissions of SO2 and other so-called criteria pollutants. Since 1990, the emissions of aerosol 25
ACPD
10, 30731–30776, 2010Global and regional trends in aerosol
optical depth
A. de Meij et al.
Title Page
Abstract Introduction
Conclusions References
Tables Figures
◭ ◮
◭ ◮
Back Close
Full Screen / Esc
Printer-friendly Version Interactive Discussion
Discussion
P
a
per
|
Dis
cussion
P
a
per
|
Discussion
P
a
per
|
Discussio
n
P
a
per
|
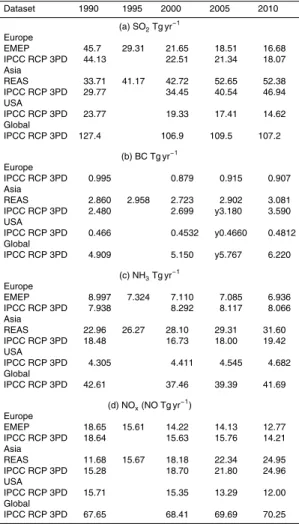
present in Table 3 the emissions of SO2, NOx, NH3 and anthropogenic black carbon (BC) for Europe, Asia, the USA and globally, for the years 1990, 1995, 2000, 2005 and 2010.
SO2 and BC are mainly emitted from fossil fuel (coal and petroleum) combustion. NOxis mainly emitted from road transport and fossil fuel combustion for energy produc-5
tion and NH3is mainly emitted from agricultural activities (waste burning and fertilizers) and to a small extent due to the combustion of biofuels for energy use. The amount of NH3 emitted by agricultural activities is related to the type of fertilizer, meteorological conditions (wet/dry) and soil properties.
Sulfate is produced by chemical reactions in the atmosphere from gaseous precur-10
sors. The main sulfate precursor is anthropogenic SO2. The oxidation of SO2in cloud liquid water by H2O2is very fast and is an important source (more than half) of the at-mospheric sulfate aerosol (Pandis and Seinfeld, 1989, Seinfeld and Pandis 1998; and references herein), see the reactions below:
SO2+H2O→HSO−3+H+ (R1)
15
HSO−3+H2O2↔SO2OOH−+H2O (R2)
SO2OOH−+H+→H2SO4 (R3)
The sulfate produced in reaction 3 can react with ammonia to form ammonium sulfate aerosol according to the reaction:
H2SO4+2NH3→(NH4)2SO4 (R4)
20
The production of nitrate aerosol (ammonium nitrate) results from the combination of NOxand NH3emissions and their atmospheric reactions.
Reactions (R5–R7) show how NO−3 aerosol formation is related to both NOxand NH3 emissions. Firstly, nitric acid is produced in the gas phase:
NO2(g)+OH(g)+M→HNO3(g)+M (R5)
ACPD
10, 30731–30776, 2010Global and regional trends in aerosol
optical depth
A. de Meij et al.
Title Page
Abstract Introduction
Conclusions References
Tables Figures
◭ ◮
◭ ◮
Back Close
Full Screen / Esc
Printer-friendly Version Interactive Discussion
Discussion
P
a
per
|
Dis
cussion
P
a
per
|
Discussion
P
a
per
|
Discussio
n
P
a
per
|
and during the night by
NO2(g)+NO3(g)→N2O5 (R6)
The hydrolysis of N2O5 on wet aerosol surfaces is an important pathway to convert NOxinto HNO3(Dentener and Crutzen, 1993; Riemer et al., 2003):
N2O5(g)+H2O→2HNO3 (R7)
5
If sufficient ammonia is available to neutralize all sulfate, the residual amount of ammonia can neutralize nitric acid to form the ammonium nitrate aerosol:
NH3(g)+HNO3(g)↔NH4NO3(aq,s) (R8)
Note that React. (8) is reversible. The distribution of ammonium nitrate between the gas and the aerosol phase strongly depends on the temperature and relative humidity 10
(Seinfeld and Pandis 1998, and references therein).
The IPCC estimated SO2, NOx, NH3 and BC emissions in Table 3 for Europe are calculated for the same domain for which the EMEP and REAS emissions are given. We clearly see in the EMEP inventory a decrease in the SO2emissions for Europe from 21.65 Tg (2000) to 16.68 Tg (2010), which is a reduction of 23%. A similar reduction of 15
20% is calculated by IPCC AR5 3PD. The reduction given by EMEP between 1990 and 2010 is significant,−29.02 Tg (−64%). As mentioned before, EMEP does not include BC emissions. Therefore we analyze in Table 3 the BC emissions of the IPCC AR5 inventory. For Europe between 1990 and 2000, IPCC AR5 3PD shows a reduction (−0.114 Tg, −11%) in the BC emissions; however, between 2000 and 2010 a small 20
increase (0.028 Tg, 3%) is indicated. NOxemissions are∼10% (1.45 Tg) lower in 2010 compared to 2000. This reduction largely results from policy and technology realized in road transport (e.g. catalytic converters). Between 2000 and 2010 NH3emissions in the EMEP inventory have declined (−2.5%) due to the recent NH3emission abatement measures to combat eutrophication problems in Northwestern Europe.
ACPD
10, 30731–30776, 2010Global and regional trends in aerosol
optical depth
A. de Meij et al.
Title Page
Abstract Introduction
Conclusions References
Tables Figures
◭ ◮
◭ ◮
Back Close
Full Screen / Esc
Printer-friendly Version Interactive Discussion
Discussion
P
a
per
|
Dis
cussion
P
a
per
|
Discussion
P
a
per
|
Discussio
n
P
a
per
|
3.4.2 North-East America
In Fig. 5b and Table 2 the trend of MODIS Level 2 AOD for 8 stations is presented. For 7 stations the trends are negative and for 1 station (Big Meadows) the trend is slightly positive (1%). The MODIS Level 3 trends for all 8 stations are negative and in gen-eral somewhat larger than for Level 2. For North-East USA we have three AERONET 5
stations for which substantial Daily Level 2 data is available within the domain of in-terest, i.e. Walker Branch (1340 days), Cartel (1131 days) and CCNY (1208 days), see Table S4. For these three stations the trend in the AOD is negative, which corresponds with MODIS Level 2. Analyzing the AOD trend of AERONET Daily Level 2 for North America in Table S4, we see that for the majority of the 18 stations the trends are 10
negative (13 in total). Only for Bratts Lake (Canada, Saskatchewan), Railroad Valley (Nevada) and Rimrock (Idaho) the trends are positive.
The explanation of the general AOD reduction in North America is related to the Clean Air Act Amendments of 1990, which have led to a reduction of SO2 and NOx emissions. In Table 3 we see that the IPCC AR5 3PD inventory for the USA indicates 15
a decrease of−4.71 Tg (−24%) in the SO2 emissions between 2000 and 2010. This is similar and a continuation of the decrease between 1990 and 2000 (−4.44 Tg). NOx emissions between 2000–2010 decrease by−22% (−3.35 Tg) for the IPCC AR5 3PD inventory. Anthropogenic BC emissions are similar to those in Europe, somewhat in-creasing over the USA between 2000 and 2010, 0.028 Tg (6%).
20
3.4.3 East Asia
In Fig. 5c, we focus on East Asia by analyzing the AOD trends for 8 stations (Table 2). For 7 stations the MODIS Level 2 trends are positive (Hefei, Nuist, Taihu, Backgar-den GZ, Anmyon, Bac Giang and Xianghe), and only for Beijing the trend is negative (−0.24 AOD). Interesting is the difference between Xianghe (+0.052 AOD) and Beijing 25
ACPD
10, 30731–30776, 2010Global and regional trends in aerosol
optical depth
A. de Meij et al.
Title Page
Abstract Introduction
Conclusions References
Tables Figures
◭ ◮
◭ ◮
Back Close
Full Screen / Esc
Printer-friendly Version Interactive Discussion
Discussion
P
a
per
|
Dis
cussion
P
a
per
|
Discussion
P
a
per
|
Discussio
n
P
a
per
|
for Xianghe (1076) is almost a factor 2 higher than for Beijing (562). A possible expla-nation for this may be that the Xianghe station is located in a rural area. Because of the location, the MODIS dark-target aerosol retrieval algorithm (Remer et al., 2005) allows more successful retrievals with higher accuracy. The trend in AOD of Daily Level 2 AERONET data in Table S4 also shows a negative trend for Beijing (−0.076). For Xi-5
anghe the AERONET Daily Level 2 trend is positive (0.030 AOD), which corroborates the MODIS Level 2 trend (0.052 AOD). The small negative/positive recent trends in China may be related to the implementation of the 11th Five Year Plan (2006–2010) of State Environment Protection Administration (SEPA), which requires power plants to implement new air pollution reduction technologies after 2006. This implies that 10
even though industrial and urban activities leading to air pollution continue to increase, decreasing emissions factors to some degree offset the emission trends.
Comparing the MODIS Level 2 trends with Level 3, we see that the trend is different for three stations (Hefei, Beijing and Anmyon). One of the reasons could be that the number of successful retrievals in the Level 3 data is not sufficient, but as we do not 15
have access to the actual sampling time of MODIS Level 3 data, it remains unclear why differences in the trends are found for these three stations.
Analyzing the emission trends of SO2, NOx, NH3 and BC over Asia helps explain the general upward trends over China and India. Half of China’s SO2 emissions are attributed to the burning of coal, mostly by power plants, which are to a large degree 20
located in the eastern part of the country where the large cities are situated. Between 2001 and 2005, SO2 emissions still increased by 27% (11th Five Year Plan, SEPA, March 2006). Lu et al. (2010) found an increase in SO2 of 53% between 2000 and 2006, with 85% in the north and 28% in the south of the country. SO2 emissions in China do not show a strong seasonal cycle (Zhang et al., 2009), because of the 25
continual energy production for industry and domestic usage.
ACPD
10, 30731–30776, 2010Global and regional trends in aerosol
optical depth
A. de Meij et al.
Title Page
Abstract Introduction
Conclusions References
Tables Figures
◭ ◮
◭ ◮
Back Close
Full Screen / Esc
Printer-friendly Version Interactive Discussion
Discussion
P
a
per
|
Dis
cussion
P
a
per
|
Discussion
P
a
per
|
Discussio
n
P
a
per
|
(Streets and Waldhoff, 2000). Most of the BC emissions in China (mainly in the ru-ral areas) are caused by residential combustion of coal and biofuels for heating and cooking purposes (Streets et al., 2001; Bond et al., 2004; Lei et al., 2010).
The IPCC SO2, NOx, NH3and anthropogenic BC emissions in Table 3 for Asia are calculated for the same domain for which the REAS emissions are given. For Asia 5
the REAS inventory indicates an increase in SO2emissions between 2000 and 2010 of 9.66 Tg (23%), which is somewhat lower than by IPCC AR5 3PD (12.49 Tg, 36%). Yet the increase between 1990 and 2010 is similar for REAS (18.67 Tg, 55%) and IPCC AR5 3PD (17.17 Tg, 58%). A recent study by Lu et al. (2010) estimated a strong increase in SO2 emissions over China after 2000 of 53%, with an annual growth rate 10
of 7.3%. The growth slowed after 2006, due to the implementation of new emission reduction technologies (i.e. desulfurization) in power plants. In Table 3 we see that 44% of the total global SO2 emissions in 2010 originate from Asia (IPCC AR5 3PD). This percentage is even higher for anthropogenic BC (57%). IPCC AR 3PD shows an increase in the anthropogenic BC emissions of 0.891 Tg (33%) between 2000 and 15
2010, which is a factor 2.5 higher than indicated by REAS (0.358 Tg 13%). Interesting to see is the decrease between 1990 and 2000 by REAS (−0.137 Tg,−5%).
REAS estimates an increase in NOx emissions between 2000–2010 of 37% (6.77 Tg), which is similar to the increase calculated by IPCC AR 3PD (6.26 Tg). Zhang et al. (2009) found an increase in NOxemissions of 57% between 2000–2005 in China. 20
The strong increase in SO2and NOx emissions in East Asia are mainly caused by the strong increase of fossil fuel combustion to generate electricity and by road transport. REAS calculates an increase in NH3emissions of 13% (3.5 Tg), which is due to an in-crease in fertilizer application (Klimont, 2001). This differs from Europe where livestock is the dominant source of NH3.
25