AMTD
6, 159–259, 2013The Collection 6 MODIS aerosol products over land
and ocean
R. C. Levy et al.
Title Page
Abstract Introduction
Conclusions References
Tables Figures
◭ ◮
◭ ◮
Back Close
Full Screen / Esc
Printer-friendly Version
Interactive Discussion
Discussion
P
a
per
|
Dis
cussion
P
a
per
|
Discussion
P
a
per
|
Discussio
n
P
a
per
Atmos. Meas. Tech. Discuss., 6, 159–259, 2013 www.atmos-meas-tech-discuss.net/6/159/2013/ doi:10.5194/amtd-6-159-2013
© Author(s) 2013. CC Attribution 3.0 License.
Atmospheric Measurement Techniques Discussions
This discussion paper is/has been under review for the journal Atmospheric Measurement Techniques (AMT). Please refer to the corresponding final paper in AMT if available.
The Collection 6 MODIS aerosol products
over land and ocean
R. C. Levy1,2, S. Mattoo1,2, L. A. Munchak1,2, L. A. Remer3, A. M. Sayer2,4, and N. C. Hsu2
1
Science Systems and Applications, Inc, Lanham, MD 20709, USA
2
Earth Science Division, NASA Goddard Space Flight Center, Greenbelt, MD 20771, USA
3
JCET, University of Maryland – Baltimore County, Baltimore, MD 21228, USA
4
Goddard Earth Sciences Technology And Research (GESTAR), Columbia, MD, USA Received: 21 November 2012 – Accepted: 27 November 2012 – Published: 4 January 2013 Correspondence to: R. C. Levy ([email protected])
AMTD
6, 159–259, 2013The Collection 6 MODIS aerosol products over land
and ocean
R. C. Levy et al.
Title Page
Abstract Introduction
Conclusions References
Tables Figures
◭ ◮
◭ ◮
Back Close
Full Screen / Esc
Printer-friendly Version
Interactive Discussion
Discussion
P
a
per
|
Dis
cussion
P
a
per
|
Discussion
P
a
per
|
Discussio
n
P
a
per
|
Abstract
The twin Moderate Imaging resolution Spectroradiometer (MODIS) sensors have been flying on Terra since 2000 and Aqua since 2002, creating an incredible dataset of global Earth observations. Here, we introduce the Collection 6 (C6) algorithm to re-trieve aerosol optical depth (AOD) and aerosol size parameters from MODIS-observed
5
spectral reflectance. While not a major overhaul from the previous Collection 5 (C5) version, there are enough changes that there is significant impact on the products and their interpretation. The C6 algorithm is comprised of three sub-algorithms for re-trieving aerosol properties (1) over ocean (dark in visible and near-IR wavelengths), (2) over vegetated/dark-soiled land (dark in the visible) and (3) over desert/arid land
10
(bright in the visible). Here, we focus on the changes to both “dark target” algorithms
(#1 and #2; DT-ocean and DT-land). Affecting both DT algorithms, we have updated
assumptions for central wavelengths, Rayleigh optical depths and gas (H2O, O3, CO2,
etc.) absorption corrections, and relaxed the solar zenith angle limit (up to ≤84◦) to
increase pole-ward coverage. For DT-land, we have updated the cloud mask to
al-15
low heavy smoke retrievals, fine-tuned the assignments for aerosol type as function of season/location, corrected bugs in the Quality Assurance (QA) logic, and added di-agnostic parameters such topographic altitude. For DT-ocean, improvements include a revised cloud mask for thin-cirrus detection, inclusion of wind speed dependence in the retrieval, updates to logic of QA Confidence flag (QAC) assignment, and additions
20
of important diagnostic information. All together, the changes to the DT algorithms re-sult in reduced global AOD (by 0.02) over ocean and increased AOD (by 0.01) over land, along with some changes in spatial coverage. Preliminary validation shows that compared to surface-based sunphotometer data, the C6 DT-products should compare at least as well as those from C5. However, at the same time as we have introduced
25
AMTD
6, 159–259, 2013The Collection 6 MODIS aerosol products over land
and ocean
R. C. Levy et al.
Title Page
Abstract Introduction
Conclusions References
Tables Figures
◭ ◮
◭ ◮
Back Close
Full Screen / Esc
Printer-friendly Version
Interactive Discussion
Discussion
P
a
per
|
Dis
cussion
P
a
per
|
Discussion
P
a
per
|
Discussio
n
P
a
per
To satisfy users’ desires for more complete global aerosol coverage, C6 will include a merged DT/DB product over semi-arid land surfaces. In addition to changes to aerosol retrieval, C6 will include diagnostic information about clouds in the aerosol field, such as an aerosol “cloud mask” at 500 m resolution, and products that describe the “dis-tance to the nearest cloud” from clear pixels. Finally, responding to the needs of the air
5
quality community, in addition to the standard 10 km product, C6 will include a global (DT-land and DT-ocean) aerosol product at 3 km resolution.
1 Introduction
Aerosols, the small, suspended liquid and solid particles in the atmosphere, are im-portant components of Earth’s climate system. Among their many roles, they force the
10
global energy budget (IPCC, 2007), drive the hydrological cycle (Koren et al., 2011), and in large concentrations are detrimental to human health (Pope III et al., 2002).
Characterizing aerosol global distribution and changes over time are necessary for understanding present and possible future climate conditions (e.g., IPCC, 2007). To-wards these goals, NASA has deployed a suite of satellites known as the Earth
Ob-15
servation System (EOS) to monitor a number of important climate properties, includ-ing aerosols. Two of these EOS-era satellite sensors are the twin MODerate resolu-tion Imaging Spectroradiometers (MODIS, Salomonson, 1989), which have been fly-ing in polar orbit on Terra since 2000 and Aqua since 2002 (Remer et al., 2008).
MODIS’s wide spectral range (0.41 µm to 14.5 µm in 36 channels or bands), broad
20
swath (2330 km) and relatively fine spatial resolution (1 km or less depending on band) permit accurate and useful retrieval of aerosol optical depth over land, and aerosol optical depth and particle size parameter over ocean (Remer et al., 2005; Levy et al., 2007a, 2010). Aerosol retrieval is performed operationally (within 1–2 days) of satellite overpass, and is made possible by a large team of scientists and engineers. Retrieved
25
AMTD
6, 159–259, 2013The Collection 6 MODIS aerosol products over land
and ocean
R. C. Levy et al.
Title Page
Abstract Introduction
Conclusions References
Tables Figures
◭ ◮
◭ ◮
Back Close
Full Screen / Esc
Printer-friendly Version
Interactive Discussion
Discussion
P
a
per
|
Dis
cussion
P
a
per
|
Discussion
P
a
per
|
Discussio
n
P
a
per
|
In addition to providing useful information to the climate community, the instrument’s 2330 km swath enables nearly global coverage every day, which makes the operational aerosol product attractive for near real time monitoring of aerosol (Al Saadi et al., 2005; Koren and Kaufman, 2004). The spatial resolution and repeatability lends to ample statistics for a variety of other applications (Stier et al., 2005; Yu et al., 2006; Kaufman
5
et al., 2005).
Because the operational MODIS aerosol product is so important to so many
applica-tions, its continued usefulness requires a consistent effort to upgrade (better products)
while maintaining its integrity (keeps working) and usability (user relearning not re-quired). Our so-called “maintenance and modest improvement” includes streamlining
10
the science codes, updating the processing environment along with new computer ma-chinery, and improving the user experience when accessing and analyzing the data. It also includes, where possible, making such improvements that will increase the global accuracy and coverage of the product, without severely sacrificing regional and local accuracy.
15
The last major update of the dark-target aerosol product was implemented in
early 2006, marking the start of Collection 5 (C5). Through validation efforts (e.g.,
Re-mer et al., 2008; Levy et al., 2010), assimilation studies (e.g., Hyer et al., 2011; Zhang and Reid et al., 2010), and other work since 2006 (e.g., Br ´eon et al., 2011), the C5 aerosol algorithm and products have been evaluated in detail. We have learned the
20
conditions in which the retrieval and products have performed well, but also conditions in which the product has fallen short of expectations. From our experience when transi-tioning from Collection 4 (C4) to C5, we learned that we should not apply a new aerosol algorithm without completely understanding the upstream activity (e.g., calibration and cloud masking). At this point in time (fall 2012), as part of the collective MODIS science
25
AMTD
6, 159–259, 2013The Collection 6 MODIS aerosol products over land
and ocean
R. C. Levy et al.
Title Page
Abstract Introduction
Conclusions References
Tables Figures
◭ ◮
◭ ◮
Back Close
Full Screen / Esc
Printer-friendly Version
Interactive Discussion
Discussion
P
a
per
|
Dis
cussion
P
a
per
|
Discussion
P
a
per
|
Discussio
n
P
a
per
instruments. C6 will represent a continuous consistent data record spanning more than a decade for each satellite.
In addition, in response to the air quality community’s need for high resolution aerosol retrieval in urban and suburban locations (e.g., Li et al., 2005), the C6 product will not only include the standard 10 km aerosol retrieval product (Remer et al., 2005) but also
5
global products at 3 km (Remer et al., 2012).
This paper is intended to introduce the community to the C6 aerosol algorithm and products by documenting the changes from C5 to C6. Note that C6 not only repre-sents an update to the aerosol algorithm but also an update to all MODIS algorithms, including the calibration and cloud masking algorithms that produce the inputs to the
10
aerosol algorithm. Even if the aerosol algorithms were to remain unchanged, the global
aerosol product will be different because the inputs are different. Therefore, we focus
on the changes to the aerosol algorithms, but take into account the expected changes to the inputs. When we say “aerosol algorithm”, we mean the union of the “dark target” algorithms, last described by Remer et al. (2005) over ocean, and Levy et al. (2007a,
15
b) over land. In general, the theory and science of the dark-target algorithm is rela-tively unchanged from C5, however, there are major changes to how data “confidence” or Quality Assurance (QA) is assigned (Hubanks et al., 2012). Obsolete parameters have been deleted from the product files, whereas new diagnostic parameters have been added. The result is more information available to recreate the conditions of the
20
retrieval and for the user to determine what may have gone awry.
This paper can be thought of as a sort of narrative “travel-log”, documenting the many changes made in upgrading from C5 to C6. In general, the changes can be
sep-arated into four categories: (a) modifications to the retrieval that will produce different
values for the same parameters (b) additions and deletions to the list of available
pa-25
AMTD
6, 159–259, 2013The Collection 6 MODIS aerosol products over land
and ocean
R. C. Levy et al.
Title Page
Abstract Introduction
Conclusions References
Tables Figures
◭ ◮
◭ ◮
Back Close
Full Screen / Esc
Printer-friendly Version
Interactive Discussion
Discussion
P
a
per
|
Dis
cussion
P
a
per
|
Discussion
P
a
per
|
Discussio
n
P
a
per
|
In addition, there are a number of seemingly small details that have been modified or updated for C6 aerosol retrieval, especially in regard to cloud-masking and other issues of pixel selection. However, although these details are small, they may have systematic or even dramatic impacts to the products. It is also important to document these details. However, in the interest of the more casual reader, many of these details
5
can be found in the Appendix.
In Sect. 2, we describe the MODIS Dark Target (DT)-algorithm, its history and our standard methods for evaluation. In Sect. 3, we describe changes to the DT algorithm and products for C6, divided into: changes to the overall assumptions (3.1), changes specifically for DT-land (3.2) and DT-ocean (3.3), changes to combined land and ocean
10
(3.4), new DT products (3.5) and the Deep Blue (DB)-DT merge products (3.6). Sec-tion 4 is devoted to the new L3 aggregaSec-tion protocol. SecSec-tion 5 introduces a new, paral-lel aerosol product at higher (3 km) resolution. In Sect. 6, we show how global products are expected to change in relation to intended upgrades to L1B product calibration. In Sect. 7, we discuss how we intend to use the MODIS product to help transition to future
15
satellite data products.
2 MODIS aerosol retrieval
2.1 MODIS terminology, specifications and basic retrieval ideas
This section introduces the MODIS terminology and retrieval methodology, to provide a baseline so we can describe the updates for C6.
20
MODIS observes a swath approximately 2330 km wide, and makes between 14 and 15 orbits per day. For ease of processing and data storage, MODIS data are organized
into 5-minute swath segments calledgranules (288 per day), which are composed of
1354 by 2030 pixels at nominal 1 km resolution (near nadir). The fundamental MODIS file is called Level 0 (L0) and refers to raw counts from the sensor’s detectors; when
25
AMTD
6, 159–259, 2013The Collection 6 MODIS aerosol products over land
and ocean
R. C. Levy et al.
Title Page
Abstract Introduction
Conclusions References
Tables Figures
◭ ◮
◭ ◮
Back Close
Full Screen / Esc
Printer-friendly Version
Interactive Discussion
Discussion
P
a
per
|
Dis
cussion
P
a
per
|
Discussion
P
a
per
|
Discussio
n
P
a
per
data, providing geolocated radiances or reflectances, and these L1B data are the in-puts to the MODIS geophysical retrieval algorithms, including aerosol. The resulting geophysical products (in 5 min granules) are designated as Level 2 (L2). Level 3 (L3) refers to daily and monthly statistics of the geophysical products, organized on to a
1◦ by 1◦ latitude/longitude grid (King et al., 2003). Note that these products are
pro-5
cessed in a linear fashion (L0→L1A→L1B→L2→L3), and that some L2 products
are used as inputs for other “downstream” L2 products. This is true in the case of aerosol retrieval, which is a L2 product that requires the existence of other L2 prod-ucts. All MODIS data products (from L1 onward) are provided in Hierarchal Data For-mat Files (HDF), and are labeled MODXX for Terra and MYDXX for Aqua. Each HDF
10
file provides meta-data and data in parameters known as Scientific Data Sets (SDSs).
SDSs may be multi-dimensional (e.g., length×width×bands).
L2 aerosol product files are known as MOD04 (Terra) and MYD04 (Aqua), collec-tively denoted here as MxD04 files. Retrieval of the MxD04 product requires input L1B files, L2 files, and ancillary data provided by NOAA/NCEP. L1B files include the
15
nominal 1 km, 0.5 km, and 0.25 km reflectance products (MxD021KM, MxD02HKM and MxD02QKM), and the 1 km geo-location product (MxD03). For L2, both the “cloud-mask” (MxD35 L2) and “atmospheric profile” (MxD07 L2) are required. Ancillary data
are at 1◦ ×1◦ resolution, and are the closest 6-hourly, meteorological reanalysis from
the Global Data Assimilation Model (GDAS) and the daily ozone reanalysis from Total
20
Ozone Analysis using SBUV/2 and TOVS (TOAST). The aerosol retrieval fails if any one of these input files is missing.
MODIS experiences the so-called “bowtie effect” (http://eoweb.dlr.de:8080/short
guide/D-MODIS.html), which means that nominal pixel size increases from nadir
(1.0×1.0 km) to swath edges (4.8×2.0 km). Thus, the 1354 pixel-wide granule
rep-25
resents a 2330 km wide swath. Since MxD04 is not gridded, the product spatial reso-lution also increases toward swath edges. Standard MxD04 files (MxD04 L2) have a
nominal spatial resolution of 10×10 km at nadir, but increase to 48×20 km near the
AMTD
6, 159–259, 2013The Collection 6 MODIS aerosol products over land
and ocean
R. C. Levy et al.
Title Page
Abstract Introduction
Conclusions References
Tables Figures
◭ ◮
◭ ◮
Back Close
Full Screen / Esc
Printer-friendly Version
Interactive Discussion
Discussion
P
a
per
|
Dis
cussion
P
a
per
|
Discussion
P
a
per
|
Discussio
n
P
a
per
|
1◦×1◦ grid, and are denoted as MxD08 D3 (daily), MxD08 E3 (8-day) and MxD08 M3
(monthly). Note that aerosol products are bundled with other atmospheric products (clouds and water vapor) in these L3 files (King et al., 2003).
The MODIS aerosol retrieval algorithms are maintained and updated by the MODIS aerosol science team. The operational MODIS retrieval data are produced and
5
archived by the MODIS Distribution and Algorithm Development Support (MODAPS; http://modaps.nascom.nasa.gov/services/), and are available online (http://ladsweb. gsfc.nasa.gov). MODIS calibration is supported by the MODIS Characterization Sup-port Team (MCST; http://mcst.gsfc.nasa.gov). The quality and accuracy of downstream retrieved products (including aerosol) is dependent on the accuracy of the calibration of
10
the algorithm’s input radiances, which the MCST reports accuracy of±2–3 % for typical
situations (Xiong et al., 2005, 2007).
2.2 Basic concepts of the MODIS aerosol retrieval algorithms
The MODIS aerosol algorithms have been in development for over 20 yr, well before the launch of Terra. These algorithms were designed to capitalize on the wide spectral
15
range of the MODIS instrument. The primary assumption is that in a clear-sky (non
cloudy) scene, the solar radiation backscattered from aerosols have different spectral
signatures than either the Earth’s surface or atmospheric molecules. By using multiple bands in the visible, near-IR, and IR wavelength regions, one can perform a retrieval to back out the aerosol signature, and infer the physical properties of the aerosols within
20
the scene. Of course, the devil is in the details, and since the Earth’s surface, molecular atmosphere and aerosols do not have entirely independent spectral signatures, the MODIS retrieval must make observational and physically based assumptions.
To that end, the operational MODIS aerosol retrieval algorithms are actually three separate algorithms; each requires separate assumptions about the Earth’s surface
25
AMTD
6, 159–259, 2013The Collection 6 MODIS aerosol products over land
and ocean
R. C. Levy et al.
Title Page
Abstract Introduction
Conclusions References
Tables Figures
◭ ◮
◭ ◮
Back Close
Full Screen / Esc
Printer-friendly Version
Interactive Discussion
Discussion
P
a
per
|
Dis
cussion
P
a
per
|
Discussion
P
a
per
|
Discussio
n
P
a
per
dark-target (DT) algorithms because they operate best on regions that are “dark” vi-sually. The third algorithm, developed well after launch, is known as the Deep-Blue (DB) algorithm (Hsu et al., 2004, 2006), and was originally designed for application over bright-desert regions. Although these surfaces appear “bright” visually, they are actually fairly dark in the near-UV (Deep Blue band near 0.41 µm), improving the signal
5
for aerosol retrieval relative to the more central visible wavelengths. The DB algorithm
is handled by a different science team, and except for a final merge to make a “best-of”
product (discussed in Sect. 3.6), this paper focuses only on the development of the C6 DT aerosol product.
Prior to launch, the physical and numerical assumptions that form the basis of the
10
DT algorithms, as well as the proto-algorithms themselves, were tested using mathe-matical techniques and by using proxy data obtained from aircraft instruments and field experiments (Tanr ´e et al., 1996; Kaufman, 1997; Chu et al., 1998; Remer and Kauf-man, 1998; Tanr ´e et al., 1999). Although the details of the DT algorithms have evolved over time, the basic concepts remain unchanged. There are complete descriptions of
15
the C5 DT algorithms in the literature (e.g., Levy et al., 2010; Remer et al., 2005, 2008) and within the online Algorithm Theoretical Basis Documents (ATBD, Levy et al., 2009). Here we provide only a summary.
Tanr ´e et al. (1996) explained that to increase signal-to-noise, the MODIS aerosol retrieval is performed at a lower resolution (e.g., 10 km at nadir) than the inputted
spec-20
tral reflectance data (e.g., 500 m). Pixels that are non-optimal for aerosol retrieval, for whatever reason, can be screened out yet leave enough “good” pixels to make a suc-cessful retrieval. The pixel data are organized into N by N boxes (e.g., 20 by 20), and the geo-location information (e.g., MxD03 or MxD35) are used to determine nominal surface type (water, land or other) of the scene, and which fork of the retrieval to
fol-25
AMTD
6, 159–259, 2013The Collection 6 MODIS aerosol products over land
and ocean
R. C. Levy et al.
Title Page
Abstract Introduction
Conclusions References
Tables Figures
◭ ◮
◭ ◮
Back Close
Full Screen / Esc
Printer-friendly Version
Interactive Discussion
Discussion
P
a
per
|
Dis
cussion
P
a
per
|
Discussion
P
a
per
|
Discussio
n
P
a
per
|
not likely that all pixels are suitable for aerosol retrieval. For example, there is a test to determine if a “land” pixel is in fact contaminated by water (e.g., small stream, puddle). Likewise, there is a test (Li et al., 2003) to filter out shallow “water” pixels contami-nated by underwater sediment. Other tests filter out ice/snow pixels (Li et al., 2005), bright land scenes, glint over water, etc. Finally, Martins et al., (2002) describe how
5
to filter out cloudy pixels. Once all unsuitable pixels are removed, the procedure then arbitrarily discards the brightest 25 % and darkest 25 % of remaining pixels over ocean, and the brightest 50 % and darkest 20 % over land. Because the reflectance has been screened for clouds and non-optimal surfaces, and the remaining pixels have been further filtered, residual contamination is minimized over most situations. Furthermore,
10
the retrieval performs corrections for absorption by atmospheric gases, including water vapor, ozone, and carbon dioxide.
The pixels that remain, after all de-selection and gas corrections are applied, are understood to represent the conditions that aerosol retrieval is possible (e.g., Remer et al., 2012). These pixels are averaged, yielding a final set of mean spectral reflectance
15
that is understood to be representative of optimal retrieval conditions, e.g., clear skies, no gases, and low surface variability. The algorithm takes this set of “observed” Top-of-Atmosphere (TOA) spectral reflectance, and tries to match to values within Look Up Tables (LUTs). These LUTs have been pre-computed by using radiative transfer code to simulate spectral TOA reflectance under a variety of aerosol and surface
con-20
ditions. These LUTs are indexed by aerosol type, aerosol loading (total optical depth at 550 nm), and parameters of sun/satellite geometry. Over ocean, the LUT includes the optical properties of ocean (whitecaps, foam, water-leaving radiance) coupled with the atmosphere (molecular plus aerosol). Over land, the LUT is calculated over a black surface, so that the TOA includes only for molecular (Rayleigh) plus aerosol
contribu-25
tions.
Although both DT algorithms perform inversions to find matches to the LUT, the
required assumptions are different. Over the ocean, except for where there is glint,
AMTD
6, 159–259, 2013The Collection 6 MODIS aerosol products over land
and ocean
R. C. Levy et al.
Title Page
Abstract Introduction
Conclusions References
Tables Figures
◭ ◮
◭ ◮
Back Close
Full Screen / Esc
Printer-friendly Version
Interactive Discussion
Discussion
P
a
per
|
Dis
cussion
P
a
per
|
Discussion
P
a
per
|
Discussio
n
P
a
per
the wavelength increases. This means, that a reflecting aerosol layer provides good contrast over the ocean, and that at least two pieces of aerosol information (loading,
size) can be retrieved (Tanr ´e et al., 1996). Spectral reflectance (ρλ) observations in six
wavelengths (0.55, 0.65, 0.86, 1.24, 1.63, and 2.11 µm) are compared with values in the LUT. It is assumed that the ambient aerosol is composed of a linear combination
5
offine and coarse aerosol modes from the LUT, where the fine mode is picked from four choices and the coarse mode from five. The retrieved products over ocean are
total aerosol optical depth (AOD orτ) at 0.55 µm, fine mode fraction of AOD (FMF or
η), which combination of fine and coarse modes, and the least squares spectral fitting
error (ε).
10
On the other hand, over land, the surface is much more variable, and is dark enough only under some conditions. Therefore, many more assumptions need to be made about the surface and aerosol type, in order to accurately determine only one piece of information (aerosol loading). Kaufman et al. (1997) discovered that in many vege-tated regions, there is an observed relationship between surface reflectance between
15
0.47, 0.65 and 2.11 µm (“VISvs2.1”, Levy et al., 2007b). Therefore, observation/LUT comparison is done in only these three wavelength bands. Since the LUT is calcu-lated without surface contributions, the algorithm is constrained by the surface spectral relationships. In addition, the expected aerosol type is prescribed as a linear
combina-tion offine-dominated model type, and coarse-dominated model types (each having
20
multiple modes themselves). Since the land algorithm tries to deal with larger surface uncertainty with only three spectral bands, both fine and coarse-dominated aerosol types must be prescribed as a function of season and location. The retrieved products over land include total AOD (0.55 µm), fraction of fine-dominated aerosol type (here, also called FMF), constrained surface reflectance, and fitting error.
25
This means that for both DT algorithms, the primary retrieved products are the
to-tal AOD at 0.55 µm (τ), the fractional contribution (η) of the fine aerosol type (mode
over ocean, model over land) and the spectral fitting error (ε). Each algorithm reports
AMTD
6, 159–259, 2013The Collection 6 MODIS aerosol products over land
and ocean
R. C. Levy et al.
Title Page
Abstract Introduction
Conclusions References
Tables Figures
◭ ◮
◭ ◮
Back Close
Full Screen / Esc
Printer-friendly Version
Interactive Discussion
Discussion
P
a
per
|
Dis
cussion
P
a
per
|
Discussion
P
a
per
|
Discussio
n
P
a
per
|
from information contained within the LUT and/or other retrieved products. For exam-ple, knowing the resulting total AOD and fine aerosol fraction, it is easy to derive AOD
in other wavelengths, and then further calculate ˚Angstr ¨om Exponent (AE) based on
the spectral dependence of AOD. Diagnostic parameters include information used to perform the retrieval, as well as information about the retrieval itself. Solar zenith angle
5
is an example of information going into the retrieval; the number of pixels used, is an example of information about the retrieval.
This brings us to the concept of Run-Time Quality Assurance (QA) (Hubanks et al., 2012). At each stage in the retrieval an evaluation is made of the situation and a flag
switched on or offthat describes the results of that evaluation. Input data, the logical
10
flow of the algorithm, and the results are each evaluated in turn. The QA procedure takes note of such information as how many pixels were thrown out during cloud mask-ing, how well the retrieval solution fits the observations, and whether or not the solution characterized realistic physical conditions. Each test triggers its own QA flag. If, dur-ing the retrieval, some aspect is less than ideal, the overall accuracy of the retrieval
15
is expected to degrade. Ideal performance is given the highest QA “Confidence” value
(QAC=3), with good, marginal and no confidence retrievals given QAC values of 2, 1
and 0, respectively. The results of the many individual QA tests, plus the final
determi-nation of QAC are all coded into a five-byte SDS. Different bits represent the results of
individual tests (e.g., Levy et al., ATBD, 2009).
20
2.3 Evaluation of the C5 MODIS aerosol products
Immediately following Terra launch the first aerosol products were evaluated in a va-riety of ways that included qualitative examinations and quantitative comparisons of data collected from collocated sunphotometer (SP) data including those from Aerosol Robotic NETwork (AERONET) stations (Holben et al., 1998; Ichoku et al., 2002; Chu et
25
AMTD
6, 159–259, 2013The Collection 6 MODIS aerosol products over land
and ocean
R. C. Levy et al.
Title Page
Abstract Introduction
Conclusions References
Tables Figures
◭ ◮
◭ ◮
Back Close
Full Screen / Esc
Printer-friendly Version
Interactive Discussion
Discussion
P
a
per
|
Dis
cussion
P
a
per
|
Discussion
P
a
per
|
Discussio
n
P
a
per
minor changes had made under the same Collection number. The early Collections were frequently revised. The first set of validated products appeared in Collection 2 (C002), although these were quickly replaced by C003 within the first two years of Terra launch. C004 was the first stable, widely used and well-documented set of MODIS aerosol products (Remer et al., 2005). However, the C004 aerosol product over land
5
produced unacceptable levels of bias (Levy et al., 2005). A second-generation land algorithm was developed and implemented as C5 (Levy et al., 2007a and b) and other changes were implemented at the same time. The MODIS Deep Blue algorithm (Hsu et al., 2006) was added to the Collection 5 processing after the processing had already begun and was thus labeled Collection 5.1 (C51). Since the dark-target algorithms are
10
identical for C5 and C51, we refer to them both as “C5”. Details of the C5 DT algorithms are presented in the literature (Remer et al., 2005, 2008 over ocean; Levy et al., 2007a and b over land) as well as within the online ATBD (Levy et al., 2009).
Identical C5 DT aerosol retrieval algorithms have been applied to the entire time series of both MODIS’s data (2000/2002 through 2011). This has allowed time for
15
an exhaustive evaluation process, including numerous papers on global, regional and local MODIS product “validation”. Global validation has been performed by compar-ing MODIS-retrieved AOD and size parameters to similar parameters observed from Aerosol Robotic Network’s (AERONET; Holben et al., 1998) suite of fixed ground-based sunphotometers, both over land (Levy et al., 2010) and over ocean (Remer et
20
al., 2008). In addition to these global studies, MODIS has also been compared to ad-ditional ground based (e.g., Levy et al., 2005), air-borne (e.g., Redemann et al., 2009) and moving ship-borne SPs (e.g., Kleidman et al., 2012).
Most of the validation studies concluded that, in general, MODIS C5 retrieved aerosol products were comparable to sunphotometer based products, and an expected error
25
(EE) envelope could be defined that contained at least 67 % (approximately one stan-dard deviation) of the matchups. This comparability depended on conditions of the observation scene (location, season, etc.) as well as the estimated QAC of the
AMTD
6, 159–259, 2013The Collection 6 MODIS aerosol products over land
and ocean
R. C. Levy et al.
Title Page
Abstract Introduction
Conclusions References
Tables Figures
◭ ◮
◭ ◮
Back Close
Full Screen / Esc
Printer-friendly Version
Interactive Discussion
Discussion
P
a
per
|
Dis
cussion
P
a
per
|
Discussion
P
a
per
|
Discussio
n
P
a
per
|
ocean (Remer et al., 2008) where QAC≥1, and±(0.05+15 %) over land (Levy et al.,
2010) where QAC=3. Expected Error for FMF was determined as±0.20 over ocean
(Kleidman et al., 2005) and could not be validated over land (Levy et al., 2010). The MODIS/AERONET agreements were about the same for Terra and Aqua, with similar percentages falling within EE. In fact, according to Hyer et al. (2010), and Zhang and
5
Reid (2008), the C5 MODIS products were generally accurate and stable enough to be acceptable for use, with bias correction applied, in a global meteorological assimilation models. One major upgrade of the C5 algorithm was to allow retrievals of small
nega-tive AOD, down to−0.05. While not physical, randomly retrieving a negative AOD is a
statistically realistic portrayal of small positive AOD.
10
Yet, these and other validation studies clearly showed that C5 aerosol products were not equally accurate and stable every place and every time. MODIS/AERONET “com-parability” (regression slope, intercept, correlation and number within EE envelope) varied as a function of location and season, conditions of retrieval (scattering ge-ometry, cloud fraction), and also due to subjective algorithm tests during retrieval. In
15
some cases, these evaluations indicated that assumed confidence (QAC levels) was assigned based on the wrong criteria.
Overall, the C5 DT products were accurate and reliable enough that a complete overhaul was not necessary. This means that although the basic theory, science and logic of the DT algorithms have not been changed from C5, many of the details have
20
been updated, and some of the bugs fixed. The goal of C6, then, is to provide a better product, without compromising the main strengths of the retrieval.
To incrementally test the impacts of proposed changes, we set up an “operational-like” processing environment on local computing machines. We also tasked the MODAPS group to set up a testing environment on their machines, in order to
repeat-25
edly process different versions of the algorithm on multiple granules, days or months of
MODIS aerosol products. Depending on the test performed, MODIS data were chosen
from different periods of the combined Terra/Aqua mission. Some tests only required
AMTD
6, 159–259, 2013The Collection 6 MODIS aerosol products over land
and ocean
R. C. Levy et al.
Title Page
Abstract Introduction
Conclusions References
Tables Figures
◭ ◮
◭ ◮
Back Close
Full Screen / Esc
Printer-friendly Version
Interactive Discussion
Discussion
P
a
per
|
Dis
cussion
P
a
per
|
Discussion
P
a
per
|
Discussio
n
P
a
per
of data from both satellites. Large statistical evaluation required processing of multi-ple months of data across multimulti-ple years, nominally all Januarys and Julys from 2003, 2008 and 2010.
To assess the impacts of different algorithm upgrades, our metrics included basic
statistics (global mean AOD, number of valid retrievals), histograms, difference maps
5
(e.g., “new-baseline”) and dual collocation with AERONET or other SP data. From these tests, we could determine whether the change had a significant global impact, where it had significant impact, and whether or not it pushed MODIS data closer to or farther from SP values. In addition to the changes that were actually implemented (and described in this paper and appendices) for C6, we note that there were other
10
proposed changes that were abandoned.
3 Changes to the dark-target aerosol retrieval algorithms
In this section, we describe the major changes to the DT (land and ocean) aerosol algorithms and products. Section 3.1 concerns changes that are common to both al-gorithms, whereas Sects. 3.2 and 3.3 are concerned with changes to the specific
algo-15
rithms over land and ocean, respectively. Section 3.4 discusses the combined products. New cloud mask products are discussed in Sect. 3.5, whereas a new DT/DB merge is introduced in Sect. 3.6.
3.1 Changes common to both land and ocean algorithms
Since C5 began processing almost six years ago, we have had the opportunity to
re-20
visit some of the assumptions that had been implemented even before there was an operational MODIS algorithm. For example, the central wavelengths, Rayleigh optical depth assumptions over ocean, and gas column absorption corrections were all based on MODIS instrument characterization and modeling that was performed prior to Terra launch. What kind of errors might be induced by uncertainties in the exact
AMTD
6, 159–259, 2013The Collection 6 MODIS aerosol products over land
and ocean
R. C. Levy et al.
Title Page
Abstract Introduction
Conclusions References
Tables Figures
◭ ◮
◭ ◮
Back Close
Full Screen / Esc
Printer-friendly Version
Interactive Discussion
Discussion
P
a
per
|
Dis
cussion
P
a
per
|
Discussion
P
a
per
|
Discussio
n
P
a
per
|
tions of the MODIS instrument? What about differences between the radiative transfer
(RT) codes used for computing the LUTs? For C5, the LUT over land (e.g., Levy et al., 2007a) was calculated using RT3 (Evans et al., 1991), whereas the LUT over ocean (e.g., Remer et al., 2005) was calculated using MODRAD (Ahmad and Fraser, 1982).
Although different codes were used, are they sufficiently comparable in common
con-5
ditions (e.g., Rayleigh, no aerosol)?
Our exploration concluded that there were C5 inconsistencies that were worth cor-recting for C6. We found that for common geometrical conditions and a molecular-only (Rayleigh) atmosphere, the two LUTs would disagree by significantly more than the 1 % claimed by intercomparisons of RT codes (e.g., Kotchenova et al., 2008). Some of
10
the causes included:
1. Assumptions about MODIS-band wavelength and Rayleigh optical depth (ROD)
were different over land and ocean.
2. Insufficient angular resolution (quadrature angles too few).
3. Subtle difference between “layers” and “levels” when computing transmission
15
functions were confused. Up/down transmission values over land were mistak-enly computed for layer # 1 (next to the surface) rather than level # 0 (the surface).
4. The over-land LUT did not include the “King factor” (King, 1923; Young, 1980) for molecular dipole depolarization.
5. Over ocean, the RT code included correction for CO2, which was not included
20
over land. In fact, since CO2was corrected for during the aerosol retrieval, there
was in fact a double correction over ocean.
We explored the use of alternative RT codes, but this only increased the diversity of the answers and added to the confusion. Although we considered unifying the land and ocean radiative transfer codes, we concluded it would introduce other
complica-25
AMTD
6, 159–259, 2013The Collection 6 MODIS aerosol products over land
and ocean
R. C. Levy et al.
Title Page
Abstract Introduction
Conclusions References
Tables Figures
◭ ◮
◭ ◮
Back Close
Full Screen / Esc
Printer-friendly Version
Interactive Discussion
Discussion
P
a
per
|
Dis
cussion
P
a
per
|
Discussion
P
a
per
|
Discussio
n
P
a
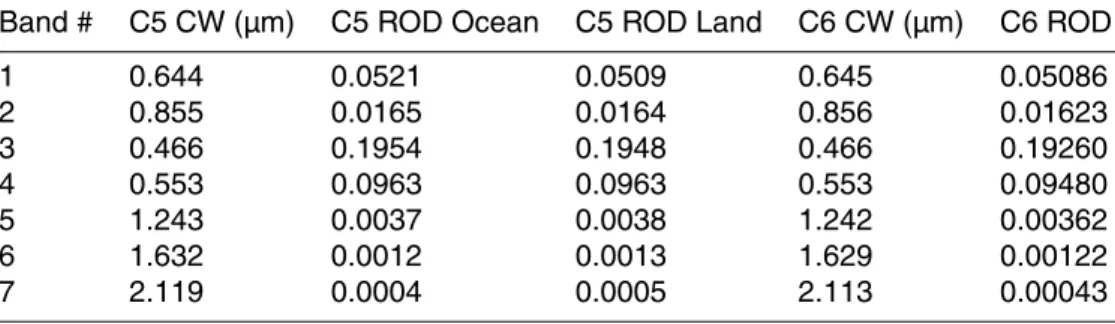
per
codes and corrected the other issues. From combined Terra/Aqua MODIS-band fil-ter functions (http://mcst.gsfc.nasa.gov/), we defil-termined weighted cenfil-ter wavelengths and used formulas from Bodhaine et al. (1999) to recalculate sea level molecular ROD
values (results in Appendix A1). Over land, we introduced the King factor (= 0.0279,
Young, 1980) for molecular depolarization, and ensured that up/down transmission
val-5
ues were reciprocal. Finally, we removed the CO2correction from inside the over-ocean
LUT. At this time, the two RT codes had essentially converged, such that 0.1 % agree-ment was reached for TOA reflectance values for Rayleigh only/black surface and any
configuration of MODIS geometry. The net effect of taking these steps to homogenize
the RT codes and aerosol LUTs, resulted in an overall global mean AOD increase of
10
approximately 0.01 over land, and decrease by 0.005 over ocean.
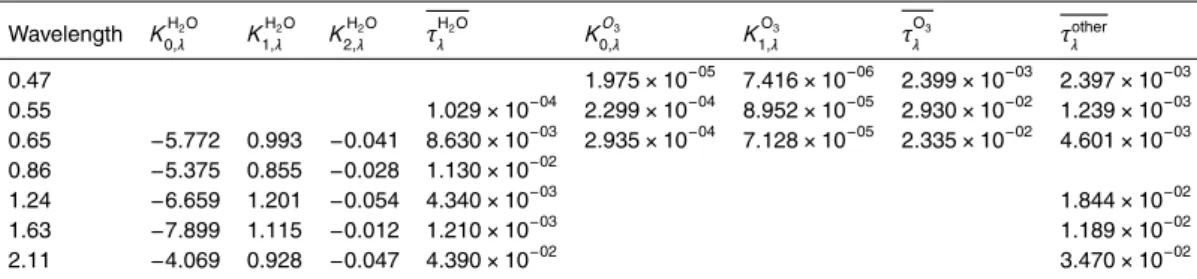
In conjunction with evaluating the CO2 correction, we revisited the entire set of gas
absorption assumptions. Accurate aerosol retrieval requires appropriate correction for the absorption of atmospheric gases. While the aerosol retrieval is performed in bands that are centered in atmospheric windows, the non-trivial width of these bands
(nomi-15
nally 20 nm) contains absorption lines of water vapor (H2O), ozone (O3), carbon dioxide
(CO2), methane (CH4), oxygen (O2), nitrous oxide (N2O), nitrogen dioxide (NO2), and
other trace gases. Appendix A1 describes the derivation of the formulas used for the
MODIS corrections, and the values of coefficients that will be used for C6. The net effect
of the C6 correction (compared to the C5) is a small increase in the input reflectance
20
values in most wavelength bands. When applying these new gas corrections, we found that, as expected, the overall mean global AOD changed by 0.002 or less over both land and ocean. What was unexpected was that the biggest change was not to the ac-tual mean, but to the global pixel counts, especially over land. By increasing the “other” gas correction in the 2.11 µm band (from 2 % to 3.5 %), it reduced the number of
pix-25
AMTD
6, 159–259, 2013The Collection 6 MODIS aerosol products over land
and ocean
R. C. Levy et al.
Title Page
Abstract Introduction
Conclusions References
Tables Figures
◭ ◮
◭ ◮
Back Close
Full Screen / Esc
Printer-friendly Version
Interactive Discussion
Discussion
P
a
per
|
Dis
cussion
P
a
per
|
Discussion
P
a
per
|
Discussio
n
P
a
per
|
The other change affecting both land and ocean is the extension of retrievals to
more oblique solar zenith angles that increases coverage at high latitudes. The C5
algorithm did not permit retrieval when the solar zenith angle (θ0) was larger than 72◦.
There were no aerosol retrievals made for relatively high latitude regions during low-light seasons, even though interesting aerosol events were seen in MODIS imagery
5
(Crusius et al., 2011). Motivated to increase coverage of these events, we added solar
zenith angles ofθ0=78◦ andθ0=84◦ to both ocean and land LUTs, after confirming
with the authors of the RT codes (Z. Ahmad, personal communication, 2011) that slant path errors should not be too large at these angles. The Fig. S8 (auxiliary material) within Crusius et al. (2011), demonstrates that relaxing the solar zenith angle threshold
10
(θ0≤84◦) enables retrievals of dust in the Gulf of Alaska. Overall, when applied to
multiple months of data (Januarys and Julys, 2003 and 2008), the new threshold adds approximately 1 % and 8 % to the number of valid aerosol retrievals over land and ocean, respectively. Preliminary comparison to AERONET suggests that accuracy is not compromised.
15
To summarize, this section has introduced only the C6 changes that were intended to homogenize radiative transfer assumptions (wavelength bands, Rayleigh optical depths and gas absorption corrections) and increase satellite retrieval coverage (larger solar zenith angles). Figure 1 shows aggregated Level 2 data from Terra for July 2008, on
1◦×1◦ gridding, where the aerosol retrieval algorithm and the inputs (L1B and
ancil-20
lary data) are held constant. Only the LUTs have changed. From “old” (C5) to “new” (homogenized, C5 V6Gas), the overall AOD is reduced by 0.003 over ocean, and in-creased by 0.008 over land (combined ocean/land dein-creased by 0.002). The most significant change is additional coverage over the higher latitudes in the winter hemi-sphere, increasing the number of valid retrievals by 5 %.
25
3.2 Changes for DT-land
AMTD
6, 159–259, 2013The Collection 6 MODIS aerosol products over land
and ocean
R. C. Levy et al.
Title Page
Abstract Introduction
Conclusions References
Tables Figures
◭ ◮
◭ ◮
Back Close
Full Screen / Esc
Printer-friendly Version
Interactive Discussion
Discussion
P
a
per
|
Dis
cussion
P
a
per
|
Discussion
P
a
per
|
Discussio
n
P
a
per
on a global basis, the MODIS over land AOD is well correlated with, and matches the ground truth SP data to within expected uncertainty. However, these studies also show regional situations with much poorer accuracy. Sometimes this degradation of accuracy occurs at high AOD, where model assumptions dominate the error. Such locations in-clude South America during the biomass burning season where the slope between
5
MODIS and SP data is much higher than 1.0, suggesting there is too much absorp-tion in the assumed aerosol model (Ichoku et al., 2003). Sometimes the degradaabsorp-tion of accuracy occurs at low AOD, where land surface reflectance assumptions dominate the error. For example, urban surfaces (Jethva et al., 2007; Oo et al., 2010) and dry,
reddish soils are brighter in the visible than expected, which introduces positive offsets
10
that can be as high as 0.2. Very dark dense vegetation sometimes creates an
under-prediction of visible surface reflectance, which introduces negative offsets and AOD.
The following sections investigate the possibilities of modifying the C5 aerosol model and surface reflectance assumptions to make these regional improvements while not compromising the excellent global validation. Not all of the studied modifications were
15
eventually implemented into the C6 algorithm.
3.2.1 Assumed aerosol type and optical properties
This section discusses changes to the assumed aerosol model types over land. When C5 was developed, the aerosol climatology was based on cluster analysis of all AERONET almucantur and size distribution retrievals archived through 2005 (Levy et
20
al., 2007a). Since that time, there have been thousands of size distribution retrievals at the same and additional AERONET sites around the globe. In addition, there have been many updates to the AERONET retrieval itself (http://aeronet.gsfc.nasa.gov) in-cluding updates of nonspherical dust assumptions and retrieval of nonspherical fraction (Dubovik et al., 2006). Instead of using the same surface reflectance assumptions for
25
AMTD
6, 159–259, 2013The Collection 6 MODIS aerosol products over land
and ocean
R. C. Levy et al.
Title Page
Abstract Introduction
Conclusions References
Tables Figures
◭ ◮
◭ ◮
Back Close
Full Screen / Esc
Printer-friendly Version
Interactive Discussion
Discussion
P
a
per
|
Dis
cussion
P
a
per
|
Discussion
P
a
per
|
Discussio
n
P
a
per
|
and single scattering albedos, at least at some sites, have changed significantly from those reported for Version 1 (Giles et al., 2012). Since there have been changes to AERONET climatology, we investigated whether the MODIS aerosol model assump-tions, based on this climatology, would require an update.
Using the same methodology as described by Levy et al. (2007a), we performed a
5
cluster analysis of the entire AERONET climatology through 2010. Surprisingly, while
a few sites showed significant differences from that observed by the prior analysis,
the overall pattern was unchanged. In general, the global aerosol type could be sep-arated into fine-mode dominated (fine models) and coarse-mode dominated (coarse models), with the fine models further separated into being strongly absorbing,
moder-10
ately absorbing and weakly absorbing. Although there were slight changes for each fine model’s optical properties, they were not significant enough to justify revision. Thus, for C6, the Table 1 from Levy et al. (2007a) remains valid for the fine-model aerosol optical properties.
Like as discussed by Levy et al. (2007a) the clustering procedure also determined
15
the “dominant” aerosol type at each site, as a function of season. While the over-all spatial distribution remained the same as defined for C5, there was much larger AERONET sampling, and more opportunity to fine-tune the model distribution borders. Figure 2 shows the global, seasonal distribution of aerosol type selection that is ap-plied for C5. The obvious change is that the border contours are now drawn by hand,
20
so that mountainous terrain may separate aerosol types. Differences are seen over
the Amazon (aerosol is now assumed moderately absorbing), over southeastern Asia (now more absorbing), and over the western United States (now clearly separated by the Rocky mountains).
Clustering of the coarse model cases was also performed. Unlike pre-C5, we saw
25
significant variety for absorption properties of coarse-mode, non-spherical aerosol. Over regions such as northern India, about 30 % of the cases suggested the
pres-ence of an absorbing coarse-mode aerosol having visible-band SSA<0.90. However,
ab-AMTD
6, 159–259, 2013The Collection 6 MODIS aerosol products over land
and ocean
R. C. Levy et al.
Title Page
Abstract Introduction
Conclusions References
Tables Figures
◭ ◮
◭ ◮
Back Close
Full Screen / Esc
Printer-friendly Version
Interactive Discussion
Discussion
P
a
per
|
Dis
cussion
P
a
per
|
Discussion
P
a
per
|
Discussio
n
P
a
per
sorption (SSA<0.95) and “dirty” dust days with higher absorption fraction. Sensitivity
tests showed that if we could correctly assign the more absorbing coarse model, the MODIS aerosol retrieval might have more sensitivity to FMF. To test, we created an absorbing coarse dust model LUT, and allowed the operational MODIS code to try and retrieve it. However, in practice, the more absorbing dust model did not give the MODIS
5
operational algorithm any new skill. The variability of the surface was still dominating, so that a combination of absorbing dust and non-absorbing fine model was not suf-ficiently better than a combination of non-absorbing dust and absorbing fine model. Thus, without a clear logic for choosing between absorbing and non-absorbing dust in the MODIS aerosol retrieval, we chose to keep only the single coarse model type
10
(weakly absorbing, non-spherical dust); the coarse model is unchanged from C5.
3.2.2 Land surface assumptions
Levy et al. (2010) clearly showed that the C5 MODIS land product did not compare as well to AERONET in regions with brighter surfaces and/or mountainous terrain (e.g., US southwest, Mongolia, etc.). As the algorithm is tuned towards dark, vegetated
tar-15
gets, this result was not surprising. However, given that the MODIS dataset had dou-bled since 2005 and AERONET included many new sites, we attempted to reformulate the assumed surface spectral VISvs2.1 relationship (Kaufman et al., 2005; Levy et al., 2007b). Similar to the procedure described by Levy et al. (2007b), atmospheric correc-tion was performed over the entire colleccorrec-tion of MODIS/AERONET collocacorrec-tions. There
20
were differences between these results and those using the 2005 data base. However,
any attempt to tune a new parameterization relating VIS surface reflectance to 2.11 µm reflectance using these new results introduced greater overall uncertainty in the re-trieval than had existed for C5. Bright surfaces might improve, but then dark surface retrievals would degrade. The C6 algorithm simply uses the C5 surface reflectance
25
AMTD
6, 159–259, 2013The Collection 6 MODIS aerosol products over land
and ocean
R. C. Levy et al.
Title Page
Abstract Introduction
Conclusions References
Tables Figures
◭ ◮
◭ ◮
Back Close
Full Screen / Esc
Printer-friendly Version
Interactive Discussion
Discussion
P
a
per
|
Dis
cussion
P
a
per
|
Discussion
P
a
per
|
Discussio
n
P
a
per
|
of MODIS albedo (e.g., Moody et al. 2005, 2008; Schaaf et al., 2010). While direct application of gridded MODIS-derived albedo (instead of surface reflectance)
intro-duced significant errors to the aerosol retrieval, we saw promise when using ratios
of spectral surface albedo in place of assumed VISvs2.1 parameterization. In gen-eral, improvements were made (reducing bias compared to AERONET) in the relatively
5
brighter arid regions without harming the comparisons over most vegetated surfaces. However, without discussing details, successful application of the albedo dataset re-quired a huge amount of processing and computer overhead, and we found issues with latitude/longitude registration over highly heterogeneous surfaces (e.g., urban ar-eas). Therefore, while the application of surface albedo climatology may be a good
10
step for the future, we decided to abandon this approach for now. For C6, we continue to use the VISvs2.1 surface reflectance parameterization originally introduced for C5 (Levy et al., 2007b).
3.2.3 Cloud mask and pixel selection
The success of the MODIS dark-target retrieval depends on its ability to throw out
15
unsuitable pixels. At a minimum, the over-land DT algorithm throws out 70 % of the observed 500 m resolution data, (darkest 20 % and 50 % brightest when sorted by 0.66 µm reflectance). However, in most cases, some pixels are completely unsuitable for aerosol retrieval, including clouds, snow and inland water bodies.
The most critical step is accurate cloud masking. Failure to fully remove clouds leads
20
to cloud contamination, and too strong a cloud mask leads to insufficient aerosol
cover-age. Because the standard MODIS cloud mask (MxD35 L2) is designed to mask pixels that are unsuitable for land-surface retrieval (clouds and heavy aerosol) and at the same time find pixels suitable for cloud product retrieval (not aerosol), it was viewed to be both overly conservative and not conservative enough for aerosol retrieval (Remer
25
AMTD
6, 159–259, 2013The Collection 6 MODIS aerosol products over land
and ocean
R. C. Levy et al.
Title Page
Abstract Introduction
Conclusions References
Tables Figures
◭ ◮
◭ ◮
Back Close
Full Screen / Esc
Printer-friendly Version
Interactive Discussion
Discussion
P
a
per
|
Dis
cussion
P
a
per
|
Discussion
P
a
per
|
Discussio
n
P
a
per
the “cirrus” channel) reflectance and spatial variability at 1 km resolution. Values for C5 thresholds were based on visual analyses of multiple granules and statistical analyses of global data, and were documented in the online C5-ATBD (Levy et al., 2009).
However, both Witte et al. (2011) and von Donkelaar et al. (2011) noted that opera-tional MODIS aerosol retrieval failed to capture the extreme Russian fire events of 2010.
5
Although in some cases the retrieval failed because the final value of AOD (>5.0) was
extrapolated outside of the lookup table, there were also many cases where failure oc-curred because the aerosol cloud mask thresholds were exceeded. Retrieval of the
ex-tremely heavy smoke (AOD>>1.0) in the middle of the plumes required either turning
offthe cloud mask, or finding a suitable aerosol “call-back” test. Since fine-dominated
10
smoke has weaker signal in 2.11 µm than 0.47 µm, and the region around Moscow has relatively small surface spatial variability at 2.11 µm, clouds and smoke might be sep-arated by the spectral dependence of their spatial variability. Thus a 2.11 µm spatial
variability test (σ2.11) was implemented, such that areas that failed the 0.47 µm
variabil-ity test could be recovered by passing the new 2.11 µm test. Aerosol coverage for the
15
Moscow fires was increased by 20 %.
Unfortunately, while successful for the Moscow region, the 2.11 µm aerosol recovery test did not end up working globally. Surface variability at 2.11 µm is often so much larger than it is at 0.47 µm, that the combined surface/aerosol variability may be no dif-ferent than clouds. While looking for alternatives, we found that combining two 0.47 µm
20
spatial variability tests sometimes could help. There is the “absolute standard
devia-tion” of the reflectance within a 3×3 box (std 047 or σ 0.47), as well as the “mean
weighted standard deviation” (mstd 047 orσ∗ 0.47), where
σ∗=σρ
√
n, (1)
where ρ is the mean reflectance (mean 047) and n=9 (3×3 pixel box). Since the
25
possibility of being flagged as “cloud” increases with both the variability and the
AMTD
6, 159–259, 2013The Collection 6 MODIS aerosol products over land
and ocean
R. C. Levy et al.
Title Page
Abstract Introduction
Conclusions References
Tables Figures
◭ ◮
◭ ◮
Back Close
Full Screen / Esc
Printer-friendly Version
Interactive Discussion
Discussion
P
a
per
|
Dis
cussion
P
a
per
|
Discussion
P
a
per
|
Discussio
n
P
a
per
|
for darker, more variable clouds, which could be called back with regularσ. Therefore,
instead of using a 2.11 µm test to recover heavy aerosol, C6 will use regular standard
deviation (σ0.47) as an aerosol call back test. This is an addition to the mstd 047 test
that is retained from C5.
Thus, the C6 over-land cloud mask is a combination of tests using absolute
magni-5
tude and spatial variability at 0.47 µm (500 m resolution) and 1.38 µm (1 km resolution). Based on analyses of many individual granules, plus statistics of global, monthly data, the C6 cloud detection thresholds are set as follows. A given 500 m pixel is flagged as a
cloud if the 0.47 µm reflectance exceeds 0.4 (ρ0.47>0.4). For each 3×3 box of 500 m
pixels, the center pixel is flagged as cloud if both (σ∗0.47>0.0025 and σ0.47>0.0075).
10
A given 1 km pixel is flagged as cloud ifρ1.38>0.025. For each 3×3 box of 1 km pixels,
the center pixel is flagged ifσ1.38>0.003. Note there is noσ∗1.38test. Finally, if any one
1 km pixel is indicated as cloud then the entire 2×2 box of 500 m pixels are
consid-ered cloud. Note that except for addition of theσ0.47 requirement, all other tests and
thresholds are identical to that used for C5. The final result is a binary cloud mask (yes
15
or no) at 500 m resolution, which is saved in memory and used to filter pixels for final aerosol retrieval. Figure 3 is an example of a granule over northeastern South America, where 533 new pixels (5 % increase from 10 108) have been retrieved when including
the σ0.47 requirement. Note that the additional pixels retrieved for C6 are located in
areas of low optical depth (τ <0.15) as well as areas of high optical depth (τ >0.75)
20
within the smoke plume.
3.2.4 Quality assurance
The Run-Time Quality Assurance (QA) Plan (Hubanks et al., 2012) over land is essen-tially unchanged from C5. There are multiple tests to assess the input data, the logical flow of the algorithm, and then the believability of the results. The results of the many
25
individual QA tests, lead to an estimate of the overall quality confidence (QAC) of the
AMTD
6, 159–259, 2013The Collection 6 MODIS aerosol products over land
and ocean
R. C. Levy et al.
Title Page
Abstract Introduction
Conclusions References
Tables Figures
◭ ◮
◭ ◮
Back Close
Full Screen / Esc
Printer-friendly Version
Interactive Discussion
Discussion
P
a
per
|
Dis
cussion
P
a
per
|
Discussion
P
a
per
|
Discussio
n
P
a
per
bits represent the results of individual tests, and are described in more detail in the Appendix.
For example, one such QA test asks whether there are a sufficient number of
non-screened pixels to make a robust aerosol retrieval. If more than 50 pixels remain (out
of a possible 120, which is in turn a 70 % exclusion of the original 400), then QAC=3.
5
More than 30, 20 and 12 (10 % of 120) result in QAC=2, 1 and 0, respectively. Fewer
pixels suggest increasingly marginal conditions in the retrieval box, and the retrieved AOD is expected to be less accurate.
In addition to explicit cloud masking (determining which pixels to exclude from the aerosol retrieval), the retrieval uses other tests to determine if clouds might be present
10
and possible source of aerosol contamination. One such test is the thin-cirrus test.
While pixels with ρ1.38>0.025 are considered to be “cloud” and masked, pixels with
ρ1.38>0.01 are used, but flagged as “thin cirrus”. These pixels may have residual
contamination, but are included in the aerosol retrieval. If any “thin cirrus” pixels are present, the entire retrieval is tagged and the QAC reduced as 0.
15
Yet, while this “thin cirrus” test was included within the C5 algorithm, the test was
coded in error, such that it the QAC=0 tag could be overwritten. In some of these
cases, “thin cirrus” cases were mistakenly assigned QAC=3 (high quality). This coding
logic error led to biased AOD statistics, especially over tropical land surfaces. Figur 4 shows a granule with clouds visible to the middle-right of the true-color RGB image over
20
Africa. Without the cirrus coding fix, there were cirrus-present pixels that would have
been tagged with QAC=3. With the fix, the high-confidence AOD data stay further from
this cloudy area, resulting in a 10 % pixel reduction for this granule. Including both the
σ0.47 call-back test (Sect. 3.2.3) and fixing the ρ138 thin-cirrus test, resulted in modest
overall increase of the the number of global high-quality pixels.
25
AMTD
6, 159–259, 2013The Collection 6 MODIS aerosol products over land
and ocean
R. C. Levy et al.
Title Page
Abstract Introduction
Conclusions References
Tables Figures
◭ ◮
◭ ◮
Back Close
Full Screen / Esc
Printer-friendly Version
Interactive Discussion
Discussion
P
a
per
|
Dis
cussion
P
a
per
|
Discussion
P
a
per
|
Discussio
n
P
a
per
|
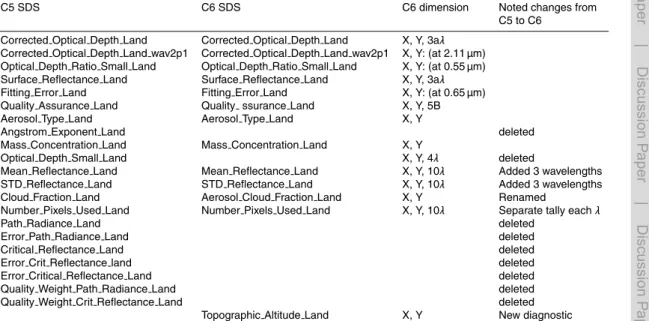
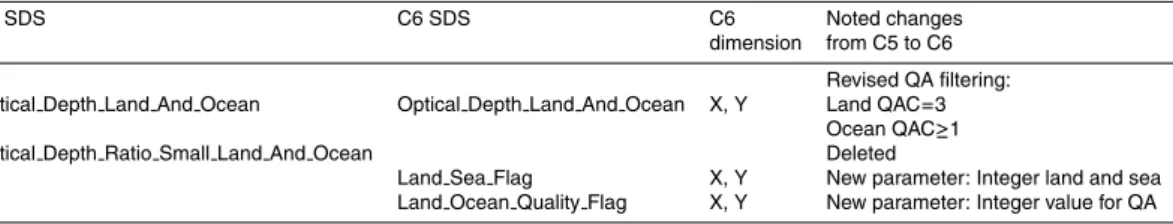
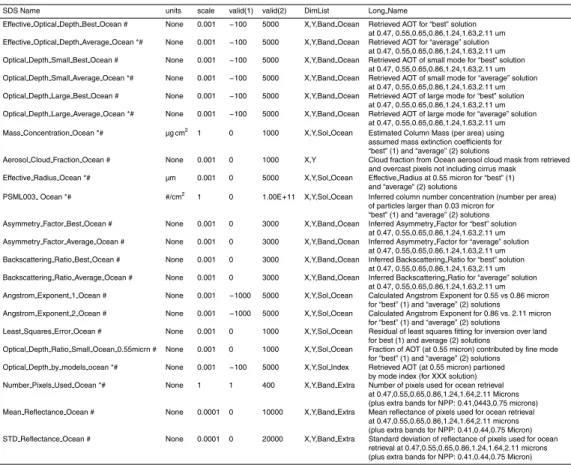
3.2.5 Deleted and new products
For the Level 2 product (MxD04 L2), the list of over-land SDSs in C6 are compared to those from C5 (Table 1). The most significant change is that the ETA parameter (FMF: Optical Depth Ratio Small Land) will be the only reported aerosol size characteristic. On a global basis, we and others have found little quantitative skill in MODIS-retrieved
5
aerosol size parameters over land (e.g., Levy et al., 2010; Mishchenko et al., 2010).
We have decided to discontinue further attempts at validating ˚Angstr ¨om Exponent (AE)
and fine-AOD. However, since the ETA parameter is part of the retrieval solution, and a necessary diagnostic, it will continue to be reported for C6. A user can still choose
to derive AE (from spectral AOD) or fine-AOD (from product ofτη) and evaluate the
10
results themselves.
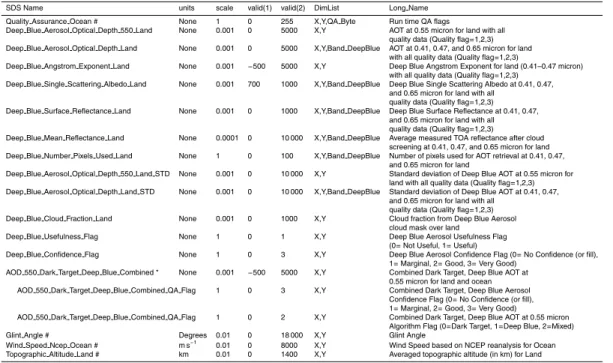
For C6, there are new, deleted, and renamed products (see Table 1). The diagnos-tic product, “Topographic Altitude Land” is new, and represents the elevation of the land target’s center. We now report dark-target reflectance (“Mean Reflectance Land”) and subpixel (1 km resolution) counts in three additional wavelengths (0.41, 0.44 and
15
0.76 µm). To reduce confusion related to an experimental product that was never prop-erly validated, all SDSs related to calculation of Critical Reflectance and Path Radiance have been deleted. Finally, to reduce confusion between users of the MODIS “Aerosol” cloud mask, and the “Wisconsin” cloud mask (MxD35 L2), our internal cloud mask fraction has been renamed to “Aerosol Clo Fraction Land”. Although the “Corrected ”
20
prefix of “Corrected Optical Depth Land” may be misleading to some users (there is
only one retrieval and nothing to correct), a sufficient number of MODIS data users
requested the SDS’s name be continued for C6, and thus it remains unchanged.
3.2.6 Comparison with C5 products and AERONET
At this point, we have introduced the changes applied to the DT-land aerosol retrieval
25
algorithm, including changes to Rayleigh assumptions, gas correction, aerosol retrieval