Article
Printed in Brazil - ©2014 Sociedade Brasileira de Química0103 - 5053 $6.00+0.00
A
*e-mail: [email protected]
A Simple, Fast and Efficient Method for Transesterification of Fatty Acids in Foods
Assisted by Ultrasound Energy
Oscar O. Santos Júnior,*,a Paula F. Montanher,b Elton G. Bonafé,b Ivanor N. do Prado,b Swami A. Maruyama,b Makoto Matsushitab and Jesuí V. Visentainerb
aParaná Federal Institute of Education, Science and Technology,
José Felipe Tequinha Street, 1400, 87703-630 Paranavaí-PR, Brazil
bDepartment of Chemistry, State University of Maringá,
Av. Colombo, 5790, 87020-900 Maringá-PR, Brazil
É altamente desejável desenvolver testes analíticos com resultados de elevada qualidade e reduzir o tempo que é utilizado para esta finalidade. Neste contexto, um novo método de metilação de ácidos graxos assistido por ultra-som, rápido e eficiente para obtenção de ésteres com melhor qualidade para análise de alimentos, foi otimizado e validado através da aplicação da metodologia de superfície de resposta, sendo obtido um tempo de esterificação ideal de 11,72 min, 71% mais rápido do que o melhor método, que é comumente utilizado para esta finalidade. O novo processo de metanólise pode ser eficazmente aplicado a amostras com ácidos graxos livres e os teores de umidade superior a 10 e 5%, respectivamente, sem o risco de oxidação de compostos durante o processo.
Actually, it is highly desirable to develop analytical assays with high quality results, while reducing the amount of time which is used for this finality. In this context, a new, fast and efficient ultrasound-assisted fatty acid methylation method, specially focused to obtain esters with better quality for food analysis, was optimized and validated through the application of response surface methodology, and an optimum esterification time of 11.72 min was achieved, 71% faster than the best method which is commonly used for this purpose. The new methanolysis procedure can be effectively applied to samples with free fatty acid and moisture contents up to 10 and 5% m/v, respectively, without risks of compound oxidation during the process.
Keywords: ultrasound, fatty acids, esterification, food analysis
Introduction
Every food possesses a characteristic fatty acid (FA) composition. Such particularity may be used as a fraud indicator in many food products, such as vegetable oils, butter and milk.1 Fatty acids are present in foods mainly
bonded to glycerol molecules, as triacylglycerols (TAG). In order to analyze them, the following set of procedures is frequently used: first, the lipidic material is extracted from a food matrix, and then it is derivatized through transesterification. The obtained fatty acid methyl esters (FAME) are analyzed in a gas chromatograph coupled with a flame ionization detector (FID).2
Over the years, a great number of methods for FAME preparation were developed. Among them, the ones which employ homogeneous catalysts in methanol are the most
used: NaOH, NaOCH3,3,4 HCl, H
2SO4 or BF3.5-9 Alkaline
homogeneous catalysts normally lead to high FAME yields in a short amount of time and without heating.10 However,
for samples with free fatty acid (FFA) and/or moisture contents greater than 1% and 0.5% (wt/wt), respectively, the saponification process occurs, reducing total FAME yield.11 For this sample type, it is recommended the
use of acid homogeneous catalysts, although they often demand higher reaction temperatures and longer reaction times.12 Due to these reasons, it was proposed the use of
methylation methods, which combined alkaline and acid homogeneous catalysts. Among these methods, the assay proposed by Joseph and Ackman8 is the most employed
for food analysis, and it uses NaOH/MeOH in the alkaline step and BF3/MeOH in the acid step.13
However, Fulk and Shorb14 reported that BF
3 produces
BF3 possesses high toxicity. Several works in biodiesel
area studied the methylation of animal fats and vegetable oils with low frequency of ultrasound (20-40 kHz), which removes the need of system heating.15-17 However, no author
has ever explored the use of ultrasound for the achievement of methyl esters with good purity/quality for food analysis. In this context, the response surface methodology (RSM) is very useful for optimizing the kind of process cited above, because it allows to evaluate the individual influence of reaction factors over the desired response, and to search if exist negative or positive interactions between such factors, always aiming to obtain a mathematical model which describes the chemical process in question.18
Thus, the objective of this work was to develop a simple, fast and efficient fatty acid methylation method with minimal ester oxidation, through the combination of alkaline and acid catalyst, low frequency ultrasound, and RSM.
Experimental
Samples
Refined soybean oil was used for the method development/optimization, because it is a sample without interferents and with high TAG/PUFA amounts. The oil, with no additives, was donated by Cocamar enterprise, located in the city of Maringá, Paraná state, Brazil.
The developed method was applied to a sardine sample (Sardinella brasiliensis), because sardines normally possess high PUFA concentrations. Approximately 500 g of fish were eviscerated and trimmed, while the remaining fillets were crushed, homogenized and submitted to total lipid extraction through Bleigh and Dyer19 method.
The method accuracy was evaluated through its application in fatty acid analysis of three different brands of fish oil capsules, and the obtained results were compared to the values from their labels.
Chemical reagents
The reference standards: mono-, di- and triolein, tricaprin, methyl tricosanoate and a FAME standard mix (189-19), all with purity > 99%, were acquired from Sigma-Aldrich. The reagents: methanol, n-hexane, sulfuric acid, solution of 14% boron trifluoride (BF3) in methanol, ammonium chloride
and sodium hydroxide were of analytical grade and was purchased from Merck (Rio de Janeiro, Brazil).
The ultrasound vat (from Cristofoli brand) which was used in experiments has the following dimensions: 26.4 cm (length), 16.4 cm (width), 8 cm (depth), 42 kHz (frequency) and 160 W (power).
Acid index
Total FFA content of oil sample was determined according with the official method from Instituto Adolfo Lutz.20
Peroxide index
Peroxide indexes from samples after methylation process were determined according with AOCS Cd 8-53.21
Experimental design
The suitability of radiation in ultrasound frequency (42 kHz) as energy source for FA methylation reactions was evaluated. After optimization and validation, comparative assays were done between our new method and the methodology proposed by Joseph and Ackman8 with fifteen
replicates of total lipids from Sardinella brasiliensis.
Delimitation of factors
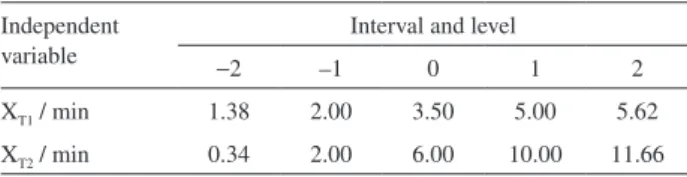
The influence of independent variables (Table 1) in function of FAME yield was evaluated through employment of a central composite rotary design, applicable to RSM, with five levels and two variables, totalizing 21 experiments: four factorial points, four axial points (both in duplicate) and five central points. The chosen intervals and variables were previously defined by use of Hatmann and Lago9 methodology.
Developed method
Approximately 25 ± 0.1 mg of oil sample were inserted in a screw-capped test tube. Then, 250 µL of linoleic acid solution in chloroform (10 mg mL–1, with around 10% m/v
of FFA) were added. The entire system was diluted with distilled water until a final concentration of 5% m/m. It is important to cite that the additions of water and linoleic acid which were describe above are solely for the purpose of simulating a sample with high amounts of FFA and moisture exclusively for method optimization step. Other samples do not need to follow these two steps.
Table 1. Variables and intervals which were evaluated in the methylation
reactions
Independent variable
Interval and level
−2 –1 0 1 2
XT1 / min 1.38 2.00 3.50 5.00 5.62
Then, 4 mL of a NaOH solution in methanol (0.5 mol L–1)
were further added, then the tube was closed and placed in a ultrasound vat (containing 2% of common neutral detergent in water, to reduce surface tension) at room temperature (25 °C) according with T1 time from experimental design (Table 1). After that time, the tube was removed from ultrasound vat and 5 mL of esterifying reagent: [prepared with a mixture composed of (A) 2 g ammonium chloride, (B) 60 mL methanol and (C) 3 mL concentrated sulfuric acid which was refluxed for 15 min] were added. Reaction tube was once again closed, placed in the vat and let to react according with T2 time of experimental design (Table 1). Then, the tube was definitely removed from vat, 4 mL of saturated sodium chloride solution were added and the entire system was closed and vigorously stirred by 30 s. Two milliliters of n-hexane were added in order to create two phases (one organic and other aqueous), and, therefore, achieve a liquid-liquid FAME extraction. The tube was closed again and shaken by 30 s for the last time. After 24 h of rest under –18 oC, the organic phase (upper layer)
of tube was collected for chromatographic analysis. From now on, this entire method will be called “A”.
It is important to mention that T1 and T2 times from experimental design (Table 1) were only used during the optimization of method A. For FAME determination of an unknown lipid sample, the optimized T1 and T2 times
Chromatographic analysis
Fatty acids methyl esters were separated in a gas chromatograph from Thermo brand, model 3300, equipped with a flame ionization detector, automatic injector and a capillary column of fused silica CP-7420 SELECT-FAME (100% bonded cyanopropyl, 100 m length, 0.25 mm internal diameter and 0.39 µm of stationary phase). Injector and column temperatures were 230 and 240 °C, respectively. Initially, the column temperature was maintained at 165 °C for 18 min. Then, it was raised to 235 °C, at a rate of 4 °C min−1. Total chromatographic run time was 32.5 min.
The flow rates for the carrier (H2), auxiliary (N2) and detector flame (H2 and synthetic air) gases (high purity from
White Martins, Brazil) were 1.2 mL min−1, 30 mL min−1,
30 mL min−1 and 300 mL min−1, respectively. Sample split
ratio was 1/80. For identification, FAME retention times were compared with the standards from Sigma-Aldrich (Sigma, St. Louis, MO). Retention times and peak area percentages were automatically processed through the Chromquest 5.0 software. The FAs from soybean oil and total lipids from sardine, both after methylation, were quantified in mg g−1 of total lipids through internal standard
calibration, using methyl tricosanoate as internal standard.2
For soybean oil the percentages of monoacylglycerols (MAG), diacylglycerols (DAG), and triacylglycerols were also determined using a Thermo TRACE CG Ultra gas chromatograph, equipped with programmed temperature vaporizing (PTV) injector and autosampler. The analysis was done according to method proposed by Prados et al..22
Statistical analysis
The experimental results were analyzed through a response surface methodology generated by the Design-Expert 7.1 software (Stat-Ease Inc., USA). The response was adjusted to the factors through multiple regression. Model fit quality was evaluated by variance analysis and determination coefficients. The quadratic model was adjusted with the following equation:
(1)
where: Y: response factor (reactional yield of FAME in mg g−1 of total lipids); χ
i: ith independent factor;
β0: intercept; βi: first order coefficient of the model; βii: quadratic coefficient of i factor; βij: linear coefficient
of the model for interaction between i and j factors; ε: experimental error attributed to Y.
Results and Discussion
Soybean oil characterization
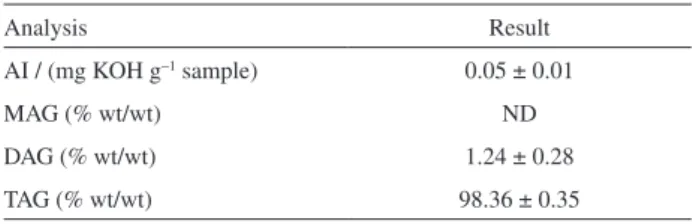
Chemical parameters, such as acid index (AI), and MAG/DAG/TAG contents were evaluated in the soybean oil which was used for optimize the methylation reaction, and the results are expressed in Table 2.
The soybean oil used for optimization was suitable for application in the experiments of this work. It showed lower AI values than the stipulated by National Health Surveillance Agency (ANVISA) (max: 1 mg KOH g−1
sample)23 resolution. TAG content [98.36% (wt/wt)] is
in accordance with Jakab, Héberger, Forgács,24 which Table 2. Characterization of the soybean oil employed in the optimization
Analysis Result
AI / (mg KOH g−1 sample) 0.05 ± 0.01
MAG (% wt/wt) ND
DAG (% wt/wt) 1.24 ± 0.28
TAG (% wt/wt) 98.36 ± 0.35
reported a TAG content of approximately 97% for refined vegetable oils.
Development of the regression model
The experimental design for soybean oil FAMEs can be observed at Table 3.
The yield response was applied to multiple regression analysis and, among the models which were indicated by the software (linear, two factor interaction (2FI), polynomial quadratic and cubic), the quadratic one was
selected as the most adequate because it possesses a high significance order.25 Thus, the yield model which was
adjusted based in the actual values in function of the studied variables, is shown in the equation 2.
Y = 1235.806 – 433.188XT1 – 92.22XT2 + 77.154XT12
+ 8.224XT22 (2)
where: Y: response factor (reaction yield of FAME in mg g−1 of total lipids); Xn: independent variables (X
T1, XT2)
(Table 1).
Positive signal indicates synergic effect in the yield increase and negative signal indicates antagonic effect, as described by Neto et al.25
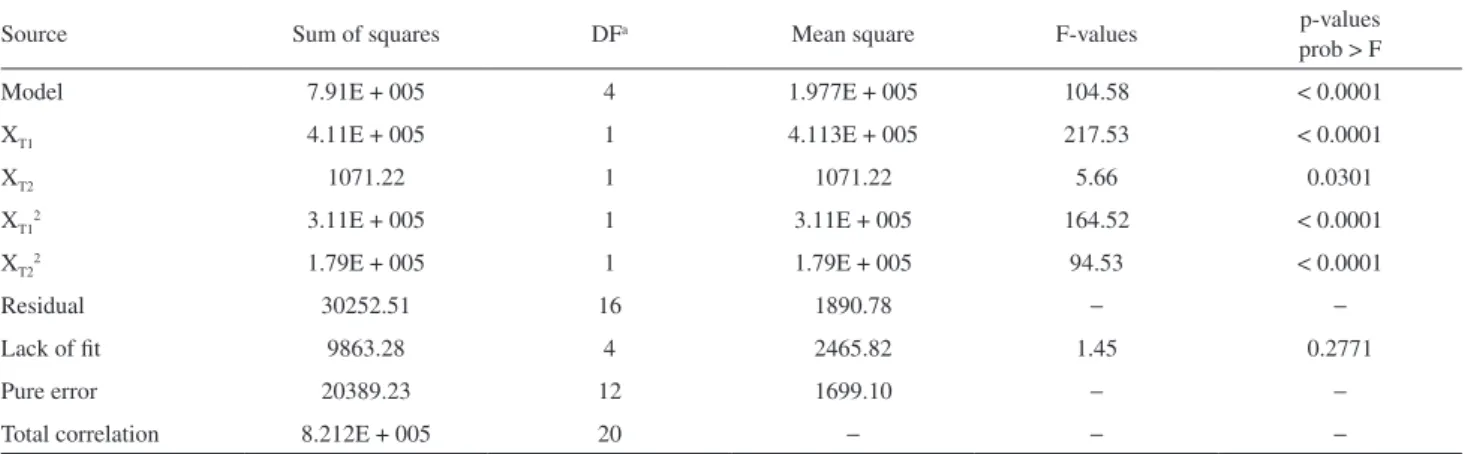
The analysis of variance (ANOVA) results, which were achieved in order to determine the quadratic model significance, the significant effect of each term and their interactions on the obtained responses, are shown in Table 4.
The obtained value for the determination coefficient (R2 = 0.9632 indicates that 96.32% of the experimental
response variability can be explained by the previously discussed model (equation 2). The model’s regression F-value (104.58), with p-value < 0.0001, implies that it is significant at 95% confidence, because p value is employed as a tool to verify the significance of each coefficient and indicate their interaction effects. If a p-value is low, then the significance of the corresponding coefficient is high.25
In the case of models terms, p-values lower than 0.05 indicates that they are statistically significant at 95% trust level.
The low value which was found for the variation coefficient (CV = 6.79%) indicated a high precision degree of the experimental values.25 The lack of fit with p-value
of 0.2771 indicates that it is not significant, confirming
Table 3. Factorial design for “A” method
Assay T1 / min T2 / min XT1 XT2 FAME / (mg g−1 TL)
1 2.00 2.00 –1 –1 516.83
2 2.00 2.00 –1 –1 528.45
3 5.00 2.00 1 –1 827.45
4 5.00 2.00 1 –1 842.38
5 2.00 10.00 –1 1 563.83
6 2.00 10.00 –1 1 561.74
7 5.00 10.00 1 1 955.90
8 5.00 10.00 1 1 947.72
9 1.38 6.00 –2 0 549.98
10 1.38 6.00 –2 0 537.71
11 5.62 6.00 2 0 955.84
12 5.62 6.00 2 0 954.02
13 3.50 0.34 0 –2 644.13
14 3.50 0.34 0 –2 651.28
15 3.50 11.66 0 2 686.80
16 3.50 11.66 0 2 679.25
17 3.50 6.00 0 0 390.28
18 3.50 6.00 0 0 376.80
19 3.50 6.00 0 –2 342.40
20 3.50 6.00 0 2 400.18
21 3.50 6.00 0 0 527.97
T: time; X: codified values; FAME: fatty acid methyl esters.
Table 4. Analysis of variance (ANOVA) for the response surface quadratic model
Source Sum of squares DFa Mean square F-values p-values
prob > F
Model 7.91E + 005 4 1.977E + 005 104.58 < 0.0001
XT1 4.11E + 005 1 4.113E + 005 217.53 < 0.0001
XT2 1071.22 1 1071.22 5.66 0.0301
XT12 3.11E + 005 1 3.11E + 005 164.52 < 0.0001
XT22 1.79E + 005 1 1.79E + 005 94.53 < 0.0001
Residual 30252.51 16 1890.78 − −
Lack of fit 9863.28 4 2465.82 1.45 0.2771
Pure error 20389.23 12 1699.10 − −
Total correlation 8.212E + 005 20 − − −
that the model explains well the experimental data in the chosen interval.
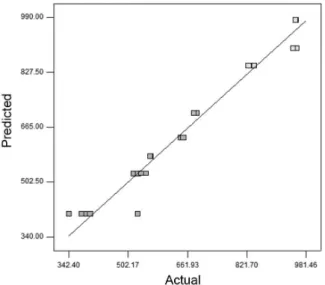
Another form to evaluate the model fit efficiency is to verify the graphic of predicted versus observed values for the response of interest (Figure 1). If the points are closer to the regression line, better the model will be, and graphic of predicted values versus internally studentized residuals (Figure 2).
Parameters evaluation
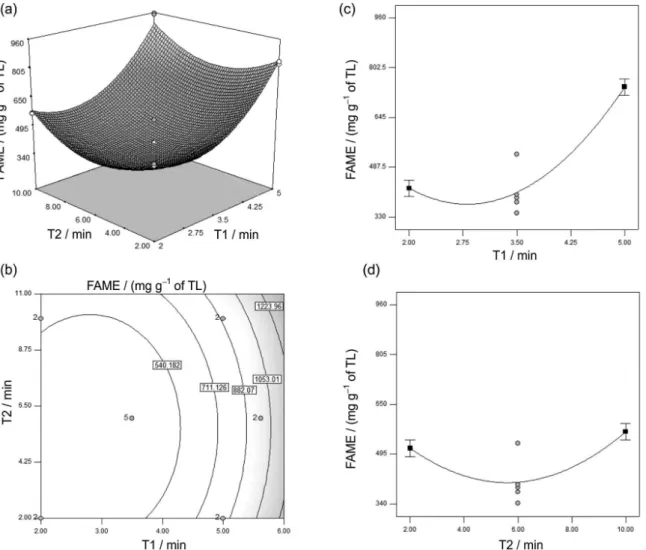
According to Table 3, it was verified that investigated variables showed significant effect at 95% trust level in FAME production. According to Figure 3, it can be verified how these variables influence such yield. From now on, every place when the unit mg g−1 is mentioned, it refers to
mg g−1 of total lipids (TL).
The reaction times after addition of alkaline catalyst (T1) and acid catalyst (T2) does not possess significant interaction. However, it can be verified at Figure 3a their influences on FAME yield of methylation reactions. In low reaction times (T1 and T2 of 2 min) such yield is low (lower than 495 mg g−1). However, if T2 is maintained at its
lowest limit (2 min), and T1 is raised, FAME yield greatly increases beyond 805 mg g−1. This happened because NaOH
in MeOH was used as catalyst during T1, since it leads to faster reactions.26,27 However, this conversion rate still is not
the ideal, because of the high amounts of FFA (10% wt/wt) and moisture (5% wt/wt) which are present in the system: in these conditions saponification reactions of TAGs and FFAs also occur. This may be verified when T1 is kept on the superior level (5 min) and T2 is gradually increased. Thus, FAME yield also increased until maximum level, close to 960 mg g−1, which is obtained in 10 min. This can
be justified due to the acid catalyst used in T2, since in this step the saponified fatty acids are also converted to FAME. In Figure 3b these trends may be better visualized, since it shows the contour surface graph of interaction between T1 and T2 regarding FAME.
According to Figure 3c, it may be verified the quadratic effect of T1 in relation to FAME from reactions, and it is crescent until 5 min, leading to a maximum FAME yield of 805 mg g−1, by the previously discussed motives.
In Figure 3d, the quadratic effect of T2 in relation to FAME from reactions is shown, being crescent until 10 min, generating a maximum FAME yield lower than 495 mg g−1. This happens because acid catalysts normally
demand greater reaction times and temperatures in order to achieve good values of yield.
Optimization of methyl esters yield and model validation
Through the experiments of Table 3, it may be verified that soybean oil FAME varied from 342.40 to 955.90 mg g−1. However, a yield of 955.54 mg g−1 was
obtained in a T2 of 6 min, this time is 40% lower than the required for achieve the yield of 955.90 mg g−1. This interval
was evaluated in order to determine the optimal conditions for maximize FAME yield.
These conditions were validated by applying them to three independent experiments. The parameters were: 5.59 and 6.13 min for reaction times after addition of alkaline and acid catalysts, respectively, with and predicted FAME yield of 967.39 mg g−1.
The obtained yield was 962.01 mg g−1. This empirical
value is in accordance with the one predicted by the model (CV = 6.49%), demonstrating that this model can be used for prediction of yields in the studied interval.
Figure 1. Predicted vs. actual values for FAME (mg g−1 of total lipids).
Closer values of FAME (966 mg g−1) were obtained by
Zara et al.,28 upon optimizing methylation of soybean oil
with microwaves in substitution of heating in conventional bath for Joseph and Ackman8 method. However, this is an
expensive methodology, and a conventional microwave oven can increase risks regarding physical integrity of the analyst when executing such reactions.
Milinski et al.29 compared the efficiency of eight
methylation methods for soybean, flaxseed and palm oils, and the method of Joseph and Ackman8 was determined
as the most efficient for oils with high amounts of FFA. However, besides the previously mentioned disadvantages, it possesses a longer reaction time (40 min) when compared to the “A” method (11.72 min = 71% faster).
Application of the developed method
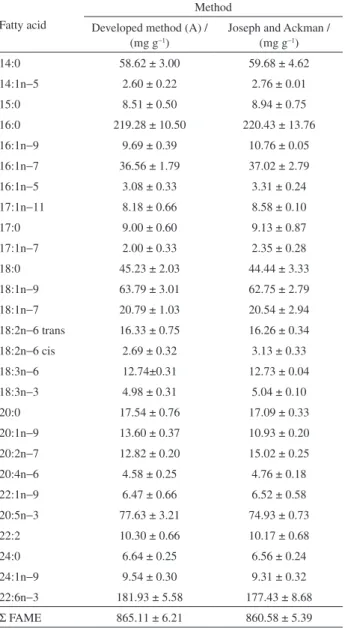
In order to check the suitability of “A” method for total lipid of Sardinella brasiliensis, results were compared by methylating the lipids from the same sample lot
through A and Joseph and Ackman8 methods. Results are
expressed in Table 5. Other procedures were not taken under consideration for this comparison study because, as mentioned before, Milinski et al.29 concluded that Joseph
and Ackman8 assay showed the best results for samples
with high amounts of moisture and FFAs (the same type of sample which was used for “A” method development).
Both methods did not show significant differences regarding sum of FAME, demonstrating that the “A” method was applied with success for methylation of fish samples with high amounts of PUFA.
The obtained FAME sum is close to the determined by Carbonera et al.,30 (867.99 to 891.77 mg g−1) after
analyzing fatty acids of tilapia fillets through Joseph and Ackman8 assay.
The formation of peroxides was evaluated after the derivatization process, for both methods, which were studied in this work. With A method, peroxides were not detected, while in the case of Joseph and Ackman8
68.05 ± 0.08 mEq kg−1 of peroxides were quantified. Such Figure 3. 3D response surface graph for interaction between T1 and T2 (a), contour surface graph between T1 and T2 (b), graphic showing the influence
method. Total optimized time was 11.72 min: 5.59 min of sonication after addition of NaOH solution and 6.13 min of sonication after addition of esterifying reagent. The new method can be applied, in an efficient manner, to samples with high concentrations of FFAs and moisture (10 and 5% wt/wt, respectively), without concerns about product oxidation during the entire process. Thus, the “A” assay arises as an interesting alternative that may be used by food/ analytical chemists worldwide for routine determinations of fatty acids from food samples.
References
1. Ficarra, A.; Lo Figo, D. P.; Minelli, G.; Antonelli, A.; Food Chem. 2010, 121, 809.
2. Visentainer, J. V.; Quim. Nova. 2012, 35, 274.
3. ISO Method 5509: International Organization for Standardization. Animal and Vegetable Fats and Oil - Preparation of Methyl Esters of Fatty Acids, ISO: Geneva, 1978. 4. Bannon, C. D.; Breen, G. J.; Craske, J. D.; Hai, N. T.; Harper,
N. L.; O’Rourke, K. L.; J. Chromatogr. 1982, 247, 71. 5. Jham, G. N.; Telles, F. F. F.; Campos,L. G.; J. Org. Chem. 1982,
59, 132.
6. Freedman, B.; Butterfield, R. O.; Pryde, E. H.; J. Am. Oil Chem. Soc. 1986, 63, 1375.
7. Metcalfe, L. D.; Schimitz, A. A.; Pelka, J. R.; Anal. Chem. 1966, 38, 514.
8. Joseph, J. D.; Ackman, R. G.; J. AOAC Int.1992, 75, 488.
9. Hartman, L.; Lago, R. C. A.; Lab. Pract. 1973, 22, 474. 10. Schuchardt, U.; Sercheli, R.; Vargas, R. M.; J. Braz. Chem. Soc.
1998, 9, 199.
11. Vyas, A. P.; Verma, J. L.; Subrahmanyam, N.; Fuel2010, 89, 1.
12. Boey, P. L.; Ganesan, S.; Maniam, G. P.; Khairuddean, M.; Lim, S. L.; Energy Convers. Manage. 2012, 56, 46.
13. Visentainer, J. V.; Souza, N. E.; Matsushita, M.; Hayashi, C.; Franco, M. R. B.; Food Chem. 2005, 90, 557.
14. Fulk, W. K.; Shorb, M. S.; J. Lipid Res. 1970, 11, 276. 15. Riva, G.; Toscano, G.; Pedretti, E. F.; Duca, D.; Biomass
Bioenergy2011, 35, 2867.
Table 5. FAME concentrations for total lipids of sardine after methylation through Joseph and Ackman8 and the method which was developed in
this work
Fatty acid
Method Developed method (A) /
(mg g−1)
Joseph and Ackman / (mg g−1)
14:0 58.62 ± 3.00 59.68 ± 4.62
14:1n−5 2.60 ± 0.22 2.76 ± 0.01
15:0 8.51 ± 0.50 8.94 ± 0.75
16:0 219.28 ± 10.50 220.43 ± 13.76 16:1n−9 9.69 ± 0.39 10.76 ± 0.05 16:1n−7 36.56 ± 1.79 37.02 ± 2.79 16:1n−5 3.08 ± 0.33 3.31 ± 0.24 17:1n−11 8.18 ± 0.66 8.58 ± 0.10
17:0 9.00 ± 0.60 9.13 ± 0.87
17:1n−7 2.00 ± 0.33 2.35 ± 0.28
18:0 45.23 ± 2.03 44.44 ± 3.33
18:1n−9 63.79 ± 3.01 62.75 ± 2.79 18:1n−7 20.79 ± 1.03 20.54 ± 2.94 18:2n−6 trans 16.33 ± 0.75 16.26 ± 0.34 18:2n−6 cis 2.69 ± 0.32 3.13 ± 0.33 18:3n−6 12.74±0.31 12.73 ± 0.04 18:3n−3 4.98 ± 0.31 5.04 ± 0.10
20:0 17.54 ± 0.76 17.09 ± 0.33
20:1n−9 13.60 ± 0.37 10.93 ± 0.20 20:2n−7 12.82 ± 0.20 15.02 ± 0.25 20:4n−6 4.58 ± 0.25 4.76 ± 0.18 22:1n−9 6.47 ± 0.66 6.52 ± 0.58 20:5n−3 77.63 ± 3.21 74.93 ± 0.73
22:2 10.30 ± 0.66 10.17 ± 0.68
24:0 6.64 ± 0.25 6.56 ± 0.24
24:1n−9 9.54 ± 0.30 9.31 ± 0.32 22:6n−3 181.93 ± 5.58 177.43 ± 8.68
Σ FAME 865.11 ± 6.21 860.58 ± 5.39 N = 15 replicates
Table 6. Values of EPA and DHA concentrations (mg g−1) determined in
three different brands of fish oil capsules
Sample
Description from label / (mg mg−1)
Obtained results / (mg mg−1)
Recovery / %
EPA DHA EPA DHA EPA DHA
A 195.00 122.00 188.22 ± 1.62 118.75 ± 0.70 96.52 97.32
B 180.00 122.00 181.01 ± 0.57 119.12 ± 0.85 100.56 97.64 C 180.00 122.00 175.15 ± 1.06 116.21 ± 1.01 97.31 95.25 EPA: eicosapentaenoic acid; DHA: docosahexaenoic acid. All values are mean of three replicates.
peroxide formation might have occurred due to heating at 100 °C for 30 min, an intrinsic procedure from this method. The accuracy of the “A” method was determined upon analysis of samples from three different brands of fish oil capsules. Such results are shown in Table 6.
Results showed a great percentage of recovery (> 90%), indicating that the “A” method may be applied for an efficient determination of fatty acids in fish oil samples.
Conclusion
16. Encinar, J. M.; Gonzáles, J. F.; Pardal, A.; Fuel Process Technol.
2012, 103, 9.
17. Rajković, K. M.; Avramović, J. M.; Milić, P. S.; Stamenković, O. S.; Veljković, V. B.; Chem. Eng. J. 2013, 215, 82.
18. Bas, D.; Boyaci, I. H.; J. Food Eng. 2007, 78, 836.
19. Bligh, E. G.; Dyer, W. J.; Can. J. Biochem. Physiol. 1959, 37,
911.
20. Lutz, A.; Normas Analíticas do Instituto Adolfo Lutz. Métodos Químicos e Físicos para Análise de Alimentos, 3ª ed.; IMESP: São Paulo, 1985, p. 260.
21. American Oil Chemists’ Society (AOCS); Official Methods and Recommended Practices of the American Oil Chemists’ Society, 5th ed.; AOCS Press: Champaign, IL, 1998.
22. Prados, C. P.; Rezende, D. R.; Batista, L. R.; Alves, M. I. R.; Filho, N. R. A.; Fuel2012, 96, 476.
23. Agência Nacional de Vigilância Sanitária (ANVISA);
Regulamento Técnico para Óleos Vegetais, Gorduras Vegetais e Creme Vegetal, Resolution - RDC No. 270, 2005.
24. Jakab, A.; Héberger, K.; Forgács, E.; J. Chromatogr. A2002,
976, 255.
25. Neto, B. B.; Scarminio, I. S.; Bruns. R. E.; Como Fazer Experimentos: Pesquisa e Desenvolvimento na Ciência e na Indústria, 3rd ed., UNICAMP: Campinas, 2007.
26. Vicente, G.; Coteron, A.; Martínez, M.; Aracil, J.; Ind. Crops Prod. 1998,8, 29.
27. Vicente, G.; Martínez, M.; Aracil, J.; Bio. Tech. 2004, 92, 297.
28. Zara, R. F.; Bonafé, E. G.; Martin, C. A.; Souza, N. E.; Muniz, E. C.; Visentainer, J. V.; Am. J. Anal. Chem. 2012,3, 288.
29. Milinski, M. C.; Matsushita, M.; Visentainer, J. V.; Oliveira, C. C.; Souza, N. E.; J. Braz. Chem. Soc. 2008, 19, 1475.
30. Carbonera, F.; Bonafé, E. G.; Martin, C. A.; Montanher, P. F.; Ribeiro, R. P.; Furuia, W.; Visentainer, J. V.; Food Chem. 2014, 148, 230.