Z’ Model Discrimination at LHC
A. A. Nepomuceno and F. M. L. Almeida Institute of Physics, Federal University of Rio de Janeiro
(Received on 5 June, 2008)
We study three different variables that can be useful forZ′ model discrimination: the forward-backward asymmetry, the rapidity ratio and the associated production. We also present two approaches to correct the Forward-Backward Asymmetry, which is affected by the unknown initial quark direction in the proton-proton collision. The study is performed for six different Z′models, using Monte Carlo events and a fast detector simulation. It is shown that the models studied here are distinguishable for a Z’ mass of 1 TeV after one year of data taking in high luminosity.
Keywords: Z’; Model discrimination
1. INTRODUCTION
It is common sense that the Standard Model (SM) is just an effective theory, and a more complex gauge structure must exist at TeV scale, since the SM does not answer various fun-damental questions and there are many arbitrary parameters in the theory. To solve such problems, several scenarios have been proposed over the last 25 years, like Grand Unified The-ories, 331 models, among others. All these models foresee the existence of new neutral and charged gauge bosons, generally calledZ′andW′, respectively. Their discovery would be clear signatures of physics beyond the SM. One of the most im-portant goal of the LHC is to establish the model which best describe the strong and electroweek interactions.
In this paper it will be assumed that aZ′of 1 TeV mass has been discovered at LHC. One will investigate theZ′properties via the decaysZ′−→e+e−andZ′−→e+e−γin the context of six models and study a set of variables that can be used to identify the correct theory. The leptonic decays are preferred for this analysis because they have low background compared with hadronic searches, and their energy and momentum can be measured more precisely.
This document is organized as follows: In section 2 the models will be briefly discussed. In section 3 details on the simulation is given. Section 4 describes the variables used for model discrimination, and in Section 5 a statistical treatment is applied to the problem. The conclusions are presented in the last section
2. Z’ MODELS
The most popular Z’ models are effective SU(2)L⊗ U(1)Y⊗U(1)Y′theories, which originate from the breaking of
the groupE6viaE6−→SO(10)⊗U(1)−→SU(5)⊗U(1)⊗
U(1), where theSU(5)contains the SM group. Two addi-tional neutral gauge bosons appear when the E6 is broken
down to SM, but just one of them is expected to be detected at LHC. It is defined as
Z′=Zχ′cosβ+Zψ′sinβ (1)
where the parameterβspecifies the model. The valuesβ=0
andβ=π/2 correspond to theZχ′ andZ′ψmodels, respectively, andβ=arctg(−√5/2)corresponds toZη′ model, which ap-pears whenE6is broken directly to a rank-5 group. For more
details about E6 breaking, see [1]. The couplings of SM
fermions to the new gauge boson as a function ofβ can be found in [2].
Another possibility are the left-right models, which ex-tend the SM group toSU(2)L⊗SU(2)R⊗U(1) and restore the parity symmetry at high energy. In this note we will be concentrated in two kinds of left-right models with different fundamental representations : the Mirror Left-Right Model (MLRM) and the Symmetric Left-Right Model (SLRM). A detailed study of these models and the couplings between the fermions and the Z’ can be found in [3].
Interesting Z’ phenomenology also comes fromSU(3)C⊗ SU(3)L⊗U(1)X models, known as 3-3-1 models. These the-ories foresee new charged bosons with leptonic number two (bileptons), and in the minimal version, their mass is approxi-matelyMZ′/2, hence Z’ decay into bileptons are always
kine-matically allowed [4]. This model is take into account as an example of a Z’ with an exotic decay. For the others models mentioned above, it is assumed that the Z’ decays only into SM particles.
3. SIMULATION
TABLE I: Z’ Mass, widths and Cross Sections. MZ′=1TeV
Model ΓZ′ [GeV] σ(pp−→e+e−)[fb] σ(pp−→e+e−γ)[fb]
Z′χ 11.70 416.2 73.3
Zη′ 6.50 268.1 49.7
Zψ′ 5.40 247.1 46.5
Z′SLR 21.06 448.9 83.7
ZMLR′ 6.67 494.9 101.6
Z′331 177.0 377.5 68.8
TABLE II: Generated and observed asymmetries at generated level. Model AgenFB AobsFB Dilution
Zχ′ −0.330±0.006 −0.109±0.006 67% Zη′ −0.044±0.009 −0.015±0.008 66%
Z′ψ 0.043±0.009 0.021±0.009 51%
ZSLR′ 0.258±0.006 0.116±0.006 55% ZMLR′ 0.354±0.006 0.202±0.006 43% Z331′ −0.030±0.008 −0.019±0.008 37%
4. VARIABLES FOR MODEL DISCRIMINATION
The variables employed in this study are the forward-backward asymmetry, the rapidity ratio and the associated production ratio. Their definition and a detailed analysis of them are given in the next subsections.
4.1. The Forward-Backward Asymmetry
The forward-backward asymmetry is defined as
AFB=
NF−NB NF+NB
(2)
where
NF=
Z 1
0
dσ
dcosθ⋆dcosθ
⋆, NB=Z 0
−1
dσ
dcosθ⋆dcosθ ⋆ (3)
The angleθ⋆is taken between the negative charge lepton and the incoming quark in the dilepton center of mass frame. For spin-1 particles, theAFBcan also be obtained with a fit to thecosθ⋆distribution given by
dσ
dcosθ⋆∝ 3
8(1+cos
2θ⋆) +A
FBcosθ⋆ (4)
The forward-backward asymmetry provides information on the Z’ couplings to the quarks and leptons, and it can be ex-pressed in terms of the normalized couplings. Furthermore, Dittmar[8] has shown that it is almost insensitive to uncertain-ties in the structure function for dilepton masses above 400 GeV.
In this paper theAFB is obtained in the main production channel pp−→e+e− and on-peak, which means that one takes just the events with 900<Mee<1400GeV. This in-variant mass range was chosen in order to provide reason-able statistics and because it is above the interference region. The events are pre-selected by keeping two electrons with |η|<2.5, which represents the LHC detectors acceptance, and pe
T >20 GeV.
The issue in theAFB measure is that, at hadron colliders, the inicial quark direction is not known. In such case, the dilepton boost direction is taken as the quark direciton in the observed asymmetry calculation. Table II shows the gener-ated and observed asymmetry (AgenFB,AobsFB) for each considered model.AgenFB is calculated using Equation 2 and quark direction known, with its error given by
δAgenFB = 2 NT
r
NFNB NT
(5)
whereNT =NF+NB, while AobsFB is obtained from the un-binned likelihood fit of Equation 4. The probability ν of misdetermining the quark direction is approximately 25%, and its impact on theAobsFB is measured by the dilution d = 1−AobsFB/AgenFB. Althoughνis model independent,dis strongly model dependent, as one can see in Table II, because of the different Z’ couplings to the fermions.
The probability ν can be parametrized as a function of dilepton rapidityy, namelyν(y). Figure 1A shows the dilep-ton rapidity distribution for all the events and for those where the quark direction was wrongly determined. The ratioν(y) between the second and the first histograms is shown in Fig-ure 1B. As one can see,ν(y)increases asydecreases, reach-ing 50% aty=0. This uncertainty on quark direction is due to events with low longitudinal momentum. At high rapidi-ties values, the Z’ mainly comes from the valence and the sea quark aniquilation, and the boost moves in the valence quark direction since it carries a larger momentum fraction than does the sea quark. Thereforeν(y)→0 whenyincreases.
0 0.5 1 1.5 2 2.5
0 100 200 300 400 500 600
0 0.5 1 1.5 2 2.5
0 100 200 300 400 500 600
#Events/0.025
< 1400 GeV
ee
900 < M (A)
|y| 0 0.5 1 1.5 2 2.5
0 0.1 0.2 0.3 0.4 0.5
ν
(B)
|y|
FIG. 1: (A)Rapidity distribution for all the events(clear histogram) and for those where the quark direction was misdetermined(dashed histogram). (B) Ratio between the second and the first histogram. The full line is the fit result using Equation 6.
TABLE III: Generated and corrected asymmetries using model inde-pendent(MI) and model dependent(MD) corrections.
Model AgenFB Acor
FB- MI AcorFB- MD
Z′χ −0.330±0.006 −0.236±0.022 −0.325±0.011
Zη′ −0.044±0.009 −0.045±0.029 −0.048±0.015 Zψ′ 0.043±0.009 0.050±0.030 0.035±0.016 Z′SLR 0.258±0.006 0.259±0.020 0.263±0.010 ZMLR′ 0.354±0.006 0.391±0.017 0.356±0.010 Z′331 −0.030±0.008 −0.011±0.029 −0.017±0.015
ν(y) =A|y|2+B|y|+0.5 (6)
where the constantsAandBare obtained by fitting theν(y) distribution from MC samples in the mass range 900<Mee< 1400GeV. This information will be used to correct the asym-metry.
In order to correct the dilution effect, one can rewrite Equa-tion 4 as
dσ
dcosθ⋆ ∝ 3
8(1+cos
2θ⋆) +AFB[
1−2ν(y)]cosθ⋆ (7)
withν(y)given by Equation 6. The unbinned likelihood fit of Equation 7 gives us the corrected asymmetries AcorFB and their errors as shown in Table III. Notice that, in this new fit, not onlycosθ⋆but alsoyare input data in each event. As one can see, this approach presents a good performance in recovering the true asymmetry and has the advantage of being model independent.
Another way to correct the asymmetry is to apply model dependent correction, since the dilution is model dependent. One can get this correction by noticing that when theZ′and quark directions are opposite, one has in fact two possibilities: there is a probabilityν1of taking an event as backward when
it is forward, and a probabilityν2of taking an event as forward
when it is backward. Thusν=ν1+ν2, and it is easy to show
that the corrected asymmetry is given by
AcorFB=ArecFB+2(ν1−ν2) (8)
Unlikeν, ν1,2 are strongly model dependent. The
quan-tity(ν1−ν2)is determined from MC for each model. The
goal of this method is to provide these correction factors, and, once one has the measureArecFB, the different corrections can be applied to it in order to identify the underlying model. This approach can also be used as a cross-check to the model inde-pendent method described above.
The model dependent correction results are shown in the last column of the Table III. As one can see, the corrected asymmetries errors obtained with this method are about half of those from the model independent correction. In Figure 2 the true and the corrected asymmetries for both methods are
compared. They show equivalent performance, but the model dependent approach presents better results forZχ′ andZMLR′ models. We have not taken into account the structure func-tions uncertainties in this study, and as the correcfunc-tions depend on this, further investigation will be needed.
It is clear that most of the models can be well distinguished usingAcorFB, but others likeZ′331andZ′ηhave asymmetry values very close to each other. This problem will be discussed in more details in section 5.
-0.3 -0.2 -0.1 -0.0 0.1 0.2 0.3 0.4
Truth
FB
A
Independent Model Correction Dependent Model Correction
χ η 331 ψ SLR MLR
FB
A
FIG. 2: True and corrected asymmetries. The triangles represet the true asymmetry, the circles the model independent correction and the squares the model dependent correction.
4.2. The Rapidity Ratio
The rapidity ratiory1 is an useful variable because it is
sen-sitive toZ′couplings to quarks. It is defined as
ry1=
Ry1
−y1
dσ dydy [Ry1
−ymax+
Rymax
y1 ]
dσ dydy
(9)
wherey is the dilepton rapidity. For this study the values y1=1 andymax=2.5 have been chosen. The theoretical val-ues ofry1for the here considered models were numerically
calculated using CompHep, and only forZ′diagram. The ob-served values ofry1is determined byrobsy1 =N1/N2, whereN1,2
are the number of events in the range|y|<1, 1<|y|<2.5, respectively. The events were taken in the same mass win-dow 900<Mee<1400GeV that was used for the asymmetry studies.
In Table 4 the theoretical and observed values ofry1 are
compared. There is a good agreement between expected and observed values, with theZχ′ been the worst case (the recon-structed values is 1σaway from the expected). Notice that this variable provides a good discrimination for some models likeZχ′ andZ′SLR, but it is not as powerful as the asymmetry. However, it can be used as a consistency check.
4.3. The Associated Production
TABLE IV: Theoretical and reconstructed values ofry1.
Model rtheoy1 ryobs1 Zχ′ 1.83 1.76±0.07 Zη′ 1.38 1.36±0.06 Z′ψ 1.47 1.45±0.06 Z′SLR 1.57 1.59±0.06 Z′MLR 1.28 1.32±0.05 Z331′ 1.42 1.46±0.06
RZ′γ=σ[pp→Z
′γ→e+e−(γ)]
σ[pp→Z′→e+e−] (10)
This variable has the advantage of being insensitive to the par-ton densities choice[9], and various systematics uncertainties are canceled out when one takes ratio of cross sections.
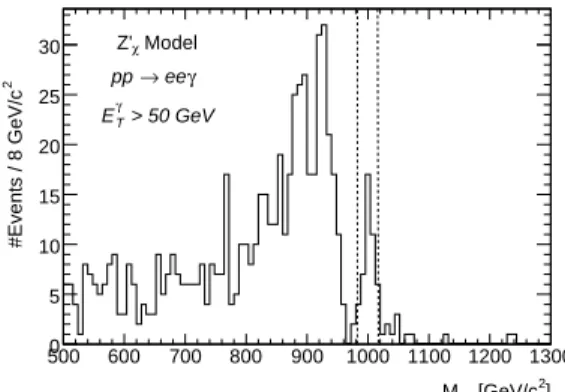
In this channel, the main backgrounds come from two sources: the s-channel decays Z′/Z/γ −→e+e−γ and jets misidentified as photons. The last background is not signifi-cant because the probability of misidentifying a jet as a photon in the LHC detectors is about 10−4for jetET >40GeV[10]. The first one can be removed by applying a cut on photon ET ofETγ >50GeV, and constraining the dielectron invariant mass in the range 999−ΓZ′ <MZ′ <1003+ΓZ′, whereΓZ′
is theZ′ width. Thet-channel events selection according to these cuts is illustrated in Figure 3 forZχ′ model, where the reconstructed invariant massMeeis plotted for the events with two electrons and one photon in the final state. Note that the cut on photonET allows a good separation betweensandt channel.
5000 600 700 800 900 1000 1100 1200 1300
5 10 15 20 25
30 Z’χ Model
2
#Events / 8 GeV/c
]
2
[GeV/c
ee
M
> 50 GeV
T
γ E
γ ee → pp
FIG. 3: t-channel events selection. A cut on photonET>50GeV
is applied and the events are selected in the mass range 999−ΓZ′< MZ′<1003+ΓZ′.
In order to obtainΓZ′ andMZ′, we follow the method
pro-posed in[11]. A function F(Mll) is fitted to the dielectron invariant mass at reconstructed level. This function is a rela-tivistic Breit-Wigner with multiplicative and additional expo-nentials that take into account the Drell-Yan background
F(Mll) = AM
2Γ2
Z′
(M2
ll−M2Z′)2+Γ2Z′MZ2′
e−BMll+Ce−DMll (11)
TABLE V: FittedΓZ′ andMZ′ . The theoretical values are found in
Table 1.
Model MZobs′ [GeV] ΓobsZ′ [GeV] Zχ′ 1001.4±0.1 13.68±0.25
Zη′ 1001.6±0.1 8.35±0.28 Z′ψ 1001.6±0.1 8.10±0.26 ZSLR′ 1000.8±0.1 22.58±0.36 ZMLR′ 1000.9±0.1 8.80±0.16 Z331′ 1013.4±0.9 150.48±3.53
TABLE VI: Theoretical and reconstructed values ofRZ′γ.
Model RtheoZ′γ ×103 RobsZ′γ×103
Zχ′ 2.8 3.1±0.5 Zη′ 4.8 4.7±0.9
Z′ψ 4.0 3.9±0.8
ZSLR′ 4.2 5.7±0.6 ZMLR′ 5.2 5.6±0.6 Z331′ 5.7 12.2±0.9
whereA,B,C,D,MZ′ andΓZ′ are the fitted parameters. TheZ′
widths and masses obtained for all the models are shown in Table V.
The denominator in Equation 10 is estimated in the chan-nelpp−→e+e−by the difference between the total number of events selected and the number expected for the SM,i.e., N(pp→Z′→e+e−)∼=Ntotal−NSM, whereNtotal represents all the events observed aboveMee = 500 GeV. In spite of in-terference effects, this approximation reproduces reasonably well the cross sectionσ(pp→Z′→e+e−).
The variableRZ′γ is determined by the ratio between the number of events selected according to the described above fort andschannels. The theoretical and observed values of RZ′γare compared in Table 6. Again, the theoretical values
were obtained numerically.
As one can see, it is very difficult to determineRZ′γifΓZ′
is too large, as exemplified by the 331 model. However, if the Z’ width is around 10 GeV, it is possible to get a good reconstruction as one can see in Table VI forZχ′,Z′η, andZψ′ models.
5. STATISTICAL TESTS
5.1. The Neyman-Pearson Test
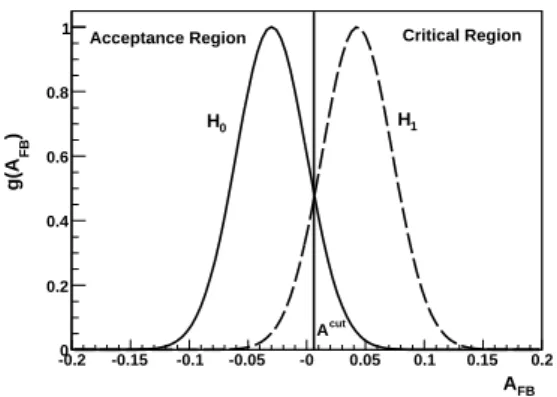
We will apply the Neyman-Pearson test to the models con-sidered above using the forward-backward asymmetry as our measure. For details about the test, see [12]. To make the no-tation simpler, the reconstructed and model independent cor-rected asymmetry will be calleda. Let us suppose, for exam-ple, that one observesa=−0.045±0.030. In such case, the modelZη′ could be taken as null hypothesisH0, and the model
Zψ′ as the alternative hypothesisH1. It will be assumed that the
p.d.fs associated to each hypothesis are Gaussians centered in the true values of the asymmetries with their widths given by the experimental errorσa=0.030. Assuming that there is the same probability of rejecting/acceptingH0 if it is true/false
(calledαandβ, respectivily), the cut valueAcut that defines the critical region is given byAcut=1/2(Aη+Aψ), whereAη andAψare the true asymmetries for the modelsZ′ηandZ′ψ, re-spectively. This situation is illustrated in Figure 4. As one can see, the valuea=−0.045 lies in the acceptance region, lead-ing us to identifyZη′ as the underlying model for the observed Z′, with a power of(1−β)= 93%. The compatibility between the observed asymmetry and the null hypothesis is measured by theP-value
P(AFB≥a) =
Z ∞
a Gauss(Aη,σa)dAFB=0.51 (12)
which means that one has a probability of 51% of the hypoth-esisH0be compatible with the data.
-0.20 -0.15 -0.1 -0.05 -0 0.05 0.1 0.15 0.2 0.2
0.4 0.6 0.8 1
Acceptance Region Critical Region
1
H
0
H
FB
A
)
FB
g(A
cut
A
FIG. 4: Neyman-Person test for the models Zη′ andZ′ψ. The cut
values that defines the critical region isAcut=0.0005.
Table VII shows the power(1−β)and theP-values for the situation where the difference between the corrected asym-metry to a prediction given by the considered models was less than 5σ. TheH0hypothesis was always taken as that one with
the true asymmetry closest to the observeda. Notice that one gets a power of discrimination around 90% for most of the tested models, andP-values greater than 45%, except forZ′331. However, for the pairZη′/Z′331this test is no longer efficient, since in this case the probability of wrongly reject(accept)H0
is 60%. It is needed thus, apply another approach.
TABLE VII: Power of discrimination andP-values for the tested hy-pothesis using the Neyman-Pearson test.
Hypothesis
H0 H1 1−β P-value
Zη′ Zψ′ 0.93 0.51
Z′ψ Zη′ 0.93 0.59
Z′ψ Z′331 0.89 0.59 Z331′ Zψ′ 0.89 0.26 Z331′ Zη′ 0.41 0.26
Zη′ Z′331 0.41 0.51
ZSLR′ Z′MLR 0.99 0.48 Z′MLR Z′SLR 0.99 0.98
5.2. Theχ2test
Instead of testing a single value using different variables as was done before, one can compare a given distribution for two different models and compute aχ2value for them. For
this task, it will be used the dilepton rapidity distribution and aχ2function given by[13]
χ2=
∑
χ2i =∑
2(ki−ni) + (2ni+1)lnµ 2ni+1 2ki+1
¶ (13)
Thisχ2 was chosen because it shows better performance
than the usual one, even for low bin content or when the bin content is zero. This test consist in comparing two rapidity distributions from different models and calculating theχ2
i in each bin, whereniandkiare the number of events in theithbin in each correspondent distribution. A largerχ2corresponds to
larger discrepancies between the models. The probability of the two histograms be compatible is given by theP-value
P=
Z ∞
χ2 f(z;nd)dz, (14)
where f(z;nd)is theχ2distribution andn
d is the number of degrees of freedom or the number of bins when one compares histograms. IfP→0, the histograms are incompatible, but ifP→1, one says that they are compatible and there is no significant difference between the models.
Figure 5 shows the reconstructed dilepton rapidity distribu-tions for the modelsZη′ andZ′331. The events were taken in the mass window 900<Mee<1400GeV and distributed in a histogram of 100 bins. Although the histograms seem to be very similar, theχ2calculated for them using Equation 13 was
191.84, which give us aP-value of 10−9, i.e,the histograms are statistically very distinguishable.
-2.50 -2 -1.5 -1 -0.5 0 0.5 1 1.5 2 2.5 20
40 60 80 100 120 140 160
-2.50 -2 -1.5 -1 -0.5 0 0.5 1 1.5 2 2.5
20 40 60 80 100 120 140 160
y
#Events/0.05
η Z’
331
Z’
FIG. 5: Reconstructed dilepton rapidity distribution for the models Z′ηandZ331′ .
6. CONCLUSIONS
Methods and variables to identify the corrected SM ex-tension if a new neutral gauge boson is found at LHC have
been investigated. We have shown that the Forward-Backward asymmetry, the rapidity ratio and the associated production is a powerful set of variables for model discrimination. The ap-proaches presented to correct the asymmetry showed good and similar results, but the model dependent correction showed better performance for Zχ′ and Z′MLR models. Using the Neyman-Person test, one can distinguish the models with a power of discrimination of 90%, except the pairZη′/Z331′ . In this case aχ2test was applied, giving us good results. It is
important to mention that the errors were calculated for an in-tegrated luminosity of 100 fb−1, and a lower luminosity will lead to bigger errors and consequently the variables sensibility to model discrimination will decrease.
Acknowledgements
This work was partially supported by the Brazilian agencies CNPq and CAPES.
[1] J. L. Hewett et al., Phys. Reports183, 193 (1989). [2] A. Djouadi et al., Z. Phys. C56, 289 (1992).
[3] F. M. L. Almeida et al., Eur. Phys. Journal C38, 115 (2004). [4] E. Ramirez et al., Phys. Lett. B632, 675 (2006).
[5] A. Pukhov et al., CompHep - a package for evaluation Feyn-man diagrams and integration over multi-particle phase space. [arXiv:hep-ph/9908288]
[6] A. Abulencia et al., Phys. Rev. Lett.96, 211801 (2006). [7] T. Sjostrand, Comp. Phys. Comm.82, 74 (1994).
[8] M. Dittmar, Phys. Rev. D55, 161 (1997). [9] T. G. Rizzo, Phys. Rev. D47, 956 (1993). [10] A. Solodkov, EPJdirect C4, (S1) (2002).
[11] M. Schafer et al., Z′ studies in full simulation, ATL-PHYS-PUB-2005-010 (2005).
[12] W. T. Eadie et al.,Statistical Methods in Experimental Physics, North-Holland (1971) 224.
![TABLE I: Z’ Mass, widths and Cross Sections. M Z ′ = 1TeV Model Γ Z ′ [GeV ] σ(pp −→ e + e − )[fb] σ( pp −→ e + e − γ)[fb] Z ′ χ 11.70 416.2 73.3 Z η′ 6.50 268.1 49.7 Z ψ′ 5.40 247.1 46.5 Z ′ SLR 21.06 448.9 83.7 Z MLR′ 6.67 494.9 101.6 Z ′ 331 177.0 377.5](https://thumb-eu.123doks.com/thumbv2/123dok_br/18983033.457760/2.892.87.437.93.245/table-mass-widths-cross-sections-tev-model-gev.webp)