Raman Scattering Studies of Monohydrated
L-Asparagine
A.J.D.Moreno Departamento de Fsica,
Universidade Federal do Maranh~ao, Campus do Bacanga 65080-040 S~ao Lus, MA - Brazil
P.T.C. Freire,I.Guedes,F.E.A.Melo, J.Mendes-Filho Departamento de Fsica, Universidade Federal do Ceara
Campus do Pici, Caixa Postal 6030 60455-760, Fortaleza, CE - Brazil
and
J.A. Sanjurjo
Departamento de Eletr^onica Qu^antica, IFGW-UNICAMP Cidade Universitaria, Caixa Postal 6165
13083-970, Campinas, SP - Brazil
Received 26 October, 1998
Polarized rst-order Raman scattering studies at 300 K were carried out in L - asparagine mono-hydrate crystal in order to obtain the general assignment of its phonon spectra. A careful analysis of the vibrational spectra shows that the assignment of the fundamental vibrational modes can be done on the basis of amino, carboxilic and water groups vibrations, and correlations with previous data reported for other amino acids. However, some vibrations were correctly assigned from the study of its temperature - dependence behavior performed in the range 10 - 300 K. The assignment proposed conrm the zwitterionic structure of L-asparagine monohydrate crystal.
I Introduction
Amino acids are the molecular building blocks of pep-tides and proteins. The structure adopted by amino acids, after condensation into larger units, eectively determines their secondary structure in crystalline sam-ples. Studies of vibrational spectra of amino acids by Raman and infrared spectroscopies are useful in obtain-ing information regardobtain-ing the molecular conformation and the nature of hydrogen bonding in these biologi-cally important substances.
Among other biological substances, asparagine is a very important amino acid because it plays a role in the metabolic control of some cell functions in nerve and brain tissue, and is also used by many plants as a nitrogen reserve source [1]. However,
despite its biological interest, there are few works published in the literature concerning to investiga-tion of fundamental vibrainvestiga-tions of asparagine com-pounds and its derivatives [2,3]. For instance, Casado et al. [3] presented a detailed study of the an-hydrous asparagine [NH2CO(CH2)CH(NH
+ 3)COO
,], Asn-h5, and deuterated anhydrous asparagine [ND2CO(CH2)CH(ND
+ 3)COO
,], Asn-d
5, as microcrys-talline powder samples, using unpolarized Raman scat-tering and infrared absorption techniques. Although no data on the molecular structure of Asn-h5 and Asn - d5 are known, the authors have assumed the usual zwitterionic structure, suported by X-ray and neu-tron diraction studies on L-asparagine monohydrate [NH2CO(CH2)CH(NH2)COOH
H
molecules was proposed on the basis of the isotopic shifts and correlations with similar amino acids.
Surprisingly, up to 1997 no one had investigated the fundamental vibrational modes of MLA as crystalline sample and its structural modications under uniax-ial or hydrostatic pressure. Recently, we have studied MLA by Raman spectroscopy in a diamond-anvil cell up to pressures of 2.0 Gpa at 300 K [5]. From the anal-ysis of results we observed that MLA undergoes a series of three phase transitions. All these are characterized by drastic changes in the external modes and some in-ternal ones of MLA, which clearly shows the transitions induced by hydrostatic pressure. As a continuation of this study, here we present for the rst time a detailed investigation on the fundamental vibration spectrum of MLA at 300 K in the frequency range 50 - 3600 cm,1 through polarized Raman scattering technique. Data obtained from Raman spectra taken at several temper-atures in the range 10 - 300 K [6] and correlations with others amino acis were used to propose a general as-signment of the vibration modes of MLA at room tem-perature.
II Experimental
Single crystals of MLA were grown from acqueous so-lution containing untreated L-asparagine monohydrate powder furnished by Vetec,Co., by slow evaporation at T = 278 K. The crystals obtained were prisms, elon-gated along the a-axis and bounded by f011g planes. The samples used in the experiments were selected us-ing a polarizus-ing microscope and X-ray diacttion data. They were cut into parallelepipeds with dimensions 446 mm
3 and polished on Metchoth cloth using diamond paste.
The excitation source in the Raman experiments was a 514.5 nm radiation Spectra Physics argon ion laser (Model 2020) working at 80 mw, and the scat-tered light was analysed using a Jobin-Yvon Triplemate 64000 spectrometer equipped with N2 - cooled CCD system. The slits were set for a 1 cm,1 spectral reso-lution.
III Crystal structure and
fac-tor group analysis
Similarly to many other amino acids, MLA molecule occurs in the dipolar form (+H
3N
CHRCOO ,H
2O).
According to Ref. [4], at 300 K MLA crystal-lizes in an orthorhombic system belonging to space group P212121(D
4
2) with lattice parameters a=5.582 A, b=9.812 Aand c=11.796 A, and four molecules per unit cell which occupy general sites of C1 symmetry. No intramolecular hydrogen bonds have been found. The structure is stabilized by a complex network of seven in-termolecular hydrogen bonds involving all the hydrogen atoms bound to oxygen and nitrogen ones. From the correlation diagram the 237 zone-center optical modes vibrations are seen to decompose into
= 60A+ 59(B 1+
B 2+
B
3) (1)
where 162 modes are optical translatory- and rotatory-type ones, whereas 72 modes are due to internal vibra-tions. Phonons belonging to A symmetry are Raman active but infrared inactive, whereas phonon belonging to B symmetries are both infrared and Raman active. The polarized Raman spectra were obtained following the traditional notation of Tell et al [7]. Phonons be-longing to A symmetry were observed in the a(cc)b ge-ometry, while the B
1, B
2 and B
3 modes correspond to b(ab)c, c(ac)b and a(bc)b congurations, respectively.
IV Results and discussion
Following the usual procedure, the assignments are dis-cussed in four regions, namely: (i) high-wavenumber region (2800 - 3600 cm,1); (ii) medium-wavenumber region (1050 - 1800 cm-1); (iii) low-wavenumber region (190 - 1000 cm,1); and (iv) lattice vibration region ( below 190 cm,1).
High-wavenumber region
It is observed from Fig. 1 that this spectral re-gion contains some very broad bands. Such a situa-tion is usually found in crystals which present vibrasitua-tion modes associated to hydrogen bonds. In this region we can assign the NH2, NH
+
3, CH, CH
2 and H2O stretch-ing vibrations. The followstretch-ing discussion is based on B2 symmetry modes. However, the bands located at 3264 cm,1 and 2921 cm,1 are analyzed from
B
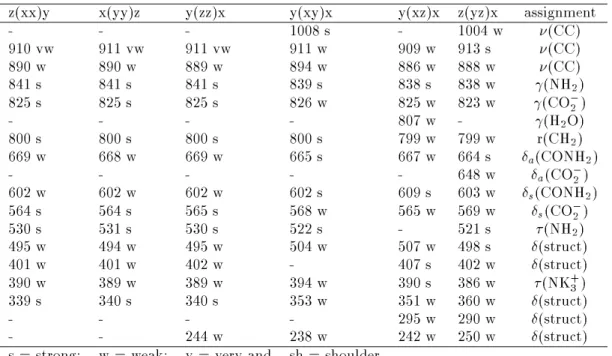
TABLE 1. Experimental wavenumbers from the vibration spectra of MLA at 300 K in the frequency range 3600-2800 cm,1.
z(xx)y x(yy)z y(zz)x y(xy)x y(xz)x z(yz)x assignment
3423 vw 3423 vw 3423 vw 3461 w 3447 w 3441 w
a(H2O)
3401 s 3401 s 3401 s - 3407 s 3404 w
s(H2O)
3385 s 3385 s 3385 s 3387 s 3388 vs -
a(NH2)
3252 vw 3252 vw 3252 vw 3264 w 3248 vw -
s(NH2)
- - - 3115 s 3117 m 3109 s
a(NK + 3)
3099 w 3099 w 3099 w - 3093 s -
a(NK + 3)
2966 vs 2966 vs 2966 vs 2966 s 2965 vw 2965 s
a(CH2)
2958 s 2958 s 2958 s 2957 s 2956 vw 2956 vw (CH)
2935 vs 2935 vs 2935 vs 2933 vs 2933 vw 2934 w
s(CH2)
- - - 2921 sh - -
s(NK + 3) s = strong; w = weak; v = very and sh = shoulder
Figure 1. Polarized Raman spectra of MLA in the frequency range 3600 - 2800 cm,1.
It is well known that the free water molecule (H2O) has characteristic stretching frequencies at 3652 and 3756 cm,1 [8]. Due to the hydrogen bonds the eec-tive force between O and H atoms in the H2O molecule is reduced, and then the H2O stretching wavenumbers in MLA crystal should present lower value than in the free molecule. In accordance with Casado et al. [3], the Raman spectrum of Asn-h5 shows two characteristic bands corresponding to the asymmetric (
a) and sym-metric (
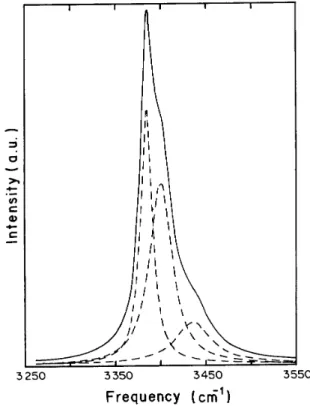
s) NH2 stretching vibrations located at 3388 cm,1and 3248 cm,1, respectively. Therefore, the band centered about 3390 cm,1 should contain three peaks
corresponding to
1(H2O),
3(H2O) and
a (NH2) vi-brations. In order to verify this assumption we have performed a lorentzian tting as shown in Fig. 2. The tting yields
1(H2O) = 3447 cm ,1,
3(H2O) = 3407 cm,1and
a(NH2) = 3388 cm
,1. The
s(NH2) vibra-tion is observed at 3248 cm,1. This band is very weak for all investigated scattering geometries. Its classi-cation was done based on the temperature dependent Raman spectra, where for temperatures below 200 K this band can be clearly seen [6].
In amino acids [9] and amino sulphones [10], the stretching vibrations of the NH+
3 group are expected in the frequency region 3150 - 3000 cm,1. These modes are usually observed as weak bands and it is some-what dicult to assign them when other NH or CH intense bands are present in the vibrational spectra. For MLA we assigned the
a(NH +
3) degenerated vibra-tion to the band centered at 3110 cm,1. In fact, if we use a lorentzian tting, we can observe that there are two nondegenerated
a (NH +
3) at 3117 cm
,1and 3093 cm,1. These assignments were mainly based on previ-ous work on the L-alanine crystal [9]. The splitting of two-fold degenerated
a (NH +
3) mode can be explained taking into account the lowering from C3 symmetry of the free NH+
3 group to C
1 symmetry in the crystal en-vironment of MLA. In order to correctly assign the
s (NH+
3) we analyze its temperature-dependent behavior in the range 10 - 300 K [6]. At 10 K, we observed, be-sides three CH stretching vibrations, the appearance of a vibration around 2925 cm,1. Its integrated scattered intensity remains constant with increasing or decreas-ing temperature. In this way, it can not be attributed to a Fermi resonance enhanced overtone or an over-lapping between fundamental modes. Hence, this vi-bration should be assigned to
s (NH +
3). At 300 K, we have assigned the
s (NH +
3) to the shoulder mea-sured at 2921 cm,1. For Asn-h
5, Casado et al. [3] have assigned the
s (NH +
3) vibration to the shoulder mea-sured at 3025 cm,1 from the infrared spectrum. No assignment of this mode is proposed from Raman spec-trum. However, from Fig. 3 of Ref. [3], we observe that there is a vibration mode at 2860 cm,1. When Asn-h
5 is deuterated (Asn-d5), this vibration disappears (cf. Fig. 4 of Ref. [3] ). This result suggests that the vi-bration at 2860 cm,1 observed by Casado et al. [3] should be related to
s(NH +
3), which agrees with our observations.
The three C-H stretching modes observed in the fre-quency range 2900 - 3000 cm,1 are assigned follow-ing the same order as for aspartic acid [11], that is, (CH) is between the
a (CH2) at 2965 cm ,1 and the
s(CH2) at 2934 cm
,1. The wavenumber for the methylene stretching vibration, 2956 cm,1, compares well with those reported for other amino acids such as l-alanine, 2962 cm,1[9], cysteine, 2968 cm,1 [12], and also with Asn-h5, 2977 cm
,1 [3].
Figure 3. Polarized Raman spectra of MLA in the frequency range 1800 - 900 cm,1.
Figure 4. Polarized Raman spectra of MLA in the frequency range 900 - 190 cm,1.
Medium-wavenumber region
are very broad for all scattering geometries. Due to this fact, the assignment of the normal modes was per-formed with the help of lorentzian ttings. The discus-sion of this frequency region is based mainly on theB
1 representation, excepting the modes at 1694 cm,1 and
1594 cm,1which are observed from B
2and B
3 geome-tries. The measured wavenumbers, relative intensities and proposed assignments for the bands observed in this region are summarized in Table 2.
TABLE 2. Experimental wavenumbers from the vibration spectra of MLA at 300 K in the frequency range 1800-900 cm,1.
z(xx)y x(yy)z y(zz)x y(xy)x y(xz)x z(yz)x assignment
- - - - 1696 s 1694 vw
a(NK + 3)
1670 vw 1670 vw 1670 vw 1673 s 1672 vw 1669 vw
a(NK + 3)
1644 vw 1644 vw 1644 vw 1647 s 1644 vw 1645 w (C=O)
1630 s 1631 s 1631 s 1621 vw 1617 w - (NH
2)
1594 vw 1594 vw 1594 vw - 1594 s 1600 vw (H
2O)
- - - 1580 s - 1582 vw
a(CO , 2)
- - - 1534 vw 1531 w 1534 vw
s(NK + 3)
1435 s 1435 s 1436 s 1435 w 1438 w 1436 vw
a(CH2)
- - - 1428 s 1426 w 1426 w
s(CO , 2)
1409 w 1409 w 1409 w 1407 vw - 1409 w (CN)
1396 vw 1396 vw 1396 vw 1399 s 1400 vw 1400 vw
s(CH2)
1363 s 1363 s 1362 s 1362 vw 1359 vw 1361 vw (CH)
- - - 1304 w 1310 vw 1318 vw (CH)
1301 vw 1302 vw 1301 vw 1299 vw 1300 vw 1299 vw !(NH
2)
1238 s 1237 s 1237 s 1237 s 1236 s 1237 vw (CH
2)
- - - - 1153 s 1154 vw r(NH2)
1147 vw 1147 vw 1146 vw 1148 w 1145 vw 1141 vw r(NK+
3)
1109 s 1109 s 1109 s 1104 vw 1102 s 1102 w r(NK+
3)
1075 s 1074 s 1075 s 1076 w 1078 s 1077 w (CN)
s = strong; w = weak; v = very and sh = shoulder
It is well known that ionized carboxilic group (COO,) have two characteristic bands in this frequency range, namely: (i)
aat 1600 cm
,1, and (ii)
sat 1400 cm,1. Since MLA presents COO,and CONH
2groups, a band related to (C=O) stretching vibration should also appear in this wavenumber region. The bands due to vibrations of NH+
3, CO ,
2 and NH
2groups obey some hierarchical wavenumber relationship and then we can do a tentative assignment for these modes.
In the frequency range 1500 - 1700 cm,1we observe from all scattering geometries, seven vibrational modes. The highest wavenumber bands in this region 1694 and 1673 cm,1, were assigned to asymmetric bendings of NH+
3 (
a), while the related symmetric bending of NH+
3 (
s) was observed at 1534 cm
,1. The asymmet-ric stretching vibrations of the carboxylate group are
is observed at a(COO
,) = 1580 cm,1. The
(C=O) mode appears as the most intense band at 1647 cm,1 forB
1species. Close to this band we have assigned the following vibrations: (i) ( NH
2) at 1621 cm
,1 ; and (ii) (H
2O) at 1594 cm ,1.
In the frequency range 1050 - 1500 cm,1we observe twelve bands. From these, there are six bands which depend weakly on the temperature [6]. They are due to vibrations of groups not linked by hydrogen bonds. These bands are: (i)
a (CH2) at 1435 cm
,1; (ii) one due to wagging-type vibration (!) of CH
2group at 1299 cm,1; (iii) one due to torsion-type vibration (
) of CH 2 group at 1237 cm,1; (iv)
s (CH2) at 1399 cm ,1; and (v) two (CH) at 1362 and 1304 cm
The remainder six bands which depend on temper-ature are: (i) one due to symmetric stretching of the carboxylate group observed at
s(COO
,) = 1428 cm,1; (ii) two due to rocking-type (r) vibrations of NH+
3 group at 1142 and 1102 cm,1; (iii) one r(NH
2) at 1154 cm ,1; and nally (iv) two (CN) at 1409 and 1077 cm
,1. For the sake of comparison, the r(NH+
3) modes were observed at 1152 and 1120 cm,1 for aspartic acid [11] and at 1138 and 1119 cm,1 for glycine [13], whereas r(NH2) was reported at 1162 cm
,1 for glutamine [14] and at 1149 cm,1 for acetamide [15]. Also, Diem et al [9] observed that (CC) stretching vibration of L-alanine takes place around 1000 cm,1, which is in good
agreement with our result.
Low-wavenumber region
In this region we expect to be able to identify be-sides the C-C stretching modes, the rest of the bending vibrations along with the torsional and skeletal stretch-ing modes. The Raman spectra for the four scatterstretch-ing geometries are shown in Fig. 4. The discussion of the mode assignment is performed mainly onB
3 represen-tation, excepting the 807 cm,1mode which is observed only in theB
2 representation. The results are reported in Table 3.
TABLE 3. Experimental wavenumbers from the vibration spectra of MLA at 300 K in the frequency range 900-190 cm,1.
z(xx)y x(yy)z y(zz)x y(xy)x y(xz)x z(yz)x assignment
- - - 1008 s - 1004 w (CC)
910 vw 911 vw 911 vw 911 w 909 w 913 s (CC)
890 w 890 w 889 w 894 w 886 w 888 w (CC)
841 s 841 s 841 s 839 s 838 s 838 w (NH
2)
825 s 825 s 825 s 826 w 825 w 823 w (CO
, 2)
- - - - 807 w - (H
2O)
800 s 800 s 800 s 800 s 799 w 799 w r(CH2)
669 w 668 w 669 w 665 s 667 w 664 s
a(CONH2)
- - - 648 w
a(CO , 2)
602 w 602 w 602 w 602 s 609 s 603 w
s(CONH2)
564 s 564 s 565 s 568 w 565 w 569 w
s(CO , 2)
530 s 531 s 530 s 522 s - 521 s (NH
2)
495 w 494 w 495 w 504 w 507 w 498 s (struct)
401 w 401 w 402 w - 407 s 402 w (struct)
390 w 389 w 389 w 394 w 390 s 386 w (NK
+ 3)
339 s 340 s 340 s 353 w 351 w 360 w (struct)
- - - - 295 w 290 w (struct)
- - 244 w 238 w 242 w 250 w (struct)
s = strong; w = weak; v = very and sh = shoulder
According to Ref. [16], the symmetric stretchings of C-C and/or C-C-N structures appear in the frequency range 750 - 1000 cm,1of the vibrational spectra of sev-eral amino acids. The modes observed at 1004, 913 and 888 cm,1were assigned as the
(CC) vibrations. Near them we also expect to observe one methylene rock-ing vibration (r (CH2)), one out-of-plane vibration of amide group ((NH
2)), one
(COO
,), and nally one (H
2O). From lorentzian tting of the bands observed
in the frequency range 820 - 920 cm,1we have assigned the following vibrations: (i) two
s (CC) at 913 and 888 cm,1, (ii) one
(NH
2) at 838 cm
,1, and (iii) one (COO
,) at 823 cm,1. The vibration of 807 cm,1 is assigned to(H
2O), since it is not present in the spec-trum of Asn-h5 [3]. The methylene rocking vibration was assigned at frequencies around 780 cm,1 for glu-tamine [14] and DL - serine [17]. Here, we assigned the r(CH2) at 799 cm
,1. However, for Asn-h
al. [3], have assigned the r (CH2) at 874 cm
,1. It seems to be a contradiction between our assignment and that proposed in Ref.[3]. In order to verify our assignment, we observe its temperature-dependent behavior in the range 10 - 300 K [6]. We observed no modications in the frequency and linewidth of this mode, which in-dicates that it is not aected by hydrogen bonds, and indeed it must be assigned to r (CH2). On the basis of correlations with related molecules [13-17] the bands at 648 and 569 cm,1were assigned as two
(COO
,), while the bands at 664 cm,1and 603 cm,1as two
(CONH 2). There are still 8 bands in the frequency range 180 - 570 cm,1. Five of them are related to torsional (
) and bending modes of skeletal structure. The remain-der three are assigned to (COO
,) at 200 cm,1, (NH+
3) at 386 cm ,1 and
(NH
2) at 521 cm
,1. These results are in good accordance with those reported for other amino acid compounds [3,9,13-17].
Latticevibrationregion
Unfortunately, there are only few reports concern-ing the investigation on the assignment of lattice vi-brations in amino-acids [18-20]. Some bands observed below 190 cm,1 are tentatively assigned to stretching, torsional and skeletal bending vibrations, whereas other spectral lines should be assigned to intermolecular hy-drogen bonding between the NH+
3 and COO
, groups in the neighboring molecules. The other types of in-termolecular interactions presumably do not contribute signicantly to the spectrum as the force acting between hydrocarbon molecules is generally weak, and further-more the atoms in dierent MLA molecules are sepa-rated greatly from each other.
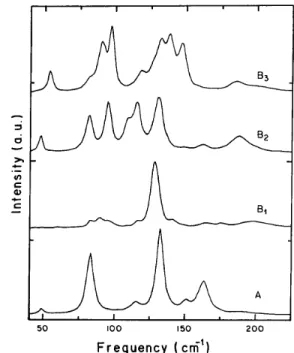
The following discussion is based on B
3 symmetry modes showed in Fig. 5. The measured wavenumbers, relative intensities and proposed assignments for the bands observed in this frequency region are summarized in Table 4. The vibrations of 185 cm,1 and 146 cm,1 are assigned to bending vibrations of skeletal structure, whereas, according to Ref.[19], the bands at 138 cm,1, 131 cm,1, 118 cm,1, 96 cm,1, 90 cm,1, 82 cm,1 and 54 cm,1 can be tentatively assigned to stretching or bending vibrations of (A! { H! ... O) hydrogen bonds.
Figure 5. Polarized Raman spectra of MLA for frequencies below 190 cm,1.
V Conclusions
In conclusion we have presented a polarized Raman scattering study of MLA crystals at room tempera-ture. We observed most of the fundamental vibrations expected from the group theory analysis. A general assignment for these fundamental vibrations was pro-posed on the basis of the detailed analysis of Raman spectra taken at several temperatures in the range 10 -300 K and correlation with similar amino acids. The re-sults conrmed the zwitterionic structure of MLA, since no hydroxyl stretching vibrations were found. The as-signments proposed in this work are in good agreement with those previously reported for Asn-h5 by Casado et al. [3]. There are few but important dierences be-tween these assignments, namely: (i) the observation of fundamentalmodes related to the water molecule vibra-tions; (ii) the correct assignment for r(CH2); (iii) the as-signment for
s(NH +
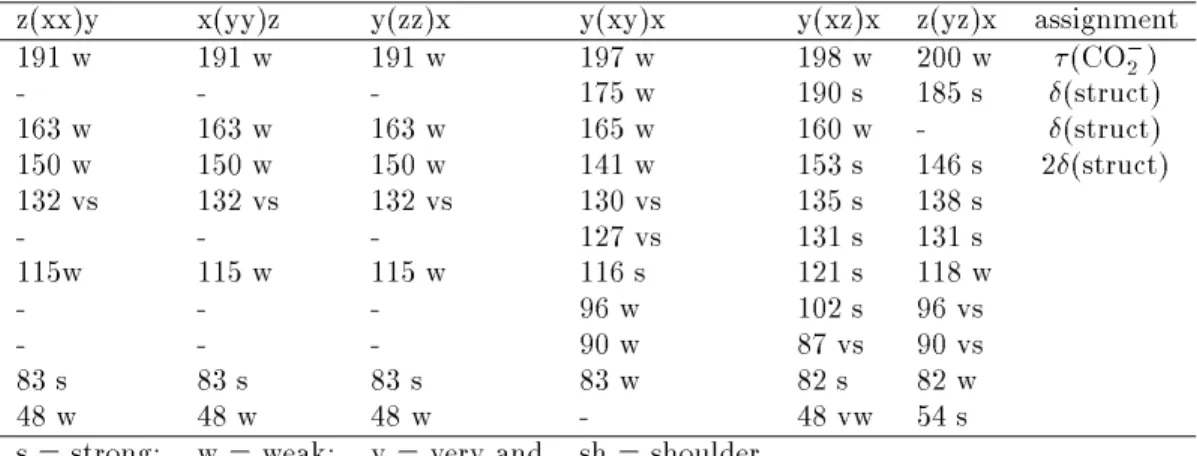
TABLE 4. Experimental wavenumbers from the vibration spectra of MLA at 300 K for frequencies below 190 cm,1.
z(xx)y x(yy)z y(zz)x y(xy)x y(xz)x z(yz)x assignment
191 w 191 w 191 w 197 w 198 w 200 w (CO
, 2)
- - - 175 w 190 s 185 s (struct)
163 w 163 w 163 w 165 w 160 w - (struct)
150 w 150 w 150 w 141 w 153 s 146 s 2(struct)
132 vs 132 vs 132 vs 130 vs 135 s 138 s
- - - 127 vs 131 s 131 s
115w 115 w 115 w 116 s 121 s 118 w
- - - 96 w 102 s 96 vs
- - - 90 w 87 vs 90 vs
83 s 83 s 83 s 83 w 82 s 82 w
48 w 48 w 48 w - 48 vw 54 s
s = strong; w = weak; v = very and sh = shoulder
Acknowledgements
The authors are grateful to Professor Eduardo E. Castellano from Universidade de S~ao Paulo for ori-enting the MLA crystals used in the experiments. This research was supported by Coordenac~ao de Aper-feicoamento de Pessoal de Nvel Superior (CAPES), Conselho Nacional de Desenvolvimento Cientco e Tec-nologico (CNPq), and Fundac~ao Cearense de Apoio a Pesquisa (FUNCAP).
References
1. P. Lund, Nitrogen Metabolism in Mammalian,
Applied Science, Barking (1981).
2. D. Garnkel and J. T. Edsal, J. Am. Chem. Soc.
80
, 3818 (1958).3. J. Casado, J. T. Lopez-Navarrete and F. J. Ramirez, J. Raman Spectrosc.
26
, 1003 (1995). 4. M. Ramanadham, S. K. Sikka and R.Chi-dambaram, Acta Cryst. B
28
, 3000 (1972). 5. A. J. D. Moreno, P. T. C. Freire, F. E. A. Melo, M.A. Araujo Silva, I. Guedes and J. Mendes-Filho, Solid State Commun.
103
, 655 (1997).6. A. J. D. Moreno, Ph.D Thesis, Universidade Fed-eral do Ceara (1996), unpublished.
7. B. Tell, T. C. Damen and S. P. S. Porto, Phys. Rev. A
144
, 771 (1966).8. G. Herzberg,Infrared and Raman Spectra of Poly-atomic Molecules, Van Nostrand Reinhold Co., New York (1945).
9. M. Diem, P. L. Polavarupu, M. Obodi and L. A. Nae, J. Am. Chem. Soc.
104
, 3329 (1982). 10. P. T. C. Freire, F. E. A. Melo and J. Mendes-Filho,J. Raman Spectrosc.
27
, 507 (1996).11. J. T. Lopez-Navarrete, V. Hernandez and F. J. Ramirez, Biopolymers
34
, 1065 (1994).12. C. Madec, J. Lauransan and C. Garrigou-Lagrange, Can. J. Spectrosc.
23
, 166 (1978). 13. M. Kakihana, M. Akiyama, T. Naguno and M.Okamoto, Z. Naturforsch., Teil A
43
, 774 (1988). 14. P. Dhamelincourt and F. J. Ramirez, Appl.Spec-trosc.
47
, 446 (1993).15. J. Arenas and R. Parellada, An. Quim.
66
, 283 (1970).16. B. L. Silva, P. T. C. Freire, F. E. A. Melo, I. Guedes, M. A. Araujo Silva, J. Mendes-Filho and A. J. D. Moreno, Braz. J. Phys.
28
, 19 (1998). 17. K. Machida, A. Kagayama, Y. Saito, Y. Kurodaand T. Uno, Spectrochim. Acta A
33
, 569 (1977). 18. S. F. Fischer, G. L. Hofacker and M. A. Ratner,J. Chem. Phys.
52
, 1934 (1970).19. C. H. Wang and R. D. Storms, J. Chem. Phys.