Article
0103 - 5053 $6.00+0.00*e-mail: [email protected]
Lithium Storage into Carbonaceous Materials Obtained from Sugarcane Bagasse
Elaine Y. Matsubara, Stella M. Lala and José Maurício Rosolen*
Department of Chemistry, FFCLRP, University of São Paulo, 14040-930 Ribeirão Preto-SP, Brazil
Materiais carbonaceos com diferentes estruturas são preparados da carbonização do bagaço da cana de açúcar. Os materiais obtidos são caracterizados utilizando-se microscopia de varredura eletrônica e técnicas eletroquímicas. Dependendo das condições de carbonização é possível obter fuligens ricas de partículas tipo locos ou tipo colméia de abelha, cuja concentração tem grande inluência sobre a armazenagem de lítio nos eletrodos. Para fuligens ricas de partículas do tipo colméia observa-se uma capacidade especíica reversível da ordem de 310 mAh g-1. Os resultados
sugerem que o bagaço da cana pode ser um percursor com potencial para o desenvolvimento de materiais anódicos para baterias de ions de lítio.
Carbonaceous materials with different structures are prepared by carbonization of sugarcane bagasse. Depending on carbonization conditions, it is possible to obtain soot rich in lakes or in honeycomb-shaped micrometric particles, whose concentration has large inluence on lithium storage into electrodes. The soot rich in honeycomb-shaped particles provides the best electrochemical performance, with a reversible speciic capacity of 310 mAh g-1. The results
suggest that the sugarcane bagasse can be potentially used in the design of anodic materials for lithium ion batteries.
Keywords: sugarcane, honeycomb carbon, lithium ion battery
Introduction
Li-ion battery is an electrochemical cell with electrodes that can be prepared with several Li intercalation compounds. The electrochemical performance of electrodes consisting of these compounds is strongly controlled by the structural and electronic properties of the intercalation material.1,2 Over the last years several oxides, alloys, and carbons have been claimed for the preparation of Li-ion battery. LiCoO2 and graphite with spheroid shape are the most commonly employed cathodic and anodic materials in commercial Li-ion batteries, respectively. This is because these two compounds, which respectively provide a practical speciic reversible capacity of approximately 135 and 360 mAh g-1, allow the preparation of electrodes with good mechanical properties, low electrochemical impedance, low ohmic drop and relative good thermal stability. They also withstand the pressure applied inside the cells during the preparation of the electrodes and resist the mechanical stress associated with the Li intercalation that takes place during volume
changes and double-layer formation throughout electrical polarization.3 However, in the case of graphite, the control of structural properties in large-scale processing plants is not easy, specially when this ‘plant’ is natural. The genesis of graphite mine can undergo alterations during its extraction. For example, the dimension of crystallites is a parameter that has implications in the preparation of electrode and in the kinetics of lithium intercalation, as well as in the value of speciic capacity
Here we present an investigation of Li electro-intercalation in carbonaceous materials prepared from abundant, inexpensive biomass (less than 15 dollars per
ton). We discuss Li intercalation in carbonaceous materials with different structures, obtained from carbonization of sugarcane bagasse (SB), which is extracted from crushed cane stalk in several mills and is considered a type of natural iber. The Brazilian ethanol industry yields a signiicant and ever-increasing amount of SB, whose main application lies on electricity generation. This kind of application is ineficient and wasteful because large amounts of ash are generated and SB combustion enthalpy is low.4
Li-ion batteries is of utmost importance, especially if these materials can be prepared by large-scale, reproductive, inexpensive, environmentally-friendly processes.
Carbonaceous materials derived from biomass are an interesting alternative approach for the development of new anodic materials. Over the last years several studies about lithium storage in carbon materials derived from rice husk, sugar walnut and almond, coffee, peanut shells, lignin, cotton, wool, starch and oak have been reported.21-30 Results from these works have shown that the electrochemical behavior of the obtained carbonaceous material depends strongly on the type of biomass and on the carbonization conditions. The reversible speciic capacity, columbic eficiency, potential proile and fading capacity will depend on the structure, morphology, and chemical composition of the carbon present in the material.
To the best of our knowledge, Li electro intercalation into carbonaceous materials resulting from SB has not been presented yet, and the mechanisms through which Li is intercalated into this kind of soot are still not completely understood.5-12
Experimental
The carbonization experiments were carried out in a batch-ixed bed reactor built with a quartz tube and a tubular furnace. Nitrogen was employed as purging inert gas, in a low of 900 (sccm-standard cubic centimeters
per minute). Approximately, 10 g of pristine SB were placed in the reactor for each experiment. The pristine SB samples used for the preparation of the carbonaceous materials were obtained as the ethanol manufacturing process byproduct. The SB had not been submitted to any type of chemical or mechanical treatment before carbonization. The same nitrogen lux was used for all the samples placed in the reactor, but different conditions of temperature, time, and heating rate were employed, as shown in Table 1. The resulting samples were named according to the inal temperature they were submitted to (SB420, SB600, SB800, and SB900). Thermogravimetry (TGA) and differential thermal (DTA) analysis of the SB
used in the carbonizations were also performed under nitrogen, at a heating rate of 10 °C min-1, using an SDT 2960 - TA Instrument.
To reduce the effect of grain size on the electrochemical response of the studied materials, the obtained soot was submitted to an agate ball mill for 4 days, and the powder was sieved using a 400 mesh sieve. The obtained chars were also heated at 250 °C under vacuum (1×10³ Pa) for a period of 2 h and stored in an Ar dry-box (MBraum), to avoid any water adsorption.
After being carbonized and mechanically and thermally treated, the samples were further characterized by field emission gun scanning electron microscopy (FE-SEM), (JEOL JSM 6330 F). The speciic surface area (SSA) and the C, H, O, N, and S concentrations were also determined using the Brunauer, Emmett, Teller (BET) method (Quantachrome NOVA 1200 with N2) and elemental analyses (Carlo Erba EA111 equipment).
To study the electrochemical behavior of the obtained materials concerning Li insertion, composite electrodes containing carbon resulting from SB only, 90 wt.%, and polyvinylidene luoride (PVdF) binder, 10 wt.%, were prepared. The slurry of carbon and PVdF, prepared using acetone, was spread on copper foil by means of a doctor blade. After solvent evaporation, the electrodes were hot pressed (1 min, 120 oC, 1.0×10⁷ Pa) and cut into a disc of 8 mm diameter. For total acetone evaporation, the electrodes were placed under vacuum (9.48×10⁴ Pa) at 120 ºC for 24 h and transferred to a dry box, for assembly of the electrochemical cells. All the cells consisted in three electrodes, and highly pure Li was used as both the reference and the auxiliary electrode. The reference electrode was inserted between the working and auxiliary electrodes, so as to minimize the ohmic drop due to electrolyte resistance. The electrolyte was a 1 mol L-1 solution of LiPF
6 in dimethyl carbonate-(DMC), diethyl carbonate-(DEC), and ethylene carbonate-(EC) (Selectipur-1:1:1 m/m/m). The electrochemical characterizations were performed on a Mac Pile and galvanostat-potentiostat by PAR Instruments. The carbon mass loadings of the electrodes (0.5 cm2) ranged between 0.9-3 mg.
Table 1. Summary of carbonization conditions employed for production of the SB samples. The bagasse was heated under nitrogen atmosphere using two
heating rates (R1,2 ), and two carbonization plateaus were identiied for temperature (T1,2) and time (∆t1,2 )
1st plateau 2nd plateau
Sample R1 (ºC min−1) T
1 (ºC) ∆t 1 (min) R2 (ºC min
−1) T
2 (ºC) ∆t 2 (min)
SB420 10 100 10 30 420 120
SB600 30 100 10 30 600 90
SB800 45 180 10 40 800 120
Results and Discussion
Carbonization
SB consists mainly of cellulose, hemi cellulose, and lignin, but it can also contain traces of metals like Na, K, Mg, Ca, and Si.13-15 SB composition depends on the variety of cane and soil, and the elemental analyses carried out in this work indicated that the SB contains H 6.9%, C 48.9%, and O 44.2% before pyrolysis. Previous studies on the pyrolysis of SB, cellulose, and lignin under nitrogen at temperatures up to 600 oC suggested that hemi cellulose is less thermally stable than lignin and cellulose.14,15 Yet, because of structural differences between lignin and cellulose, the thermal degradation of cellulose occurs within a narrow temperature range. On the other hand, lignin should undergo slower decomposition over a broad temperature range. The simultaneous decomposition of lignin and cellulose is expected to take place at temperatures higher than 325 oC, while the degradation of lignin and hemi cellulose should predominate during SB pyrolysis at lower temperatures.
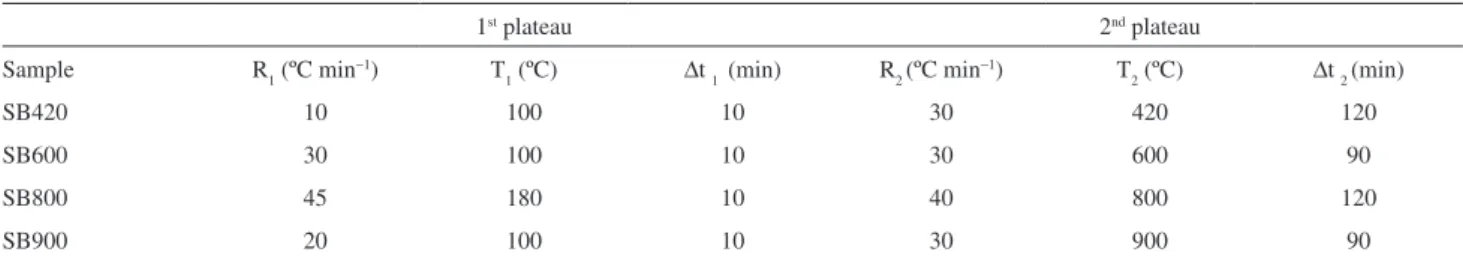
Figure 1 shows the TGA and DTA obtained for SB between 25 and 800 °C, at a heating rate of 10 °C min-1 under nitrogen. The 6.5% weight loss recorded for SB at 100 °C represents water initially present in the sample. SB pyrolysis begins at 220 °C, and the 63.2% weight loss at 350 °C, corresponding to the maximum in the differential curve, corresponds to the degradation of lignin and hemi cellulose present in the SB, mainly. This yields methanol, furfural and acetic acid. From 350 to 446 oC (second maximum peak in the differential curve), the weight loss reaches 80.1% and inally comes to a value of 88.1% at 500 oC. Degradation of both cellulose and lignin is expected in this range. Lignin degradation occurs mainly around 500 oC, thereby furnishing tar and combustible gases. A 1.5% increase in the weight of
the sample is observed above 500 oC, suggesting nitrogen incorporation into the resulting samples.
For the samples prepared at temperature plateaus of 420, 600, 800, and 900 oC, the yields of carbonaceous materials obtained from SB pyrolysis are about 28, 25 and 21%, respectively. These values were estimated from the initial SB weight and the inal weight of the char obtained after each experiment. Table 2 depicts the chemical composition of these samples as determined by elemental analyses. These analyses show that the soot resulting from SB pyrolysis under nitrogen atmosphere yields a large amount of carbon in the case of the SB900 sample. The analyses also indicate there is nitrogen incorporation into the chars prepared from SB pyrolysis during the process of molecular disruption of SB components. It is well known that the heating rate and/or temperature plateau control the rate of volatile evolution from the biomass during biomass pyrolysis. Longer volatile residence times often promote higher char yields.14
Figure 2 reveals that the materials resulting from the pyrolysis carried out in the conditions applied in this study can present high concentrations of structures in the shape of a honeycomb, lake, and plate structure. The several pictures of the SB420 samples evidence large concentrations of micrometric pieces resembling a honeycomb-structure. Higher magniication demonstrates that these particles consist of a structure with open channels containing small holes with an average diameter lying in the range of 5 to 30 mm, and length of about 300 mm (Figure 3). On the other hand, it is more dificult to detect honeycomb soot grains in the analyzed SB600 samples, which suggests a lower concentration of honeycomb-structure and an increase in the amount of lake-structure particles. Finally, when the temperature plateau used in the pyrolysis of the SB is equal to 800 and 900 oC, the soot resulting from SB carbonization contains irregular lakes and plates mainly (samples SB800 and SB900 in Figure 4).
These indings show that, depending on the pyrolysis conditions applied to SB, it is possible to obtain carbonaceous materials whose soot can contain more or fewer quantities of certain types of particles. It is well known that these
Table 2. Elemental analysis (in weight percent, wt.%) of the carbonaceous
materials obtained from SB carbonization applying the conditions described in Table 1
Sample Carbon Hydrogen Nitrogen Sulfur Oxygen
SB420 68.8 3.12 0.52 0.00 27.5
SB600 76.4 1.99 0.57 0.00 21.0
SB800 72.5 1.17 0.34 0.00 26.0
SB900 80.2 0.36 0.31 0.00 19.1
Figure 1. Thermogravimetric and differential thermal curves obtained
structures are present in the raw SB before the carbonization process, but their molecular degradation and carbonization display different kinetics, whose degradation mechanisms were activated in the conditions shown in this work. An evidence of this type of mechanism is the fact that honeycomb-shaped particles can disappear depending on the pyrolysis conditions.
Electrochemical behavior
The electrochemical characterization of the SB electrodes, all of which consist in carbonaceous materials, was carried out by cyclic chronopotentiometry (galvanostatic
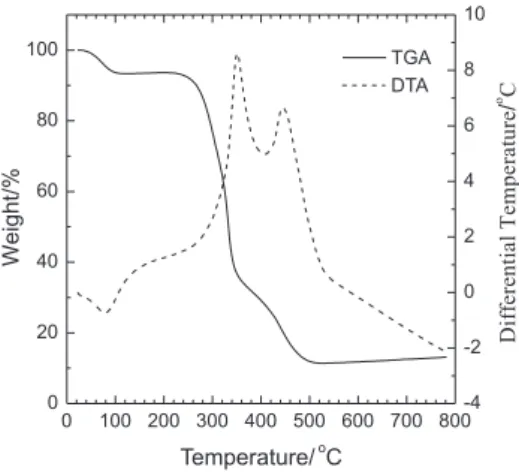
discharge/charge cycles) and linear potential sweep chronoamperometry (voltammograms). The irst technique is particularly interesting for the determination of several parameters of Li-ion intercalation into electrodes; e.g., speciic capacity, capacitance and coulombic eficiency. The electrode potential in this condition can also reveal the presence of phase transitions and stage transition, since it depends on the chemical potential of the ions and electrons in the active material. Under constant current, variation in the electrode potential is also directly inluenced by cell resistance, so the way that the electrode and cell are prepared plays a role in conductivity. Voltammetry, on the other hand, is most often used for determination of the Faradaic and non-Faradaic processes that can take place during polarization of the Li intercalation compounds. It also helps identify whether there are any capacitive or pseudocapacitive contributions to the speciic capacity of the electrode measured under galvanostatic conditions. Voltammetry is also interesting for evaluation of the kinetics of the intercalation process and, in many cases, it allows for the easy identiication of reactions associated with electrolyte electrodecomposition. When the scan rate is as low as 0.1mV s-1, the voltammogram is a good ingerprint of the carbonaceous material with respect to Li intercalation. Thus, in the case of carbonaceous materials, the presence of cathodic-anodic peaks or shoulders in the respective voltammograms can be attributed to Li intercalation into different structural sites or phase, or to electrode passivation. This passivation often occurs at 0.5 V
versus Li in the case of the electrolyte employed during the registration of the voltammograms obtained in this study. Carbon surface passivation results in the formation of a solid electrolyte interphase (SEI), a layer composed by Li salts and polymers covering the carbon surface. More details about the role of this layer in the electrochemical intercalation of Li can be found elsewhere.16 Another common feature of Li intercalation in carbonaceous materials is that the coulombic eficiency, i.e., the ratio between the cathodic and anodic charges, is smaller than one. This decrease is due to electrode passivation or irreversible Li insertion, i.e., Li insertion into sites that hinder its extraction.
Figure 5 shows the voltammograms of SB electrodes prepared with carbonaceous materials and previously characterized by SEM. During the first sweep, all voltammograms present a shoulder at about 0.5 V versus
Li potential, which is associated with SEI formation. This shoulder is clearly visible and becomes virtually a peak as the carbonaceous materials prepared at higher carbonization temperature are used. On the other hand, this shoulder is drastically reduced in the SB420 electrode. This feature
Figure 2. FE-SEM images of typical structures observed in the soot of the
carbonaceous material produced at 420 °C. The arrow indicates a typical honeycomb-structure that can be found in the soot.
Figure 3. FE-SEM pictures of a typical honeycomb-structure found in
the SB420 and SB600 soots observed under different magniications and angles.
Figure 4. FE-SEM images of the carbonaceous materials produced at
can be attributed to the different structure, morphology, and SSA of the material determined by the BET method. The SSAs of the SB420, SB600, SB800, and SB900 samples are 119, 191, 223, and 221 m2 g-1, respectively. A surface with larger SSA and number of edges, as in the case of SB800 and SB900, needs higher charge to be passivated. All voltammograms also have lower coulombic eficiency in the irst cycle, which is smaller than that due to the electrode passivation process, as expected. However, the Faradaic processes associated with Li insertion/extraction that can be noticed in the voltammograms are quite different. Still during the irst sweep, the SB420 voltammogram contains several peaks in the range of 1.0-1.7 V, as well as between 2.25 and 3.25 V, while the other electrodes clearly display an intense cathodic peak near 0 V and a wide anodic peak at 1.2 V. These peaks are associated with Li insertion/extraction and indicate that there are different structural sites for Li insertion/extraction in each kind of carbonaceous material resulting from SB carbonization. In the successive sweep, the proile of the curves associated with Li insertion/extraction changes in the case of the SB420 electrode, mainly (Figure 5a). The cathodic peak in the range of 1.0-1.7 V becomes a cathodic shoulder peak, while those between 2.25 and 3.25 V are drastically
damped, as well as the two wide anodic peaks observed in the irst potential sweep.
These voltammetric curves effectively show that the SB samples present different electrochemical behavior, which is correlated with their structural and morphological features, as expected for carbonaceous materials. The microscopy analyses are not a casual artifact. In addition, the voltammograms suggest that the first cycle of Li insertion leads to drastic structural changes in the SB420 sample. All voltammogram curves still suggest the existence of a small capacitive contribution to the energy storage process, which is visible up to 3.0 V, mainly in the case of the SB420 sample.
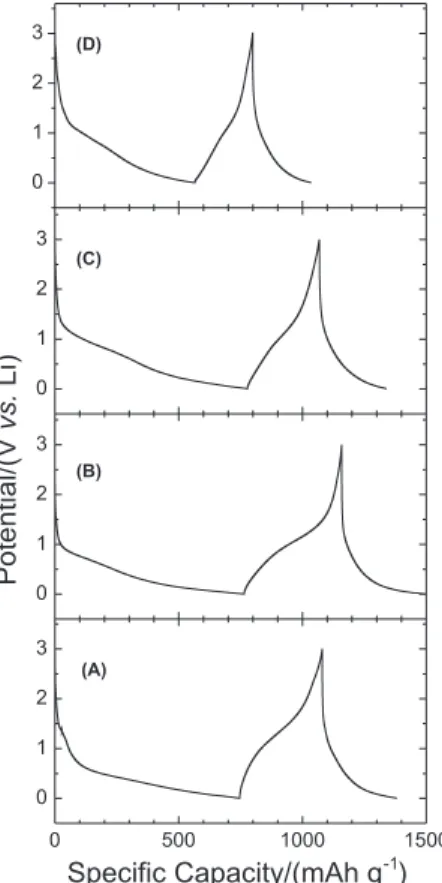
The behavior of these materials under galvanostatic conditions is depicted in Figure 6. The voltage curves support the findings derived from the voltammetric analyses. In addition, the first discharge curve of the amorphous carbon with honeycomb tructure (SB420) has inclination between 1.5 and 0.7 V, and the largest part of the speciic capacity is found in a potential lower than those found for the other morphologies. In the successive cycles, the potential proiles of the curves become similar, and most of the reversible speciic capacity of the electrodes is achieved under 0.5 V, i.e., about 70% of the total reversible capacity. The coulombic eficiency during the irst discharge/charge cycle associated with SEI formation and eventual irreversible insertion of Li is 41% (SB900), 38% (SB800), 51%(SB600), and 45% (SB420). The fade capacity of different morphologies was probed as in Figure 7, which gives the speciic capacity as the number of discharge/charge cycles. The reversible speciic capacity of the SB420 electrode is 310 mAh g-1 at a current density (j) of 0.105 A g-1 after 200 cycles, while for the other SB electrodes the values are 210 mAh g-1 (j = 0.040 A g-1, SB600) , 80 mAh g-1 (j = 0.042 A g-1, SB800), and 130 mA.h.g-1 (j = 0.088 A g-1, SB900).
Taking the electrochemical results into account, it is clear that the honeycomb structure leads to the best results because of its morphology and structure, mainly if we consider that the SB420 electrode was submitted to larger current polarization than the other electrodes. The mass of active material on the copper disk electrodes (diameter of 7 mm) is 3.75 mg of carbon. We have also tested the performance of these electrodes in 1 mol L-1 LiClO
4 EC/DMC, to investigate the inluence of electrolyte in the potential and speciic capacity hysteresis. In the case of SB420, the irreversible speciic capacity of 410 mAh g-1 in Figure 5 decreases to 220 mAh g-1, while the reversible speciic capacity falls to 170 mAh g-1.
Finally, we can try to explain the electrochemical behavior of the carbonaceous materials studied here
Figure 5. Voltammograms collected at low scan rate (0.1 mV s−1) for
considering the contribution due to Li intercalation only and the contribution due to pseudo capacitance. Pseudo capacitance in carbons can appear in sites rich in dangling bonds, like pores, edges, and nanocavities. This should explain the voltammogram shown in Figure 5a, which corresponds to the honeycomb-shaped sample and presents a capacitive behavior between 2.0 and 3.5 V. In the case of the other samples, this capacitive zone is not observed because the concentration of honeycomb-shaped particles is lower in SB600 and absent in SB800 and SB900.
In the case of Li intercalation, the disorder between the graphene planes and their curvatures are important factors influencing the electrochemical performance of carbons associated with the Faradaic process, with kinetics slower than that observed in the case of pseudo capacitance contribution. This is because the localization of Li in a graphene plane depends strongly on charge density localization.17 When turbostratic disorder is present, Li can be inserted between the graphene sheets, but there are no staged phases and the reversible speciic capacity is lower than it would be in well organized planes like graphite. This is because the turbostratic disorder makes it more dificult or impossible for the graphene sheet to move in a way that Li intercalation can take place. This movement facilitating
Li insertion easily happens in the case of graphite with stage formation.18 In fact, carbon coke presents a speciic reversible capacity of 150 mAh g-1 only.19 On the other hand, the curvature of graphene sheets also appears to inluence the speciic reversible capacity associated with Li intercalation because it changes the charge density on the graphene plane. When graphene sheets are curved, the amount of inserted Li should be larger than the one obtained upon Li intercalation into a lat graphene sheet. The reason for this phenomenon is still not clear, but the main experimental evidence of this effect is derived from the hundreds of studies about Li intercalation into carbon nanotubes and, more recently, into graphene derived from mineral graphite.20 The latter always presents larger reversible speciic capacity associated with the Faradaic process compared with graphite.
The role of nitrogen, hydrogen, and oxygen found in the composition of the samples is more dificult to explain because we do not know the exact location of these elements in the graphene planes. Table 1 and the electrochemical results show that there is no apparent speciic correlation between the carbon composition and its coulombic eficiency, reversible speciic capacity, or fading capacity.
Figure 6. Discharge/charge curves of the (A) SB420, (B) SB600,
(C) SB800 and (D) SB900 as a function of the number of cycles. All capacities were obtained between 3 V and 0.001 mV vs. Li potential.
Figure 7. Speciic capacity as a function of the number of discharge/
In short, the speciic reversible capacity of electrodes prepared with carbonaceous materials resulting from SB determined under galvanostatic conditions is predominantly associated with the Faradaic process (Li intercalation). The speciic reversible capacity of our materials should be better due to Li intercalation inside the graphene planes that comprise the structure of the SB samples. The differences observed between the reversible speciic capacities of the SB samples are associated with the morphological and structural characteristics of the samples. The reversible speciic capacity is larger in the case of soot composed by carbonaceous materials containing particles with largely curved surfaces (SB420, 600), compared with those consisting of lat surfaces (SB800, 900). The presence of a small capacitive contribution identiied in the voltammogram of SB420 (Figure 5a) seems to be associated with the double-layer, and we believe that this is due to the different electronic behavior of the SB420 samples with respect to the other samples obtained at higher temperatures. On the other hand, the irreversible speciic capacity or the coulombic eficiency appears to be associated with SEI formation and the presence of structural sites that could act as a trap for Li ions. Dispersive energy spectroscopy of the SB ash employed in the preparation of the samples detected the presence of metals (Si, Ca, Fe). The correlation between the SSA values and the Coulombic eficiency is not linear as expected in materials free of irreversible sites for lithium storage, like graphite.
Conclusions
This work shows that SB can be used in the production of interesting carbonaceous materials. SB carbonization is an inexpensive, convenient process. Depending on the pyrolysis conditions, the produced soot can consist of particles in the shape of lakes, plates, or honeycomb. A large concentration of honeycomb-shaped particles was found in the sample obtained at the lower carbonization temperature. The electrochemical characterization of several structures showed that when the soot has a higher concentration of honeycomb-shaped structures, its speciic reversible capacity can reach values as high as 310 mAh g-1, with low fading capacity. The inluence of H, O, N on the electrochemical performance seems to be weaker than that of the structural properties. The results also show that the curvature of the carbon particles has a decisive effect on the reversible speciic capacity. The coulombic eficiency of the soot in the studied electrolyte was found to depend mainly on electrolyte decomposition. The role played by Si concentration and the presence of other impurities in
the electrochemical performance (hysteresis and speciic capacity) needs to be better elucidated, so that this material can be applied in the development of anodic materials for lithium ion storage in the future. The inluence of electrolyte is another aspect that calls for more thorough investigation. Finally, it is relevant to consider the correlation that can exist between the sugar cane species and its cultivation management for future developments. The impurities in the structure of carbonaceous materials (metals) are absorbed from the soil, and their absorption depends on climatic conditions, biomass species, and soil, for instance. In our work we have used raw sugar cane bagasse from the same speciea, but collected from different companies at different periods of cultivation, and the results were identical.
Acknowledgments
The financial support for this research work was provided by Fundação de Amparo à Pesquisa do Estado de São Paulo (FAPESP: 06/07253-8) and CNPq. The authors acknowledge the Electron Microscopy Laboratory of Brazilian Synchrotron Light Laboratory (LME/LNLS) for technical support during the electron microscopy work.
References
1. Prakash, S.; Mustain, W. E.; Kohl, P. A.; J. Power Sources2009, 15, 1184.
2. Lala, S. M.; Montoro, L. A.; Lemos, V.; Abbate, M.; Rosolen, J. M.; Electrochim. Acta2005, 51, 7.
3. Rosolen, J. M.; Decker, F.; J. Electrochem. Soc.1996, 8, 2417. 4. Katyal, S.; Thambimuthu, K.; Valix, M.; Renewable Energy
2003, 28, 713.
5. Dahn, J. R.; Sleigh, A. K.; Shi, H.; Reimers, J. N.; Zhong, Q.; Way, B. M.; Electrochim. Acta1993, 38, 1179.
6. Hayes, S.; van Wüllen, L.; Eckert, H.; Even, W. R.; Crocker, R. W.; Zhang, Z.; Chem. Mater1997, 9, 901.
7. Flandrois, S.; Simon, B.; Carbon1999, 37, 165.
8. Buiel, E.; George, A. E.; Dahn, J. R.; J. Electrochem. Soc.1998, 145, 2252.
9. Sato, K.; Noguchi, M.; Demachi, A.; Oki, N.; Endo, M.; Science
1994, 264, 556.
10. Zheng, T.; Mc Kinnon, W. R.; Dahn, J.,R.; J. Electrochem. Soc.
1996, 143, 2137.
11. Guerin, K.; Fevrier-Bouvier, A.; Flandois, S.; Simon, B.; Biensan, P.; Electrochim. Acta2000, 45, 1607.
12. Endo, M.; Nishimura, Y.; Takahashi, T.; Takeuchi, K.; Dreselhaus, M. S.; J. Phys. Chem. Solids1996, 57, 725. 13. Zandersons, J.; Gravitis, J.; Kokorevics, A.; Zhurinsh, A.;
Bikovens, O.; Tardenaka, A.; Spince, B.; Biomass Bioenergy
14. Katyal, S.; Thambimuthu, K.; Valix, M.; Renewable Energy
2003, 28, 713.
15. Rasul, M. G.; Rudolph, V.; Carsky, M.; Fuel1999, 78, 905. 16. Martha, S. K.; Markevich, E.; Burgel, V.; Salitra, G.; Zinigrad,
E.; Markovsky, B.; Sclar, H.; Pramovich, Z.; Heik, O.; Aurbach, D.; Exnar, I.; Buqa, H.; Drezen, T.; Semrau, G.; Schmidt, M.; Kovacheva, D.; Saliyski, N.; J. Power Sources2009, 189, 288. 17. Titantah, J. T.; Lamoen, D.; Schowalter, M.; Rosenauer, A.;
Carbon2009, 47, 2501.
18. Dahn, J. R.; Fong, R.; Spoon, M. J.; Phys. Rev. B 1999, 42(10), 6424.
19. Passerini, S.; Rosolen, J. M.; Scrosati, B.; J. Power Sources
1993, 45, 333.
20. Wang, G.; Shen, X.; Yao, J.; Park, J.; Carbon2009, 47, 2049. 21. Fey, G. T. K.; Lee, D. C.; Lin, Y. Y.; Prem Kumar, T.; Synth.
Met.2003, 139, 71.
22. Xing, W.; Dunlap, R. A.; Dahn, J. R.; J. Electrochem. Soc.1998, 145, 62.
23. Fey, G. T. K.; Chen, C. L.; J. Power Sources2001, 97/98, 47. 24. Peled, E.; Eshkenazi, V.; Rosenberg, Y.; J. Power Sources1998,
76, 153.
25. Gibaud, A.; Xue, J. S.; Dahn, J. R.; Carbon1996, 34, 499. 26. Xing, W.; Xue, J. S; Zheng, T.; Gibaud, A.; Dahn, J. R.;
J. Electrochem. Soc.1996, 143, 3482.
27. Fey, G. T. K.; Kao, Y. C.; Mater. Chem. Phys.2002, 73, 37. 28. Fey, G. T. K.; Chen, K. L.; Chang, Y. C.; Mater. Chem. Phys.
2002, 76, 1.
29. Wang, G. X.; Ahn, J. H.; Lindsay, M. J.; Sun, L.; Bradhurst, D. H.; Dou, S. X.; Liu, H. K.; J. Power Sources2001, 97/98, 211. 30. Hwang, Y. J.; Jeong, S. K.; Shin, J. S.; Nahm, K. S.; Stephan,
A. M.; J. Alloys Compounds2008, 448, 141.
Submitted: November 11, 2009
Published online: June 23, 2010