Article
Printed in Brazil - ©2016 Sociedade Brasileira de Química0103 - 5053 $6.00+0.00*e-mail: [email protected]
Modelling of Lead Migration from Electronic Waste to Mixtures of Kaolinite, Iron
Oxides and Organic Matter
Odilaine I. C. Damasceno,* César Reis, Efraim L. Reis, Carlos R. Bellato and André F. de Oliveira
Departamento de Química, Universidade Federal de Viçosa (UFV), 36570-900 Viçosa-MG, Brazil
Improper disposal of electronic waste in the environment facilitates migration of heavy metals, especially lead, into the soil and can contribute to the bioavailability of this species. Based on a simplex-centroid mixture experimental design, small-scale tests were performed for incubation of printed circuit boards (PCBs) in mixtures containing organic matter (OM), kaolinite (KA) and iron oxides (IO) to verify lead migration. Regression equations were acquired and were adjusted to the obtained responses. Results showed high total content of Pb, ranging from 400 to 4000 mg kg-1, depending on the mixture and incubation time. Mobility and/or bioavailability
of lead in the mixtures were evaluated by a three-step sequential extraction. The bioavailability factor (BF) was obtained from the ratio of the sum of exchangeable fraction (F1) and the organically bound fraction (F2) by F1, F2 and the residual fraction (F3) and the values of bioavailability factor for Pb, the heavy metal considered of greatest environmental concern in this study, ranged between 0.16 and 0.52.
Keywords: electronic waste, mixtures, lead, bioavailability
Introduction
Electronic waste (e-waste) is the term used to describe residues of obsolete electronic equipment such as televisions, cell phones, computers and other devices. From the point of view of material composition, e-waste can be defined as a mixture of various metals such as copper, aluminum, iron, zinc, nickel, lead, cadmium and mercury associated with various types of plastics and ceramic materials.1
The increasing generation of electronic waste occurs mainly as a result of technological development that makes the time of use of electronic equipment become shorter. For example, cell phones are used for only 18 months on average before being replaced, even if they can be operated longer.2 Waste from electrical and electronic equipment
already constitutes 8% of municipal waste and is one of the fastest growing waste fractions.3
Brazil is considered one of the largest producers of electronic waste among emerging countries. It is estimated that currently about 679,000 t year-1 of e-waste
is generated.4 Regarding cell phones, about 10 to 20% of
phones produced in Brazil are discarded each year.5
The environmental concern in relation to e-waste, old and obsolete computers, televisions, cell phones, audio equipment, batteries and others has been growing in recent years, since this type of waste ends up releasing heavy metals, such as lead, which can reach the water table and pollute entire regions. Lead is present in the solder of printed circuit boards and other electronic components, and in cathode ray tube monitors and televisions.
Contamination of the environment by lead from electronic waste causes serious risks to living beings, especially human health, representing a major environmental concern.6-9 Lead can cause damage to the human central
nervous system and kidneys. Negative effects on the endocrine system have also been observed and problems related to brain development in children have been documented.10 Lead accumulates in the environment and
has acute and chronic toxic effects on plants, animals and microorganisms.9,11,12
Electronic waste is responsible for approximately 70% of the heavy metals and 40% of lead found in landfills.13
The main concern is, therefore, the potential of leaks contaminating the soil and groundwater.
Tropical soils present compositions with varying amounts of iron oxide, kaolinite and organic matter.14 When
with the soil, several phenomena can occur depending on the soil composition and physicochemical properties.
The bioavailability of metals in soil is a process that depends on explicit combinations of chemical, biological and environmental parameters. These include, among others, soil properties such as pH, organic matter content, and redox potential.15
The methodologies used to assess the bioavailability of metals in the environment are sequential extraction in which the amount of released metal is correlated with the extraction solution used, and bioassays in which a living body is exposed to the sample, followed by quantification of adverse effects on the population tested.16
Thus, the main objective of this study was to model the contamination potential and the bioavailability of lead present in electronic waste by means of assays for simulating the behavior of this type of waste in mixtures of the main constituents of soils found in Brazil, carried out on a small scale, using experimental design for mixtures.17
Experimental
Preparation of the electronic waste sample and determination of metals
The e-waste sample was obtained from printed circuit boards (PCBs) of obsolete computers, having previously removed the batteries. The PCBs were guillotined to generate irregular pieces of approximately 9 cm2, and part
of the sample was pulverized in a hammer mill, obtaining two types of samples: chopped and pulverized.
For determination of the metals, approximately 7.0 g of the pulverized e-waste sample were placed in contact with 105 mL of aqua regia overnight, and then the system
was heated to 115 ± 5 °C under reflux for 2 h. After cooling, filtration was conducted using filter paper for rapid filtration into a 250.0 mL flask, using a 5% (v/v) HCl solution for washing the residue, completing the volume of the volumetric flask. In the filtrate the contents of Cu, Pb, Zn, Ni and Sn were determined in an atomic absorption spectrometer (Agilent Technologies 200 Series AA).
Assembly of the design with mixtures
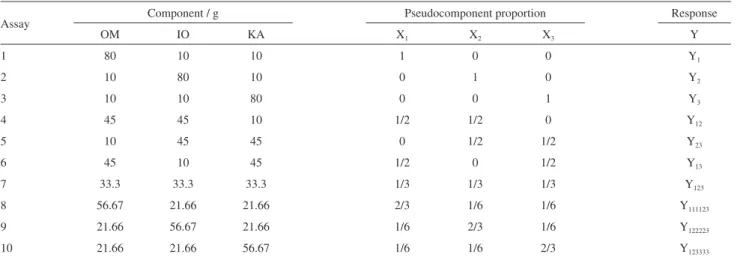
A simplex-centroid mixture experimental design was used according to Cornell17 containing organic matter (OM,
“Litter”) collected in the Universidade Federal de Viçosa (UFV) forest (Viçosa, MG, Brazil), kaolinite (KA; Mar de Espanha, MG, Brazil) and iron oxide (IO) concentrates from perferric red latosol (Itabirito, MG, Brazil) to verify the effect of such mixtures on the release of Pb from PCBs. The assays were conducted in 500 mL polyethylene pots to which 100 g of each mixture and 30 g of the chopped circuit boards were added. The proportions of the components were distributed according to Table 1, where the responses were Pb content, pH, redox potential and conductivity, determined in each assay via three samplings performed every 120 days. The material of each assay was revolved and moistened once a week. Masses of components relate with the pseudocomponents16 by the following equation:
mIO = mOM = mKA = 70Xi + 10.
Sampling
Three samples were taken every 120 days of the experiment and after manual removal of PCB parts were air dried. The dried sample was ground, passed through an 80 mesh sieve (0.177 mm) and stored for posterior analysis.
Table 1. Experimental design for the simplex centroid mixtures in pseudocomponents
Assay Component / g Pseudocomponent proportion Response
OM IO KA X1 X2 X3 Y
1 80 10 10 1 0 0 Y1
2 10 80 10 0 1 0 Y2
3 10 10 80 0 0 1 Y3
4 45 45 10 1/2 1/2 0 Y12
5 10 45 45 0 1/2 1/2 Y23
6 45 10 45 1/2 0 1/2 Y13
7 33.3 33.3 33.3 1/3 1/3 1/3 Y123
8 56.67 21.66 21.66 2/3 1/6 1/6 Y111123
9 21.66 56.67 21.66 1/6 2/3 1/6 Y122223
10 21.66 21.66 56.67 1/6 1/6 2/3 Y123333
Analysis of the mixtures
The variables measured were pH (bench potentiometer HANNA instruments 8519 equipped with a combined electrode of glass and Ag/AgCl reference), electrical conductivity (JENWAY 4010 Conductivity Meter) and redox potential (bench potentiometer HANNA instruments 8519 equipped with Pt electrode and Ag/AgCl reference), where measurements were performed in a 1:2.5 (m/v) aqueous extract.
For the determination of Pb, approximately 250 mg of the sample was weighed into a polytetrafluoroethylene (PTFE) vessel which was supplemented with 8 mL of HNO3, 4 mL of HF and 2 mL of H2O2. The pots were
sealed and transferred to a microwave oven (Milestone-Ethos 1), reaching the temperature of 200 °C in 10 min and maintained for 20 min at a power setting of 1200 W. After heating, the vessels were chilled and the digested material was filtered to a 25.00 mL volumetric flask with filter paper for rapid filtration, and the volume completed with deionized water. The Pb content was determined in an atomic absorption spectrometer, equipped with a hollow cathode lamp and a deuterium background corrector at wavelength of 217.0 nm, with slit of 1 nm, lamp current of 5 mA and using an air-acetylene flame (Agilent Technologies 200 Series AA).
Other operating conditions were as recommended by the manufacturer, unless otherwise specified. The same procedure was performed for the constituents of the mixtures, i.e., OM, KA and IO, in order to determine the metal content in each mixture.
Sequential extraction of lead
To analyze the mobility and bioavailability of Pb present in the mixtures, sequential extraction of the sample collected after 360 days was carried out, in triplicate, adapted from Egreja Filho et al.18 In the first step the exchangeable
fraction (F1) was extracted, by adding 8.0 mL of a 1 mol L-1
solution of potassium nitrate with pH adjusted to 7.00, to approximately 1.0 g of the pulverized sample. The suspension was continuously stirred for 60 min, centrifuged for 20 min at 3000 rpm (1509 g) and filtered through filter paper for rapid filtration into a 10.00 mL volumetric flask. The organically bound fraction (F2) was extracted from the residue of the first step by continuously stirring for 120 min in the presence of 20.0 mL of a solution of 0.05 mol L-1
EDTA, adjusted to pH 7.00. After centrifuging for 20 min at 3000 rpm (1509 g) and filtering through filter paper for rapid filtration, the extract was treated with 5 mL of concentrated HNO3, heated, cooled and transferred to a
25.00 mL volumetric flask. In each fraction the Pb content was determined by atomic absorption spectrometry for each mixture sample. The Pb content in the residual fraction (F3) was obtained from the difference between the total and the sum of the F1 and F2 fractions.
Considering that mobility of metals decreases from F1 to F3, the bioavailability factor (BF) for Pb was calculated by dividing the sum of fractions F1 and F2 by the total sum of the fractions, F1 + F2 + F3.15
Results and Discussion
Determination of metals in the electronic waste
In several previous studies, the content of metals in e-waste differed due to heterogeneity of the sample, and mainly due to the different origins of the PCBs, which were acquired from equipment of different companies and ages. However, the Pb content in this study is comparable to the levels found in the literature.19-21
In the present study, five metals present in the e-waste were determined, where copper was the metal in highest percentage (22.9%) followed by zinc (3.0%), lead (2.6%), tin (2.4%) and nickel (0.4%).
Among the metals analyzed in the electronic waste, Pb is the heavy metal of greatest environmental concern, even though it is not found in greatest proportion, due to its greater toxicity and because it is exposed on the PCBs.22 Therefore, the migration of Pb from the PCBs to
the mixture of kaolinite, iron oxides and organic matter was investigated, in order to verify the influence of these mixtures on the release of Pb, demonstrating a great concern regarding its potential to negatively impact the environment.
Modeling of the mixtures
The quadratic or special cubic models were adjusted to the responses obtained for the mixtures, i.e., the pH value, electric conductivity, redox potential and lead content, using the software package Statistica 8.0, obtaining the response surfaces shown in Figures 1 and 2, which were generated from the models whose coefficients are shown in Tables 2 and 3. These responses were obtained for each assay and the models were adjusted as a function of the pseudocomponents. Each pure pseudocomponent contained 80% of the corresponding component, as shown in Table 1.
120 days 240 days 360 days 0.00 0.25 0.50 0.75 1.00 KA 0.00 0.25 0.50 0.75 1.00 OM
0.00 0.25 0.50 0.75 1.00 IO > 1800 < 1800 < 1600 < 1400 < 1200 < 1000 < 800 < 600 < 400 0.00 0.25 0.50 0.75 1.00 KA 0.00 0.25 0.50 0.75 1.00 MO
0.00 0.25 0.50 0.75 1.00 OF > 2500 < 2500 < 2000 < 1500 < 1000 < 500 0.00 0.25 0.50 0.75 1.00 KA 0.00 0.25 0.50 0.75 1.00 OM
0.00 0.25 0.50 0.75 1.00 IO > 4000 < 4000 < 3000 < 2000 < 1000
Figure 2. Response surfaces for total Pb content in the mixtures.
Figure 1. Response surfaces for pH, electrical conductivity and redox potential.
0.00 0.25 0.50 0.75 1.00 KA 0.00 0.25 0.50 0.75 1.00 OM
0.00 0.25 0.50 0.75 1.00 IO > 8.5 < 8.5 < 8 < 7.5 < 7 < 6.5 < 6 0.00 0.25 0.50 0.75 1.00 KA 0.00 0.25 0.50 0.75 1.00 OM
0.00 0.25 0.50 0.75 1.00 IO > 3000 < 3000 < 2500 < 2000 < 1500 < 1000 < 500 0.00 0.25 0.50 0.75 1.00 KA 0.00 0.25 0.50 0.75 1.00 OM
0.00 0.25 0.50 0.75 1.00 IO > 240 < 240 < 200 < 160 < 120 < 80 0.00 0.25 0.50 0.75 1.00 KA 0.00 0.25 0.50 0.75 1.00 OM
0.00 0.25 0.50 0.75 1.00 IO > 8 < 8 < 7.5 < 7 < 6.5 < 6 < 5.5 0.00 0.25 0.50 0.75 1.00 KA 0.00 0.25 0.50 0.75 1.00 OM
0.00 0.25 0.50 0.75 1.00 IO > 4000 < 4000 < 3500 < 3000 < 2500 < 2000 < 1500 < 1000 0.00 0.25 0.50 0.75 1.00 KA 0.00 0.25 0.50 0.75 1.00 OM
0.00 0.25 0.50 0.75 1.00 IO > 300 < 300 < 280 < 260 0.00 0.25 0.50 0.75 1.00 KA 0.00 0.25 0.50 0.75 1.00 OM
0.00 0.25 0.50 0.75 1.00 IO > 8 < 8 < 7.5 < 7 < 6.5 < 6 0.00 0.25 0.50 0.75 1.00 KA 0.00 0.25 0.50 0.75 1.00 OM
0.00 0.25 0.50 0.75 1.00 IO > 4000 < 4000 < 3500 < 3000 < 2500 < 2000 < 1500 < 1000 < 500 0.00 0.25 0.50 0.75 1.00 KA 0.00 0.25 0.50 0.75 1.00 OM
0.00 0.25 0.50 0.75 1.00 IO > 340 < 340 < 320 < 300 < 280 < 260 < 240 pH 120 days 240 days 360 days
Conductivity / (µS cm-1) Potential / mV
120 days 240 days 360 days
0.00 0.25 0.50 0.75 1.00 KA 0.00 0.25 0.50 0.75 1.00 OM
0.00 0.25 0.50 0.75 1.00
IO > 1800 < 1800 < 1600 < 1400 < 1200 < 1000 < 800 < 600 < 400 0.00 0.25 0.50 0.75 1.00 KA 0.00 0.25 0.50 0.75 1.00 MO
0.00 0.25 0.50 0.75 1.00
OF > 2500 < 2500 < 2000 < 1500 < 1000 < 500 0.00 0.25 0.50 0.75 1.00 KA 0.00 0.25 0.50 0.75 1.00 OM
0.00 0.25 0.50 0.75 1.00
IO > 4000 < 4000 < 3000 < 2000 < 1000 0.00 0.25 0.50 0.75 1.00 KA 0.00 0.25 0.50 0.75 1.00 OM
0.00 0.25 0.50 0.75 1.00
IO > 8.5 < 8.5 < 8 < 7.5 < 7 < 6.5 < 6 0.00 0.25 0.50 0.75 1.00 KA 0.00 0.25 0.50 0.75 1.00 OM
0.00 0.25 0.50 0.75 1.00
IO > 3000 < 3000 < 2500 < 2000 < 1500 < 1000 < 500 0.00 0.25 0.50 0.75 1.00 KA 0.00 0.25 0.50 0.75 1.00 OM
0.00 0.25 0.50 0.75 1.00
IO > 240 < 240 < 200 < 160 < 120 < 80 0.00 0.25 0.50 0.75 1.00 KA 0.00 0.25 0.50 0.75 1.00 OM
0.00 0.25 0.50 0.75 1.00
IO > 8 < 8 < 7.5 < 7 < 6.5 < 6 < 5.5 0.00 0.25 0.50 0.75 1.00 KA 0.00 0.25 0.50 0.75 1.00 OM
0.00 0.25 0.50 0.75 1.00
IO > 4000 < 4000 < 3500 < 3000 < 2500 < 2000 < 1500 < 1000 0.00 0.25 0.50 0.75 1.00 KA 0.00 0.25 0.50 0.75 1.00 OM
0.00 0.25 0.50 0.75 1.00
IO > 300 < 300 < 280 < 260 0.00 0.25 0.50 0.75 1.00 KA 0.00 0.25 0.50 0.75 1.00 OM
0.00 0.25 0.50 0.75 1.00
IO > 8 < 8 < 7.5 < 7 < 6.5 < 6 0.00 0.25 0.50 0.75 1.00 KA 0.00 0.25 0.50 0.75 1.00 OM
0.00 0.25 0.50 0.75 1.00
IO > 4000 < 4000 < 3500 < 3000 < 2500 < 2000 < 1500 < 1000 < 500 0.00 0.25 0.50 0.75 1.00 KA 0.00 0.25 0.50 0.75 1.00 OM
0.00 0.25 0.50 0.75 1.00
IO > 340 < 340 < 320 < 300 < 280 < 260 < 240 pH 120 days 240 days 360 days
There was virtually no variation of pH during the entire incubation period, maintaining the same profile in the mixtures, i.e., mixtures containing greater proportions of IO showed higher pH of approximately 8.0, and mixtures containing higher proportions of OM or KA presented lower pH values around 6.0. Therefore, degradation suffered by the PCBs did not result in considerable variation in the pH value.
Electrical conductivity was highly variable in relation to the mixtures, but did not vary over the incubation time. Although the H+ ion is that of greatest mobility, since there
was no large variation in pH it can be inferred that this ion had little influence on electrical conductivity, because KA presented a relatively low pH and low conductivity. The presence of ionic groups in the OM may be responsible for the high conductivity of mixtures containing larger quantities thereof, however it appears that the degradation of PCBs did not contribute to increase the total ionic activity since there is no increase in conductivity with time.
An interesting phenomenon occurred with the redox potential during the incubation period. At 120 days, the greatest potentials were recorded for the pseudocomponents KA and OM, observing antagonistic effects between these two variables and between the variables OM and IO. Over the incubation period, the potentials in the binary mixtures KA/OM and IO/OM suffered an increase, reaching a synergistic effect at 360 days, as can be observed in the values of the coefficients shown in Table 2. It appears that the interaction between the PCBs and the components of
the mixtures, with participation of the biological activities of microorganisms in the OM, are responsible for these changes in the redox potential.
The total Pb contents in the mixtures ranged from 400 to 1800 mg kg-1 at 120 days of incubation, reaching
a range of 1000-4000 mg kg-1 at 360 days of incubation.
In all mixtures, the incubation time contributed to increase the amount of lead transferred from the PCBs to the mixtures of components (Figure 2). However, for mixtures containing larger amounts of KA, metal contamination was less than for mixtures containing higher proportions of OM and IO, showing that environments containing higher proportions of OM and IO contribute more effectively to the degradation of PCBs and consequent retention of the released metal.
Lead complexation by organic matter and its retention by minerals such as goethite contained in iron oxides may have been the main factors for this difference in favor of OM and IO.
According to the models (Table 3), antagonistic effects can be observed throughout the incubation period between the binary mixtures OM/IO (Table 1, assay 4) and at 360 days of incubation between the OM/KA blends. This means that the binary mixture OM/IO contributes less than the average of the contributions of the pure pseudocomponents OM and IO, where the same occurred with the mixture OM/KA in relation to the pure pseudocomponents OM and KA. The interaction between
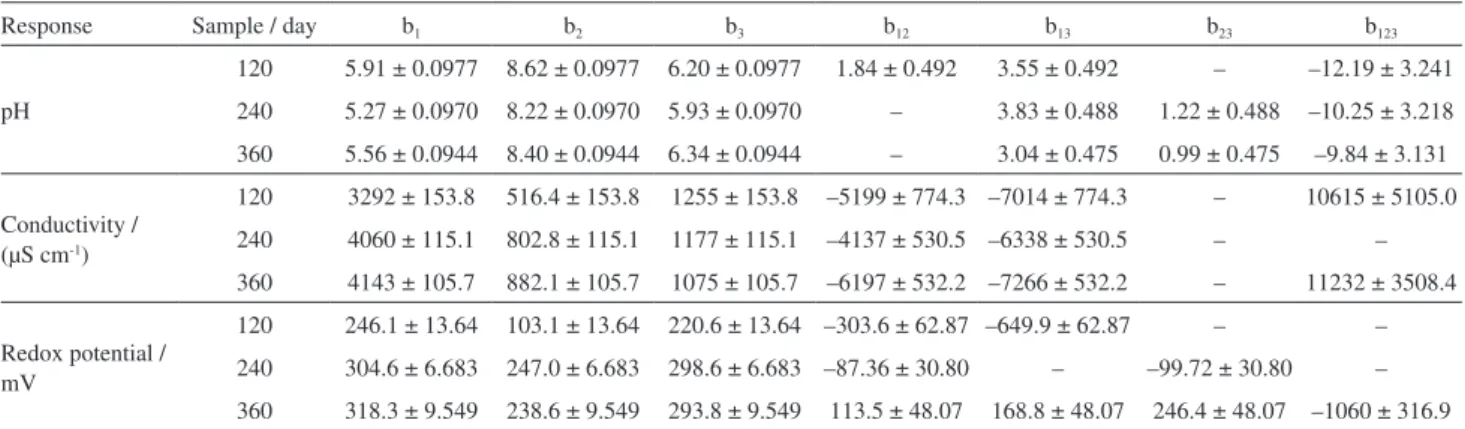
Table 2. Coefficientsa of the models with respective errors at different incubation times for the responses pH, conductivity and redox potential
Response Sample / day b1 b2 b3 b12 b13 b23 b123
pH
120 5.91 ± 0.0977 8.62 ± 0.0977 6.20 ± 0.0977 1.84 ± 0.492 3.55 ± 0.492 – –12.19 ± 3.241
240 5.27 ± 0.0970 8.22 ± 0.0970 5.93 ± 0.0970 – 3.83 ± 0.488 1.22 ± 0.488 –10.25 ± 3.218
360 5.56 ± 0.0944 8.40 ± 0.0944 6.34 ± 0.0944 – 3.04 ± 0.475 0.99 ± 0.475 –9.84 ± 3.131
Conductivity / (µS cm-1)
120 3292 ± 153.8 516.4 ± 153.8 1255 ± 153.8 –5199 ± 774.3 –7014 ± 774.3 – 10615 ± 5105.0
240 4060 ± 115.1 802.8 ± 115.1 1177 ± 115.1 –4137 ± 530.5 –6338 ± 530.5 – –
360 4143 ± 105.7 882.1 ± 105.7 1075 ± 105.7 –6197 ± 532.2 –7266 ± 532.2 – 11232 ± 3508.4
Redox potential / mV
120 246.1 ± 13.64 103.1 ± 13.64 220.6 ± 13.64 –303.6 ± 62.87 –649.9 ± 62.87 – –
240 304.6 ± 6.683 247.0 ± 6.683 298.6 ± 6.683 –87.36 ± 30.80 – –99.72 ± 30.80 –
360 318.3 ± 9.549 238.6 ± 9.549 293.8 ± 9.549 113.5 ± 48.07 168.8 ± 48.07 246.4 ± 48.07 –1060 ± 316.9
aEstimated with 95% probability.
Table 3. Coefficientsa of the models with respective errors at different incubation times for the response of Pb content
Response Sample / day b1 b2 b3 b12 b13 b23
Pb content / (mg kg-1)
120 1896 ± 143.2 1814 ± 143.2 311.9 ± 143.2 –2026 ± 660.0 – –
240 2229 ± 156.2 2830 ± 156.2 – –3367 ± 719.9 – –
360 4789 ± 283.0 4823 ± 283.0 850.3 ± 283.0 –4807 ± 1304 –3257 ± 1304 –
OM and IO may have contributed to the antagonistic effect between the variables.
Sequential extraction of Pb
The modeling of lead migration from the PCBs to the mixtures, obtained by the total lead content, is useful as an overall indicator of pollution, however it does not provide information about the risk of bioavailability of this metal. By means of sequential extraction it is possible to determine the Pb contents in F1, F2 and F3 fractions, which permits understanding the amount of Pb that may be bioavailable in the medium.
The BF for lead, according Singh and Kalamdhad,15
calculated as the ratio of the sum of fractions F1 and F2 by the total content, provides information on the mobility of Pb and its risk of bioavailability.
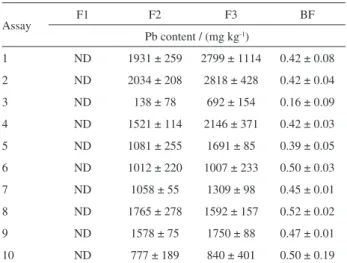
Table 4 lists the Pb contents in the fractions and bioavailability factor in each assay of the experimental mixtures design. In F1, wherein Pb is more poorly retained, it was not possible to detect the metal, i.e., Pb is distributed in the organic and residual fractions, thus more strongly retained.
A quadratic model was adjusted only to the F2 data since it is the most important fraction in terms of bioavailability potential (Figure 3). The coefficients were estimated with 95% probability and showed that the pseudocomponents OM and IO contributed most to the amount of Pb in fraction F2, as shown in Figure 3. It was observed that the same tendency was verified in the study of total Pb content as a function of the mixture variables, as shown in Figure 2.
A quadratic model was also adjusted to the bioavailability factor data (Figure 4) showing that there is a synergistic effect between the pseudocomponents KA and OM, suggesting that all mixtures contained in the maximum response region of the experimental space can be approximated to a triangle region whose vertices would be approximately (0.50, 0.00, 0.50), (0.75, 0.0, 0.25) and (0.55, 0.15, 0.30) where lead bioavailability potential is greatest.
Conclusions
The models suggest that lead contained in PCBs selectively migrates to the mixture according to its composition, allowing to predict contamination which may occur with this metal due to disposal of electronic waste in soils whose main components are organic matter, iron oxides and kaolinite. Results showed that direct disposal of electronic waste into the soil environment is a cause of lead contamination, because although this metal is not found in the greatest proportion on the circuit board, its migration is facilitated by the fact that it is exposed on the PCBs.
Table 4. Pb content determined in sequential extraction of the mixtures
and the bioavailability factor
Assay F1 F2 F3 BF
Pb content / (mg kg-1)
1 ND 1931 ± 259 2799 ± 1114 0.42 ± 0.08
2 ND 2034 ± 208 2818 ± 428 0.42 ± 0.04
3 ND 138 ± 78 692 ± 154 0.16 ± 0.09
4 ND 1521 ± 114 2146 ± 371 0.42 ± 0.03
5 ND 1081 ± 255 1691 ± 85 0.39 ± 0.05
6 ND 1012 ± 220 1007 ± 233 0.50 ± 0.03
7 ND 1058 ± 55 1309 ± 98 0.45 ± 0.01
8 ND 1765 ± 278 1592 ± 157 0.52 ± 0.02
9 ND 1578 ± 75 1750 ± 88 0.47 ± 0.01
10 ND 777 ± 189 840 ± 401 0.50 ± 0.19
F1: exchangeable fraction; F2: organic fraction; F3: residual fraction; BF: bioavailability factor; ND: not detected.
0.00 0.25 0.50 0.75 1.00 KA
0.00
0.25
0.50
0.75
1.00
OM
0.00 0.25 0.50 0.75 1.00
IO
> 0.5 < 0.5 < 0.4 < 0.3 < 0.2
Figure 4. Response surface for the bioavailability factor (BF) of Pb in
the mixtures.
0.00 0.25 0.50 0.75 1.00 KA
0.00
0.25
0.50
0.75
1.00
OM
0.00 0.25 0.50 0.75 1.00
IO
> 2000 < 2000 < 1600 < 1200 < 800 < 400
Figure 3. Response surface for Pb content of the organic fraction (F2)
of the mixtures.
0.00 0.25 0.50 0.75 1.00 KA
0.00
0.25
0.50
0.75
1.00
OM
0.00 0.25 0.50 0.75 1.00
IO
> 0.5 < 0.5 < 0.4 < 0.3 < 0.2
0.00 0.25 0.50 0.75 1.00 KA
0.00
0.25
0.50
0.75
1.00
OM
0.00 0.25 0.50 0.75 1.00
IO
Although there was degradation of the circuit board with consequent metal release, there was no significant change in the parameters pH, potential and conductivity between the periods of 120 and 360 days.
The results in sequential extraction of Pb suggested that this metal can become bioavailable, being significantly found in the organic fraction mainly for the pseudocomponents OM and IO.
Acknowledgments
To FAPEMIG for the financial support.
References
1. Cui, J.; Zhang, L.; J. Hazard. Mater. 2008, 158, 228. 2. United States Environmental Protection Agency (US EPA); The
Life Cycle of a Cell Phone; http://permanent.access.gpo.gov/ lps94538/life-cell.pdf acessed in November 2015.
3. Widmer, R.; Oswald-Krapf, H.; Sinha-Khetriwal, D.; Schnellmann, M.; Boni, H.; Environ. Impact Assess. Rev.2005,
25, 436.
4. Rocha, G. H. T.; Gomes, F. V. B.; Streicher-Porter, M.; Portugal, S. M.; Almeida, R. N.; Ribeiro, J. C. J.; Diagnóstico da Geração de Resíduos Eletroeletrônicos no Estado de Minas Gerais; Fundação Estadual do Meio Ambiente (FEAM): Belo Horizonte, 2009.
5. Oliveira, C. R.; Bernardes, A. M.; Gerbase, A. E.; Waste Manage.2012, 32, 1592.
6. Luo, C.; Liu, C.; Wang, Y.; Liu, X.; Li, F.; Zhang, G.; Li, X.;
J. Hazard.Mater.2011, 186, 481.
7. Xu, X.; Yang, H.; Chen, A.; Zhou, Y.; Wu, K.; Liu, J.; Zhang, Y.; Huo, X.; Reprod. Toxicol. 2012, 33, 94.
8. Guo, Y.; Huo, X.; Li, Y.; Wu, K.; Liu, J.; Huang, J.; Zheng, G.; Xiao, Q.; Yang, H.; Wang, Y.; Chen, A.; Xu, X.; Sci. Total Environ.2010, 408, 3113.
9. Huo, X.; Peng, L.; Xu, X.; Zheng, L.; Qiu, B.; Qi, Z.; Zang, B.; Han, D.; Piao, Z.;Environ. Health Perspect.2007, 115, 1113. 10. Moreira, F. R.; Moreira, J. C.; Rev. Panam. Salud Publica2004,
15, 119.
11. Cheyns, K.; Peeters, S.; Delcourt, D.; Smolders, E.; Environ. Pollut. 2012, 164, 242.
12. Yuan, Li; Zhi, W.; Liu, Y.; Karyala, S.; Vikesland, P. J.; Chen, X.; Zhang, H.; Environ. Sci. Technol.2015, 49, 824.
13. Grossman, E.; High Tech Trash: Digital Devices, Hidden Toxics, and Human Health; Island Press: Washington, DC, 2006. 14. Prado, H.; Solos do Brasil: Gênese, Morfologia, Classificação
e Levantamento, 2a ed.; USP: Piracicaba, 2001.
15. Singh, J.; Kalamdhad, A. S.; Bioresour. Technol.2012, 124, 169.
16. Hamelink, J. L.; Landrum, P. F.; Bergman, H. L.; Benson, W. H.; Bioavailability: Physical, Chemical and Biological Interactions;CRC Press: Boca Raton, 1994.
17. Cornell, J. A.; Experiments with Mixtures: Designs, Models, and the Analysis of Mixture Data, 3rd ed.; John Wiley & Sons: New York, 2002.
18. Egreja Filho, F. B.; Reis, E. L.; Jordão, C. P.; Pereira Neto, J. T.;
Quim. Nova 1999, 22, 324.
19. Pant, D.; Joshi, D.; Upreti, M. K.; Kotnala, R. K.; Waste Manage.
2012, 32, 979.
20. Tuncuk, A.; Stazi, V.; Akcil, A.; Yazici, E. Y.; Deveci, H.; Miner. Eng.2012, 25, 28.
21. Yamane, L. H.; Moraes, V. T.; Espinosa, D. C. R.; Tenório, J. A. S.; Waste Manage.2011, 31, 2553.
22. ABNT NBR 10004: Resíduos Sólidos, ABNT: Rio de Janeiro, 1987.