Article
J. Braz. Chem. Soc., Vol. 27, No. 5, 866-876, 2016. Printed in Brazil - ©2016 Sociedade Brasileira de Química 0103 - 5053 $6.00+0.00
*e-mail: [email protected]
Investigation of Copper Extraction from Aqueous Sulfate Solution in a Rotating
Disc Contactor
Maryam Kasaie, Hossein Bahmanyar* and Mohammad A. Moosavian
Surface Phenomena and Liquid-Liquid Extraction Research Laboratory, School of Chemical Engineering, College of Engineering, University of Tehran, PO Box 11365/4563, Tehran, Iran
The extraction of copper from aqueous sulfate solution with new extractant Cupromex-3302 (active substance is the 5-nonylsalicylaldoxime) using a rotating disc contactor (RDC) was investigated. It was observed from batch experiments that the best results were obtained with the initial aqueous pH and concentration of Cupromex-3302 of 1.9 and 10% (v/v) respectively. In continuous experiments, the first critical rotor speed based on drop breakage probabilities was determined. Then the effects of rotor speed, dispersed and continuous phase flow rates on hydrodynamic parameters such as static hold-up, mean drop sizes and extraction efficiency were studied. The experimental results were compared with the ones obtained by the empirical correlations for prediction of the dispersed phase static hold-up and mean drop sizes in terms of the operating variables and the physical properties. The results of experiments proved the feasibility of operating the solvent extraction of copper from the aqueous solution using rotating disc contactor.
Keywords: copper, rotating disc contactor, critical rotor speed, static hold-up, Sauter mean drop diameter
Introduction
In the last few years hydrometallurgical method, being a highly developed technology, is applied for about 20-25% of the world’s copper production through solvent extraction followed by electrowinning processes.1,2 Compared to pyrometalurgical method this approach has not disadvantages such as several drawbacks, including high energy consumption and the production of hazardous gases.3
Solvent extraction (SX) has been recognized as one of the most important process due to economically and environmentally beneficial to recover various metals from leaching solutions and other waste streams for many decades.4-6 Therefore, development of the recovery and separation of valuable metals such as copper by solvent extraction method has attracted a lot of attention worldwide and plays an important role in the field of hydrometallurgy by changing the constitution of world copper production.7-9 Copper is widely used because it has several essential properties for different technological applications, such as applications in electrical materials and construction, transportation and industrial machinery parts, petroleum refining and brass manufacture, etc.3,10
In view of the industrial and economic importance of this metal, there is a great need to separate and recover copper ions using cost effective commercial extractants.11 Literature review indicates that hydroxyoximes are now used widely as extractants for copper SX in hydrometallurgy marketed as LIX (Cognis), Acorga (ICI) or SME (Shell) reagents.2-5,11-15 In recent years, D2EHPA and various sulfur containing reagents such as CYANEX group have received considerable attention both for their ability to extract soft transition metal ions.8,12,16
Over the years different types of solvent extraction contactors have been developed for use in the minerals processing industry. The most conventional type is the mixer settler arrangement but more recently different types of counter current columns such as packed, pulsed and Kuhni columns have been employed for metal extraction.17-20
On comparing the performance characteristics of solvent extraction equipment, columns are found highly efficient and exhibit low costs in respect of stage numbers, solvent inventory, settler area, site area and maintenance.21 They are suitable for process control, which requires a quick response to changes in operating and environmental conditions.22
rate to diffusion rate ratio. A DaII number higher than unity (e.g., > 10) indicates that diffusion predominates and a small value (e.g., < 0.1) indicates that the reaction rate controls. In the first case the process is improved by large concentration differences, which can be obtained using counter-current columns. In the second case, the use of a mixer-settler should be favored since long residence times are difficult to achieve in columns.23
Among various columns used in liquid-liquid extraction operation, rotary disc contactor (RDC) is the most widely adopted since it was developed by the Royal Dutch/Shell Group in the middle of the last century. Comparisons with other conventional contactor devices have been made showing that RDC is more efficient and provide increased yields on account of its high efficiency per unit height, high throughput, low driving power, low cost, and high operational flexibility comparing with conventional sieve plate, packed and spray columns. The agitation provided by the discs mounted on the rotor shaft improves the performance of the RDC by breaking the disperse phase droplets, and thereby increasing the interfacial area for mass transfer. An important application of these contactors is in the petroleum industry for furfural and sulfur dioxide extraction, propane deasphalting, sulfolane extraction, and caprolactum purification.24-26
The applications of the RDC column were not observed in the literature for copper extraction and recovery. However, comprehensive investigations have been performed on determination of effective parameters on RDC, whereas the knowledge concerning the design and performance of these columns for copper extraction as a reactive system was not taken into account. The complex behaviors of the hydrodynamics, mass transfer and chemical reaction may be the reason.
In order to obtain a suitable design for RDC columns, information on hydrodynamic parameters such as average drop size and dispersed phase hold-up and characteristic velocity in terms of the operating variables, column geometry and liquid physical properties is necessary.26 Veritably mass transfer rates and separation efficiencies are closely related to the interfacial area, which in turn, depends upon the contactor hydrodynamic parameters such as dispersed phase hold-up and particle size distribution.27 In these contactors new drops are generated from breakage of bigger drops or coalescence of smaller drops.28
The purpose of present work was to investigate the feasibility of the rotating disc contactor for copper extraction from aqueous sulfate solution with hydroxime extractant Cupromex-3302 and to obtain information on drop size and hold-up. The mentioned extractant is one of the products of SNF Flomin and this study is part of its first applications in copper extraction.
The effects of operational variables such as rotor speed, dispersed and continuous phase flow rates on static hold-up, drop size and extraction efficiency were investigated.
Experimental
Reagents
A stock solution of CuII was prepared by dissolving the appropriate amount of CuSO4·5H2O salt, (Merck Company, 99.9% purity) in deionized water to maintain the initial concentration of metal at 1 g L-1. The commercial extractant Cupromex-3302 from SNF FloMin (active reagent is ca. 48 wt.%) used as organic phase by diluting it to the desired concentration in kerosene diluent. The active substance of the reagent is the 5-nonylsalicylaldoxime which also contained TXIB (2,2,4-trimethylpentanediol diisobutyrate) as modifier in a low aromatic hydrocarbon solvent. The presence of a modifier in this novel type improves the extraction properties of the basic oxime substance.
Batch experiments
The experiments were performed by contacting equal volumes (100 mL) of aqueous and organic phases for 10 min at room temperature. It is worth noting that in all of the experiments, distilled water (aqueous phase without copper ions) and organic phase were mutually saturated in order to ensure the condition of no mass transfer. After phase disengagement, the two phases were allowed to separate by means of a separation funnel followed by analysis of metal ion concentration of raffinate using atomic absorption spectrophotometer (PerkinElmer, AAnalyst 400). The metal ion concentration in the organic phase was determined from the difference between the concentration of metal before and after extraction. The extraction efficiency (E) is defined as follows:
0
0 [C] – [C]
E = × 100
[C] – [C]*
(1)
where [C]0 and [C]* express the initial and equilibrium concentrations of copper ions in the aqueous phase in kg m-3, respectively, and [C] is the solute concentration in aqueous phase (kg m-3). Because the continuous phase resistance is negligible, [C]* can be assumed zero.
Rotating disc contractor experiments
Figure 1b). The RDC column used in this study is made of glass and its rotors and stators are made of stainless steel. The continuous phase (aqueous phase) was fed at the top of the column to flow counter currently to the dispersed phase (organic phase) fed at the bottom by use of a glassy nozzle with definite internal diameter. The flow rates of two phases were measured using calibrated rotameters. The rotor speed was adjusted to the desired value in the range of 0-375 rpm by use of a digital motor drive.
Column with inner diameter and height 9.1 and 100 cm, respectively, consists of 21 stages separated by equally spaced horizontal stators in which liquid dispersion is generated by mechanical agitation of rotor discs mounted on a vertical shaft. Other dimensions were calculated by Misek equations29 and were applied to the column design. The column has five sampling valves. More details on column dimensions are given in Table 1.
In extraction experiments, the sulfate solution of 1 g L-1 copper concentration was prepared for continuous phase. Selected concentration of Cupromex-3302 in dispersed phase was specified based on batch experiments results.
The amount of copper transferred to organic phase was determined like described in previous section. All experiments were performed at room temperature. Table 2 lists the physical properties of the two phases.
Droplet size measurements
Requiring Sauter mean drop diameter, d32, photographs of droplets were taken inside the column using a high resolution Canon G9 digital camera (12.1 Mpix, zoom lens 6× IS, 7.4-44.4 mm, 1:2.8-4.8) followed by analysis with AutoCAD software. By using these photographs and rotor thickness (1 mm) as background reference distance inside the column, drops’ size was determined. In the case of non-spherical droplets, the major and minor axes, d1 and d2, were measured and the equivalent diameter, de, was calculated from the equation 2:
2 1/3
e 1 2
d = (d d ) (2)
The Sauter mean drop diameter (d32) is an average of droplet size that it is defined as the diameter of a sphere that has the same volume/surface area ratio as a droplet of interest. The Sauter mean drop diameter was then calculated from the equation 3:
n 3
i i i=0
32 n 2
i i i=0
n d d =
n d
∑
∑
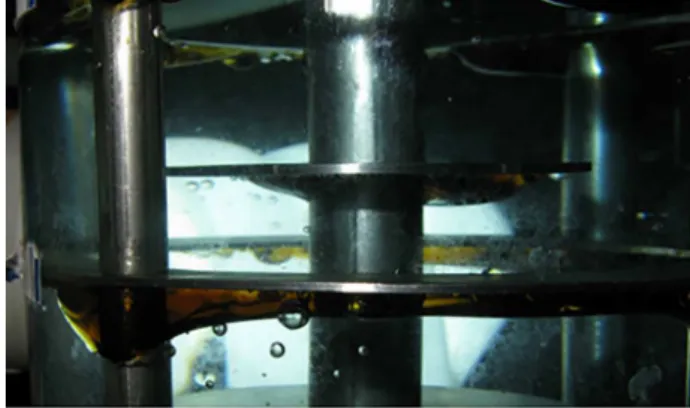
(3)where ni is the number of droplets of mean diameter di within a narrow size range i. Figure 2 demonstrates the droplets formed at the position between valves 1 and 2.
Hold-up measurements
Three types of hold-up have been discussed in the literature, namely static hold-up, dynamic hold-up (operating or moving hold-up), and total hold-up. The total
Table 1. Characteristics of the RDC column
Column height / cm Column active height / cm
Inner column diameter / cm
Inner stator diameter / cm
Outer rotor diameter / cm
Compartment height / cm
Number of compartment in
active region
150 60 9.1 6.1 4.55 3.2 21
Table 2. The physical properties of the chemical system
ρca /(kg m-3) ρdb /(kg m-3) µcc / (mPa s) µdd / (mPa s) γe / (mN m-1)
999 806 0.87 2.04 39.7
a
ρc: Continuous phase density; bρd: dispersed phase density; cµc: continuous phase viscosity; dµd: dispersed phase viscosity; eγ: interfacial tension. Figure 1. (a) A schematic feature of the RDC column; (b) the apparatus
hold-up equals the sum of the static and dynamic hold-up. Static hold-up is that part of the total hold-up which is trapped under the discs and cannot be obtained by shut-down procedure.30 Most of the researchers have studied dynamic and total hold-up.26,31,32 However, it can affect the droplet size, which is a significant parameter in liquid-liquid extraction affecting both hydrodynamics and mass transfer rate. In fact, drops may have coalescence with static hold-up which may result in drops with bigger sizes.33 Moreover, the static hold-up could have important roles on drop coalescence, residence time, interfacial area and efficiency of the column where it adds on to the dynamic hold-up.30
The detailed procedure of measuring static hold-up was as following: to reach local static hold-up in the space between the (n + 1)th and nth valve (namely position n), the whole liquid volume was drained from the nth valve. For the position 0 between the first valve and the bottom of the column, liquid volume was drained from the bottom of the column. Then, in each experiment for each position, the organic and aqueous phases were separated (using a separation funnel) and the volume of each phase was determined (using measuring cylinders). Finally, static hold-up for each position was calculated from the following expression:
Ln ϕ
Volume of dispersed phase in a specific position The whole liquid volume in that specific position
= (4)
Figure 3 presents static hold-up which located under rotor and stator discs at the position between valves 2 and 3.
Results and Discussion
Extraction of copper with Cupromex-3302 in batch experiments
The effects of operating parameters such as aqueous phase pH and extractant concentration were investigated to determine the best conditions for maximum
extraction efficiency. Mechanism of copper extraction by hydroxyoxime extractants from acidic sulfate solution is followed by this reaction:
2+ +
(org) (aq) 2 (org) (aq)
2RH + Cu ↔R Cu + 2H (5)
where RH is the extractant, R2Cu is the complex in the organic phase and the subscripts aq and org refer to aqueous and organic phases, respectively.34
Being copper extraction by hydroxime extractants dependent on the initial acidity of the aqueous solution, several studies were carried out in order to investigate the effect of the aqueous phase pH on copper extraction. Initial pH of aqueous phase was adjusted to different values ranging from 0.95-2.53, and extraction experiments were done by using 6, 8, 10 and 12% (v/v) Cupromex-3302 in kerosene as the organic phases to specify the best conditions of recovery of copper from aqueous sulfate solution. The initial concentration of copper ions in aqueous phase and temperature were maintained at 1 g L-1 and 25 °C, respectively, in all experiments. The results obtained are presented graphically in Figure 4. As expected, the percent of copper extraction increased with the rising of initial pH in all extractant concentrations. The lower extraction efficiencies (< 80%) were achieved in the lower pH region because the reaction is shifted preferentially in the back extraction reaction according to equation 5. It is also evident from Figure 4 that the extractant concentration affects copper extraction by Cupromex-3302. Greater than 97% copper recovery for 10 and 12% (v/v) Cupromex-3302 organic phases was achieved at same initial pH value of 1.9.
As shown in Figure 4, Cupromex-3302 extractant could extract copper at very low equilibrium pH values and an increase in the extractant concentration resulted in higher copper extraction efficiency at low equilibrium pH values. Therefore, the initial aqueous pH and concentration of Cupromex-3302 were selected at 1.9 and 10% (v/v)
Figure 2. Droplets formed at the position between valves 1 and 2 (bottom section of column).
respectively.
Extraction of copper with rotating disc contactor
The performance of RDC depends largely on the
geometry of the column internals and rotor speed.25
Among different parameters in an RDC, investigation on the first and second critical rotor speeds is very important. Actually the RDC should be operated between the lower and higher critical rotor speeds for a good operation.24 There are two regimes for rotating disc contactor operation in terms of characteristic velocity of the dispersed phase droplets. In the first regime, characteristic velocity remains approximately constant up to a certain rotor speed (the first critical rotor speed) and then decreases with further increase in the rotor speed (the second regime). Characteristic velocity varies rapidly with rotor speed after the first critical rotor speed up to the rotor speed that called second critical rotor speed then, the mentioned variation becomes moderate.35
After determining the first critical rotor speed, the operating parameters such as rotor speed, dispersed phase and continuous phase flow rate varied to investigate the effect of the parameters on the static hold-up, drop sizes and extraction efficiency.
Determination of the first critical rotor speed
The first and second critical rotor speeds could also be defined based on breakage probability: the first critical rotor speed for a drop with particular size defines as the rotor speed at which the drop breakage starts. In fact, before the first critical rotor speed, the probability of break up for a drop with specific size is zero. Moreover, the second critical rotor speed (for a drop with a particular size) is a rotor speed at which the probability of breaking that drop is equal to 1.35
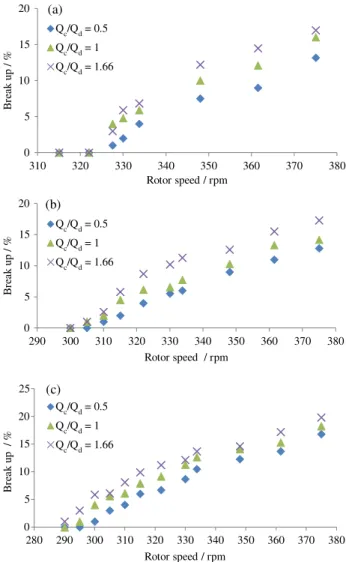
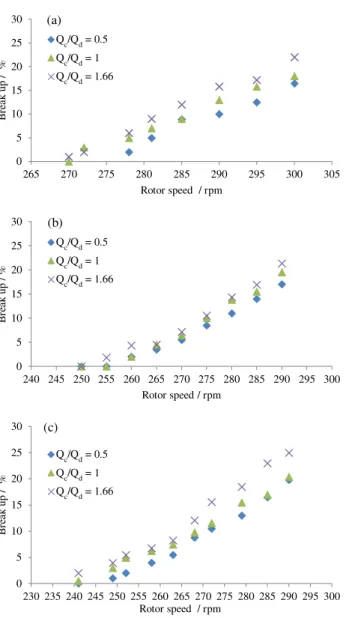
The breakage probabilities versus rotor speed for mentioned chemical systems using glassy nozzles with different inner diameters (1.2 and 2.5 mm) to form various drop sizes by adjusting the Qc/Qd ratios and continuous phase heights are presented in Figures 5 and 6. Regarding to these graphs, the drop breakage increases by increasing the volumetric phase ratio that leads to decrease of the first critical rotor speed. It could be justified with increasing this ratio, the drag forces between the continuous phase and dispersed drops increase results to enhance the probability of drop break up due to collision with the rotors. Mother drop diameter is effective on first critical rotor speed such that the nozzle with larger internal diameter produces larger mother drops with an increase in the probability of break up results to decrement of first critical rotor speed. Increasing the height of continuous phase led to increase of resistance against to upward motion of drops thereupon increment of the break up probability and decrement of the first critical rotor speed. Based on experimental results, the 0
20 40 60 80 100
0.50 1.00 1.50 2.00 2.50 3.00
E
x
tr
a
ct
io
n
effi
ci
en
cy
/ %
pH
6% (v/v) Cupromex-3302
8% (v/v) Cupromex-3302
10% (v/v) Cupromex-3302
12% (v/v) Cupromex-3302
Figure 4. Effect of initial aqueous pH and extractant concentration on the percentage extraction of copper.
0 5 10 15 20
310 320 330 340 350 360 370 380
B
re
a
k
up
/
%
Rotor speed / rpm (a)
0 5 10 15 20
290 300 310 320 330 340 350 360 370 380
B
re
a
k
up
/
%
Rotor speed / rpm (b)
Q /Q = 0.5c d
Q /Q = 0.5c d
Q /Q = 0.5c d Q /Q = 1c d
Q /Q = 1c d
Q /Q = 1c d Q /Q = 1.66c d
Q /Q = 1.66c d
Q /Q = 1.66c d
0 5 10 15 20 25
280 290 300 310 320 330 340 350 360 370 380
B
re
a
k
up /
%
Rotor speed / rpm (c)
Figure 5. The breakage probability versus rotor speed for nozzle 1.2 mm in three positions of column. Continuous phase height (a) 17 cm; (b) 36 cm; (c) 47 cm.
0 20 40 60 80 100
0.50 1.00 1.50 2.00 2.50 3.00
E
x
tr
a
ct
io
n
effi
ci
en
cy
/ %
pH
6% (v/v) Cupromex-3302
8% (v/v) Cupromex-3302
10% (v/v) Cupromex-3302
12% (v/v) Cupromex-3302
0 5 10 15 20
310 320 330 340 350 360 370 380
B
re
a
k
up
/
%
Rotor speed / rpm
(a)
0 5 10 15 20
290 300 310 320 330 340 350 360 370 380
B
re
a
k
up
/
%
Rotor speed / rpm
(b)
Q /Q = 0.5c d
Q /Q = 0.5c d
Q /Q = 0.5c d Q /Q = 1c d
Q /Q = 1c d
Q /Q = 1c d Q /Q = 1.66c d
Q /Q = 1.66c d
Q /Q = 1.66c d
0 5 10 15 20 25
280 290 300 310 320 330 340 350 360 370 380
B
re
a
k
up /
%
Rotor speed / rpm
first critical rotor speed for considered chemical system should be 230 rpm.
Equation 6 was proposed by Cauwenberg et al.36 to predict the first critical rotor speed (Ncr1) for any given liquid system and column geometry:
0.7
cr1 0.3 0.4 0.59 0.71
c c cr R
γ
N = 0.802
2πρ μ d D (6)
where dcr is the critical drop size (m), DR is the rotor diameter (m), ρc is the continuous phase density (kg m-3), µc
is the continuous phase viscosity (mPa s), γ is the interfacial
tension (mN m-1).
This correlation was modified as equation 7 by Molavi et al.35 to consider the effect of continuous phase height on first critical rotor speed based on single droplet
experiments with stagnant continuous phase flow:
0.7
–0.15 cr1 0.3 0.4 0.59 0.71
c c cr R
γ
N = 0.56 × H
2πρ μ d D (7)
where dcr is the critical drop size (m), DR is the rotor diameter (m), ρc is the continuous phase density (kg m-3), µc
is the continuous phase viscosity (mPa s), γ is the interfacial
tension (mN m-1) and H is the continuous phase height (m). This correlation is applied for prediction of the first critical rotor speed in the present work. The comparison between the experimental results and the predicted values is shown in Figure 7, which reveals that this correlation is in good agreement with the experimental data. An absolute average relative error (AARE) of 3.6% is obtained with equation 7. Furthermore, the standard deviation (σ) between
predicted and experimental values is 4.6%.
Absolute average relative error and standard deviation can be calculated by following equations:
N
i=1
1 |experimental value – calculated value|
AARE =
N' experimental value
∑
(8)2 N
i=1
|experimental value – calculated value – AARE experimental value
σ =
N' – 1
∑
(9)where N’ is the number values of data points and N is the rotor speed (rps).
Effect of operating parameters on the static hold-up
The experimental data for static hold-up in different positions (positions 1, 2, 3 and 4, from bottom to top, are related to space between valves 1-2, 2-3, 3-4 and 4-5, 0 5 10 15 20 25 30
265 270 275 280 285 290 295 300 305
B re a k up / %
Rotor speed / rpm (a)
Q /Q =c d 0.5
Q /Q =c d 0.5
Q /Q =c d 0.5 Q /Q =c d 1
Q /Q =c d 1
Q /Q =c d 1 Q /Q =c d 1.66
Q /Q =c d 1.66
Q /Q =c d 1.66 0 5 10 15 20 25 30
240 245 250 255 260 265 270 275 280 285 290 295 300
B re a k up / %
Rotor speed / rpm (b) 0 5 10 15 20 25 30
230 235 240 245 250 255 260 265 270 275 280 285 290 295 300
B re a k up / %
Rotor speed / rpm (c)
Figure 6. The breakage probability versus rotor speed for nozzle 2.5 mm in three positions of column. Continuous phase height (a) 17 cm; (b) 36 cm; (c) 42 cm.
200 225 250 275 300 325 350 375 400
200 225 250 275 300 325 350 375 400
C
al
culated
Ncr
1
Experiment Ncr1
Figure 7. Comparison of the values calculated using equation 8 with experimental results. 0 5 10 15 20 25 30
265 270 275 280 285 290 295 300 305
B re a k up / %
Rotor speed / rpm
(a)
Q /Q =c d 0.5
Q /Q =c d 0.5
Q /Q =c d 0.5 Q /Q =c d 1
Q /Q =c d 1
Q /Q =c d 1 Q /Q =c d 1.66
Q /Q =c d 1.66
Q /Q =c d 1.66 0 5 10 15 20 25 30
240 245 250 255 260 265 270 275 280 285 290 295 300
B re a k up / %
Rotor speed / rpm
(b) 0 5 10 15 20 25 30
230 235 240 245 250 255 260 265 270 275 280 285 290 295 300
B re a k up / %
Rotor speed / rpm
(c) 200 225 250 275 300 325 350 375 400
200 225 250 275 300 325 350 375 400
C
al
culated
Ncr
1
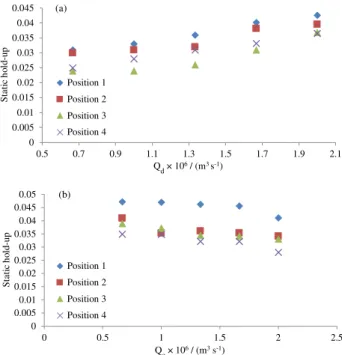
respectively) of the column under a variety of operating conditions are presented in Figures 8 and 9. As observed in Figure 8a the static hold-up in all positions decreased slightly with an increase in continuous phase volumetric flow rate. It seems continuous phase down ward flow prevented drop coalescence with static hold-up.
Regarding Figure 8b, the static hold-up increased with an increase in dispersed phase volumetric flow rate in all positions of the column. The number of dispersed phase drops and probability of drop coalescence with static hold-up will increase with increasing the volumetric flow rate but the residence time will decrease. As can be seen, the former is more effective to increase static hold-up. According to Figures 8a and 8b, the effect of dispersed phase flow rate on static hold-up is higher than continuous phase flow rate.
Figure 9 presents the change of rotor speed on static hold-up. As indicated in Figure 9, the local static hold-up decreased as rotor speed increased. This result was in contrast with the results obtained for total hold-up that showed increment as rotor speed increased.26 In fact, whirl and upward motion of drops at higher rotor speeds will lead to decrease of drop accumulation under rotor and stators. It is worth noting at high rotor speed, more static hold-up is located under the stator discs comparing to the rotor rings.
Correlation for local static hold-up
Molavi et al.30 reported the proposed correlation for
estimating local static hold-up based on physical properties, operational conditions and stage number that is defined as follows:
0 1. 4 0. 9 2. 2 3 –0. 4
d 32
–11 d c
Ln 2 2
c c c d
0.85 0.01
–0.2 –3 c c –3
d
γρ d
µ Δρ Nµ
φ = 3.58 × 10 × × × × ×
µ ρ ρ γ µ
Q Q NΔρ
n – 5.75 × 10 × × + 2 × 10
Q γ (10)
where n is the stage number, N is the rotor speed (rps), Qc is the continuous phase flow rate (m3 s-1), Qd is the dispersed phase flow rate (m3 s-1),
ρc is the continuous phase density
(kg m-3), ρd is the dispersed phase density (kg m-3), µc is the continuous phase viscosity (mPa s), µd dispersed phase viscosity (mPa s), ∆ρ is the density difference, (kg m-3), γ is
the interfacial tension (mN m-1),
ϕLn is the local static hold-up
for nth stage and d32o is the average mother drop size, (m). This correlation is used for prediction of the local static hold-up in the present work. The comparison between the experimental data and the predicted values is given in Figure 10, which shows that this correlation is in good agreement with the experimental results. Absolute average relative error (AARE) and the standard deviation (σ)
between predicted and experimental values are obtained 12.6 and 17.1%, respectively.
Effect of operating parameters on the Sauter mean drop diameter
The effects of the continuous phase volumetric flow rate on the Sauter mean drop diameter for different positions in the column and with various nozzles is illustrated in Figure 11. The increases in continuous phase flow rate led to increase the probability of drop breakage and consequently mean drop sizes will decrease and also height of continuous phase height could strongly affect the Sauter mean drop diameter. 0 0.005 0.01 0.015 0.02 0.025 0.03 0.035 0.04 0.045
0.5 0.7 0.9 1.1 1.3 1.5 1.7 1.9 2.1
S ta ti c h ol d
up-Q × 10 / (m s )d 6 3 -1
(a) 0 0.005 0.01 0.015 0.02 0.025 0.03 0.035 0.04 0.045 0.05
0 0.5 1 1.5 2 2.5
S ta ti c h ol d
up-Q × 10 / (m s )c 6 3 -1
(b) Position 1 Position 1 Position 2 Position 2 Position 3 Position 3 Position 4 Position 4
Figure 8. Effect of phase flow rates on local static hold-up (rotor speed 300 rpm). (a) Effect of continuous phase flow rate; (b) effect of dispersed phase flow rate.
0 0.01 0.02 0.03 0.04 0.05
290 310 330 350 370 390
S ta ti c h ol d-up
Rotor speed / rpm Position 1
Position 2 Position 3 Position 4
Figure 9. Effect of rotor speed on local static hold-up (Qc and Qd = 1.33 × 10⁻⁶ m3 s-1).
0 0.005 0.01 0.015 0.02 0.025 0.03 0.035 0.04 0.045
0.5 0.7 0.9 1.1 1.3 1.5 1.7 1.9 2.1
S ta ti c h ol d
up-Q × 10 / (m s )d 6 3 -1
(a) 0 0.005 0.01 0.015 0.02 0.025 0.03 0.035 0.04 0.045 0.05
0 0.5 1 1.5 2 2.5
S ta ti c h ol d
up-Q × 10 / (m s )c 6 3 -1
(b) Position 1 Position 1 Position 2 Position 2 Position 3 Position 3 Position 4 Position 4 0 0.01 0.02 0.03 0.04 0.05
290 310 330 350 370 390
S ta ti c h ol d-up
Rotor speed / rpm Position 1
Figure 12 shows the variation of mean drop sizes along the column. The effect of the dispersed phase flow rate on the performance of the column is outstanding. An increase in the dispersed phase flow rate tended to decrease the Sauter mean drop sizes in all positions with both nozzle sizes. From this graph, the effect of dispersed phase flow rate on the mean drop sizes is more significant in comparison to continuous phase flow rate.
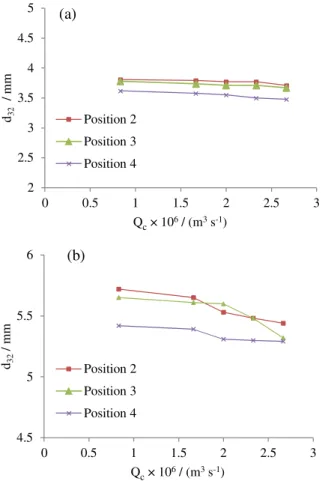
Figure 13 presents the effect of rotor speed on Sauter mean drop size. While the rotor speed increased from 270 to 375 rpm, Sauter mean diameter decreased. As can be observed, increasing the rotor speed decreased the mean drop size in all positions of the column and larger mean drop diameters were obtained using nozzles with large inside diameters.
Correlation for Sauter mean drop diameter
Al-Rahawi37 presented the correlation for estimating the Sauter mean diameter in a rotary disc contactor included nozzle inside diameter and volumetric flow rate ration of two phases by the following equation:
0.11 0.5 0.73
0.04 0.008 c d
h
32 0.15 c R c
c d Q /Q D
γ
d = 0.67 (D – D ) h
gΔρ N Q + Q
(11)
where N is the rotor speed (rps), Qc is the continuous phase flow rate (m3 s-1), Qd is the dispersed phase flow rate (m3 s-1),
0.02 0.025 0.03 0.035 0.04 0.045 0.05 0.055 0.06
0.02 0.025 0.03 0.035 0.04 0.045 0.05 0.055 0.06
C
al
culated
st
a
ti
c
h
o
ld-up
Experimental static hold-up
Figure 10. Comparison of the values calculated using equation 11 with experimental results.
2 2.5 3 3.5 4 4.5 5
0 0.5 1 1.5 2 2.5 3
d32
/
m
m
Q × 10 / (m s )c 6 3 -1 (a)
Position 2
Position 2 Position 3
Position 3 Position 4
Position 4
4.5 5 5.5 6
0 0.5 1 1.5 2 2.5 3
d32
/ mm
Q × 10 / (m s )c 6 3 -1 (b)
Figure 11. Effect of continuous phase flow rate on Sauter mean drop diameter (Qd = 1.7 × 10⁻⁶ m3 s-1 and rotor speed = 100 rpm). Nozzle diameter (a) 1.2 mm; (b) 2.5 mm.
2 2.5 3 3.5 4 4.5 5
0 0.2 0.4 0.6 0.8 1
d32
/ mm
Q × 10 / (m s )d 6 3 -1 (a)
Position 2
Position 2 Position 3
Position 3 Position 4
Position 4 4.5
5 5.5 6
0 0.2 0.4 0.6 0.8 1
d32
/ mm
Q × 10 / (m s )d 6 3 -1 (b)
Figure 12. Effect of dispersed phase flow rate on Sauter mean drop diameter (Qc = 0.5 × 10⁻⁶ m3 s-1 and rotor speed = 100 rpm). Nozzle diameter (a) 1.2 mm; (b) 2.5 mm.
0.02 0.025 0.03 0.035 0.04 0.045 0.05 0.055 0.06
0.02 0.025 0.03 0.035 0.04 0.045 0.05 0.055 0.06
C
al
culated
st
a
ti
c
h
o
ld-up
Experimental static hold-up
2 2.5 3 3.5 4 4.5 5
0 0.5 1 1.5 2 2.5 3
d32
/
m
m
Q × 10 / (m s )c 6 3 -1 (a)
Position 2
Position 2 Position 3
Position 3 Position 4
Position 4
4.5 5 5.5 6
0 0.5 1 1.5 2 2.5 3
d32
/ mm
Q × 10 / (m s )c 6 3 -1 (b)
2 2.5 3 3.5 4 4.5 5
0 0.2 0.4 0.6 0.8 1
d32
/ mm
Q × 10 / (m s )d 6 3 -1 (a)
Position 2
Position 2 Position 3
Position 3 Position 4
Position 4 4.5
5 5.5 6
0 0.2 0.4 0.6 0.8 1
d32
/ mm
∆ρ is the density difference, (kg m-3), is the interfacial
tension (mN m-1), Dh is the dispersed phase nozzle diameter (m), g is the gravitational acceleration (m s-2), hc is the stage or compartment height (m), DR is the rotor diameter (m), Dc is the column diameter (m), d32 is the Sauter mean drop diameter (m).
This correlation is applied for prediction of the mean drop sizes in the present work. An absolute average relative error (AARE) of 20.4% is obtained with equation 10. So it is required to take into account the effect of continuous phase height (H) on the drop size. Equation 11 could be modified as following equation:
0.58 0.91 0.22
0.04 0.008 –0.32 c d
h
32 1.03 0.14 c R c
c d
(Q /Q ) D
γ
d = 0.95 (D – D ) h H gΔρ N (Q + Q )
(12)
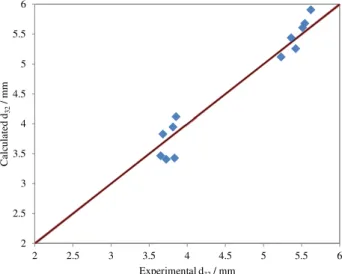
The comparison between the experimental results and the predicted values with modified equation 12 is shown in Figure 14, which reveals that this correlation is in good agreement with the experimental data. An absolute average relative error (AARE) of 4.5% is obtained with equation 12.
Effect of flow rates and rotor speed on the extraction efficiency
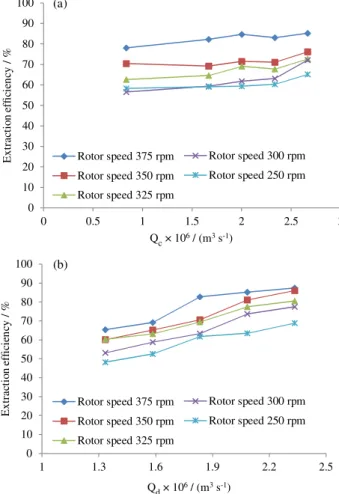
The effect of operating conditions on the extraction of CuII from aqueous sulfate solution was studied. The results are illustrated in Figure 15. The slight increase in the extraction efficiency with an increase in the continuous phase flow rate was observed from Figure 15a. This behavior was related to the enhancement of drag forces between the continuous phase and dispersed drops with an increase in the continuous phase volumetric flow rate, resulting in limitations in upward motion of drop and increment of its residence time.
It is found from Figure 15b, an increase in the organic phase flow rate results in an increase in the extraction efficiency, which was related to an increment in the total column organic phase hold-up.32
It was observed from Figure 15 that the extraction efficiency increased with increasing the rotor speed. This could be due to enhancement of interfacial area and turbulences resulting from the breakup of droplets, as the rotor speed increased.
The maximum extraction efficiency was equal to 87.44% when the values of rotor speed, Qc and Qd were 375 rpm, 1.83 × 10⁻⁶ m3 s-1 and 2.33 × 10⁻⁶ m3 s-1, respectively.
Conclusions
The present work has investigated the hydrodynamic characteristics of a rotating disc contactor (RDC) for the extraction of copper from aqueous sulfate solution. Before testing in the RDC column, bench scale studies on the solvent extraction were carried out for finding the initial 2.5
3 3.5 4 4.5 5
200 250 300 350 400
d32
/ mm
Rotor speed / rpm
(a)
Position 2
Position 2 Position 3
Position 3 Position 4
Position 4 4
4.5 5 5.5 6 6.5
200 250 300 350 400
32
Rotor speed / rpm
(b)
Figure 13. Effect of rotor speed on Sauter mean drop diameter (Qc and Qd = 1.33 × 10⁻⁶ m3 s-1). Nozzle diameter (a) 1.2 mm; (b) 2.5 mm.
2 2.5 3 3.5 4 4.5 5 5.5 6
2 2.5 3 3.5 4 4.5 5 5.5 6
C
a
lc
u
la
te
d
d32
/ mm
Experimental d32/ mm
Figure 14. Comparison of the values calculated using equation 12 with experimental results.
2.5 3 3.5 4 4.5 5
200 250 300 350 400
d32
/ mm
Rotor speed / rpm
(a)
Position 2
Position 2 Position 3
Position 3 Position 4
Position 4 4
4.5 5 5.5 6 6.5
200 250 300 350 400
32
Rotor speed / rpm
(b)
2 2.5 3 3.5 4 4.5 5 5.5 6
2 2.5 3 3.5 4 4.5 5 5.5 6
C
a
lc
u
la
te
d
d32
/ mm
0 10 20 30 40 50 60 70 80 90 100
0 0.5 1 1.5 2 2.5 3
E
x
tr
a
ct
io
n
effi
ci
en
cy
/ %
Q × 10 / (m s )c 6 3 -1
(a)
Rotor speed 375 rpm
Rotor speed 375 rpm Rotor speed 350 rpm
Rotor speed 350 rpm Rotor speed 325 rpm
Rotor speed 325 rpm
Rotor speed 300 rpm
Rotor speed 300 rpm Rotor speed 250 rpm
Rotor speed 250 rpm
0 10 20 30 40 50 60 70 80 90 100
1 1.3 1.6 1.9 2.2 2.5
E
x
tr
a
ct
io
n
effi
ci
en
cy
/ %
Q × 10 / (m s )d 6 3 -1
(b)
Figure 15. Effect of phase flow rates on the extraction efficiency (rotor speed 300 rpm). (a) Effect of continuous phase flow rate; (b) effect of dispersed phase flow rate.
pH of the aqueous solution and concentration of extractant in organic phase. These values were selected at 1.9 and 10% (v/v), respectively.
The experiments performed in the continuous system such as rotating disc contactor augmented a deeper understanding of the hydrodynamics behavior of this contactor for a reactive extraction processes.
The first critical rotor speed for considered chemical system was experimentally determined based on the drop breakage studies and was in accordance with provided model in this regard. According to experimental observations and results, operating variables such as rotor speed, dispersed and continuous phase flow rates influence static hold-up, mean drop sizes and extraction efficiencies and the first one could influence the others’ effects. The results of copper extraction with new extractant Cupromex-3302 in the rotating disc contactor, demonstrated the feasibility of the column for metal recovery, with maximum extraction efficiency near 90%. According to advantages of columns, the results are convincing and this contactor can be superseded mixer-settlers for improving and enhancing the return on investment in copper recovery plants.
References
1. Agarwal, S.; Reis, M. T. A.; Ismael, M. R. C.; Correia, M. J. N.; Carvalho, J. M. R.; Solvent Extr. Ion Exch.2012, 30, 536.
2. Panda, S.; Parhi, P. K.; Pradhan, N.; Mohapatra, U. B.; Sukla, L. B.; Park, K. H.; Hydrometallurgy 2012, 121, 116.
3. Lemos, L. R.; Santos, I. J. B.; Rodrigues, G. D.; Silva, L. H. M.; Silva, M. C. H.; J. Hazard. Mater. 2012, 237, 209.
4. Weng, F.; Qiyuan, C.; Huiping, H.; Chunlin, N.; Qinqin, Z.;
Sep. Purif. Technol. 2011, 80, 52.
5. Deep, A.; Kumar, P.; Carvalho, J. M. R.; Sep. Purif. Technol.
2010, 76, 21.
6. Ochromowicz, K.; Chmielewski, T.; Physicochem. Probl. Miner. Process. 2013, 49, 357.
7. Sridhar, V.; Verma, J. K.; Shenoy, N. S.; Miner. Eng. 2010, 23, 454.
8. Mishra, S.; Devi, N.; Hydrometallurgy 2011, 107, 29. 9. Asghari, H.; Safarzadeh, M. S.; Asghari, G.; Moradkham, D.;
Russ. J. Non-Ferr. Met. 2009, 50, 89.
10. Meterfi, S.; Meniai, A. H.; Chikhi, M.; Energy Procedia 2012,
18, 1165.
11. Reddy, B. R.; Priya, D. N.; Sep. Purif. Technol. 2005, 45, 163. 12. Fouad, E. A.; J. Hazard. Mater. 2009, 166, 720.
13. Kul, M.; Çetinkaya, Ü.; Hydrometallurgy 2009, 98, 86. 14. El Amari, Kh.; Jdid, E. A.; Blazy, P.; Physicochem. Probl. Miner.
Process. 2013, 49, 329.
15. Gameiro, M. L. F.; Bento, P.; Ismael, M. R. C.; Reis, M. T. A.; Carvalho, J. M. R.; J. Membr. Sci. 2007, 293, 151.
16. Zhang, R.; Meng, L.; Dai, Y.; J. Chem. Eng. Data 2007, 52, 438.
17. Ji, J.; Mensforth, K. H.; Perera, J. M.; Stevens, G. W.;
Hydrometallurgy 2006, 84, 139.
18. Ferreira, A. E.; Agarwal, S.; Machado, R. M.; Gameiro, M. L.; Santos, S. M. C.; Reis, M. T. A.; Ismael, M. R. C.; Correia, M. J. N.; Carvalho, J. M. R.; Hydrometallurgy2010, 104, 66.
19. Gameiro, M. L. F.; Machado, R. M.; Ismael, M. R. C.; Reis, M. T. A.; Carvalho, J. M. R.; J. Hazard. Mater.2010, 183, 165.
20. Mansur, M. B.; Slater, M. J.; Junior, E. C. B.; Ind. Eng. Chem.
Res. 2003, 42, 4068.
21. Godfrey, J. C.; Slater, M. J.; Liquid-Liquid Extraction
Equipment, 1st ed.; John Wiley & Sons: Chichester, New York,
1994.
22. Thornton, J. D.; Science and Practice of Liquid-Liquid Extraction, Vol. 1, 1st ed.; Oxford University Press: New York,
1992.
23. Veglio, F.; Slater, M. J.; Hydrometallurgy 1996, 42, 177. 24. Kamath, M. S.; Subba Rau, M. G.; Can. J. Chem. Eng. 1985,
63, 578.
0 10 20 30 40 50 60 70 80 90 100
0 0.5 1 1.5 2 2.5 3
E
x
tr
a
ct
io
n
effi
ci
en
cy
/ %
Q × 10 / (m s )c 6 3 -1
(a)
Rotor speed 375 rpm
Rotor speed 375 rpm Rotor speed 350 rpm
Rotor speed 350 rpm Rotor speed 325 rpm
Rotor speed 325 rpm
Rotor speed 300 rpm
Rotor speed 300 rpm Rotor speed 250 rpm
Rotor speed 250 rpm
0 10 20 30 40 50 60 70 80 90 100
1 1.3 1.6 1.9 2.2 2.5
E
x
tr
a
ct
io
n
effi
ci
en
cy
/ %
Q × 10 / (m s )d 6 3 -1
25. Laddha, G. S.; Degaleesan, T. E.; Transport Phenomena in
Liquid-LiquidExtraction, 1st ed.; McGraw Hill: New York,
1976.
26. Moris, M. A.; Diez, F. V.; Coca, J.; Sep. Purif. Technol. 1997,
11, 79.
27. Moreira, E.; Pimenta, L. M.; Carneiro, L. L.; Faria, R. C. L.; Mansur, M. B.; Ribeiro, C. P.; Chem. Eng. Commun. 2005, 192, 1017.
28. Bahmanyar, H.; Dean, D. R.; Dowling, I. C.; Ramlochan, K. M.; Slater, M. J.; Chem. Eng. Technol. 1991, 14, 178.
29. Misek, T.; Rotary Disc Extractor and Their Calculation; State Publishing House of Technical Literature: Prague, 1964. 30. Molavi, H.; Bahmanyar, H.; Chem. Eng. Commun. 2011, 198,
977.
31. Kalaichelvi, P.; Murugesan, T.; Bioprocess Eng. 1998, 18, 105.
32. Attarakih, M. M.; Bart, H. J.; Lagar, L. G.; Fagir, N. M.; Chem.
Eng. Process. 2006, 45, 113.
33. Molavi, H.; Hosseinpour, S.; Bahmanyar, H.; Shariaty-Niasar, M.; Can. J. Chem. Eng. 2011, 89, 1464.
34. Srinivasa Rao, K.; Devi, N. B.; Reddy, B. R.; Hydrometallurgy
2000, 57, 269.
35. Molavi, H.; Hosseinpour, S.; Bahmanyar, H.; Shariaty-Niasar, M.; Can. J. Chem. Eng. 2011, 89, 1236.
36. Cauwenberg, V.; Degreve, J.; Slater, M. J.; Can. J. Chem. Eng.
1997, 75, 1046.
37. Al-Rahawi, A. M. I.; Chem. Eng. Technol. 2007, 30, 184.
Submitted:August 24, 2015