0103 - 5053 $6.00+0.00
A
r
ti
c
le
* e-mail: [email protected]
Spontaneous Deposition of Ru on Pt (100): Morphological and Electrochemical Studies.
Preliminary Results of Ethanol Oxidation at Pt(100)/Ru
Vinicius D. Colle, M. Janete Giz and Germano Tremiliosi-Filho*
Instituto de Química de São Carlos, Universidade de São Paulo, CP 780, 13560-970 São Carlos - SP, Brazil
Neste trabalho rutênio foi depositado em níveis de sub-monocamadas sobre Pt (100) através da deposição espontânea em vários tempos de deposição. As superfícies de Pt(100)/Ru foram analisadas pela técnica de STM ex-situ para visualizar a morfologia dos depósitos de rutênio formados sobre a superfície da Pt (100). Foi observada a formação de aglomerados de rutênio com diâmetros entre 1,0 e 4,5 nm e com espessura biatômica no centro das ilhas. Observou-se que as ilhas de rutênio estão homogeneamente distribuídas sobre os terraços da platina e não ocorre deposição preferencial sobre os degraus ou defeitos superficiais. O grau de recobrimento de rutênio foi avaliado pelo decréscimo das cargas voltamétricas dos picos de adsorção-dessorção de hidrogênio dos eletrodos Pt(100)/Ru. Os eletrodos Pt(100)/Ru com grau de recobrimento de ~ 0,3 mostraram uma alta atividade para a eletrooxidação de etanol. Os resultados eletroquímicos suportam fortemente o mecanismo bifuncional para o aumento na oxidação do etanol.
In the present work ruthenium was deposited in submonolayer amounts on Pt(100) by spontaneous deposition at several deposition times. The Pt (100)/Ru surfaces were analyzed using ex-situ STM to image the deposits characteristic of ruthenium on Pt (100). It was observed the formation of ruthenium islands with diameters between 1.0 and 4.5 nm with bi-atomic thickness in the center of the islands. A homogeneous distribution of the ruthenium islands on the platinum terraces was found, with no preferential deposition on steps or surface defect sites. The ruthenium coverage degree had been calculated by the decrease of charge of the hydrogen adsorption-desorption peaks in the cyclic voltammograms of the Pt(100)/Ru electrodes. The Pt(100)/Ru electrodes with a ruthenium coverage degree of ca. 0.3 showed a high activity for the ethanol electrooxidation. The electrochemical experimental results support strongly the bifunctional mechanism for the enhanced ethanol oxidation.
Keywords: STM, cyclic voltammetry, Pt(100)/Ru, ethanol oxidation
Introduction
It is recognized that there are many ways to promote surface modifications in the level of submonolayers or monolayers of metal atoms on a substrate. A very well known way to realize an electrochemical surface modification of a metal substrate is through the called underpotential deposition phenomenon (UPD), where the metal atoms are deposited on a metal substrate that has a
higher work function (φ).1 Once formed the film on a
substrate, it can be arrayed in two-dimensional surface structure. Some aspects must be taken into account to determine a specific structure, like electrode material, electrode potential, surface crystallography, anion co-adsorption and cationic precursor. Generally the films
formed on the substrates are dissolved when a sufficiently positive electrode potential is reached.
The electrodeposition of sub-monolayers or monolayers is other way of getting metal deposits. In this case, the relationship between the work function of the substrate and that of the deposit is the opposite of that
needed for UPD.1 Normally the films formed on the
substrate do not dissolve easily and are very stable like oxides, instead, the films formed by UPD are reversible or quasi reversible. An important factor that must be considered to the formation of sub-monolayers and/or monolayers is the influence of the crystallographic orientation during the deposition process. Each specific face defines different arrays in function of the forces acting between adsorbate– adsorbate and adsorbate-surface that are needed for the
adlattice formation.2
the phenomenon of spontaneous deposition of “metals”
on a substrate.3-8 However, most of them are devoted to the
surface modification of Pt (111) substrates, while just few
ones are dedicated to studies of Pt (100) surface.3,6,8 One of
the most studied modifiers of platinum surface is ruthenium, however other ad-metals, that can also be obtained by spontaneous deposition, have been used in electrocatalytic applications as Rh,9,10 Pd,11 As,12 Bi13-15 and
Sb12 as well.
It is well known that Pt is the best catalyst for the oxidation of small organic molecules, like methanol and
ethanol.16 Its use can be promising as anode in fuel cell
application.17 However, for this it is necessary to reach
conditions where the rate, current densities, lifetime of the catalyst can be desirable. The main problem associated to organic eletrooxidation on platinum is the self-poisoning by CO molecule that is formed as a reaction intermediate and remains strongly adsorbed on the surface causing a decrease in the performance and reactivity of the catalyst. Promoters such as ruthenium have brought major
improvement in the platinum tolerance to CO poisoning.3,4
Despite a lot of research on Pt/Ru for methanol electrooxidation the nature of the surface site for the oxidation reaction is still an outstanding issue that needs to be addressed. In this context, the Scanning Tunneling Microscopy (STM) technique is a powerful tool that can reveal adequately information on the surface modification in sub-monolayer levels. In our case, the concern is in knowing the correlation between surface morphology of a catalyst and its performance towards organic oxidation.
In a recent publication Herrero et al.18 have studied the
Pt(111)/Ru system by ex situ STM and have showed the
formation of Ru monatomic islands onto platinum
surface.18 Additionally, they proposed that the surface
structure of the deposit depends on the conditions used to realize the surface modification of Pt(111), by electrodeposition or spontaneous deposition. Also, Ru have been deposited on Pt(111) by metal evaporation under
UHV conditions4,19 and the authors observed the presence
of islands with sinuous border. As it was observed in the literature only the Pt(111)/Ru surface was detailed studied. Our goal is to analyze the Pt(100) surface modified by Ru, using electrochemical and microscopy techniques to calculate the Ru coverage and to study the surface morphology of the obtained deposits. Finally, the catalytic ethanol eletrooxidation will be evaluated on the Pt(100)/ Ru system.
Experimental
The Pt(100) single crystal was obtained by the Clavilier
method described in the literature,20,21 where a bead of ca.
2 mm of diameter was grown and properly oriented by X-ray technique. The single crystal was polished down to
0.05 µm with alumina and submitted to a thermal treatment
in hydrogen flame in order to regenerate the single crystal surface and eliminate impurities. Just after that, the crystal was cooled in hydrogen/argon atmosphere, to prevent surface disordering and was used as working electrode for
the electrochemical experiments.22-24 For the STM
measurement a commercial Pt(100) single crystal (Metal
Crystals and Oxides Ltd) was used with ca. 5 mm in
diameter and 7 mm in height and accuracy in the orientation of 0.4º. This single crystal electrode was also polished with
alumina down to 0.05 µm.
The ruthenium deposition on platinum single crystal electrode was carried out by spontaneous deposition at
the open circuit potential (Eoc = 910 mV) from a ruthenium
chloride/sulfuric acid (1 x 10⁻³ mol L-1RuCl
3.xH2O + 0.1
mol L-1H
2SO4) solution. The ruthenium deposits were
grown at several deposition times between 2 and 180 seconds. In order to avoid the formation of irreversible ruthenium oxides, after each deposition, the electrode was
submitted to four voltammetric cycles in 0.1 mol L-1 H
2SO4
solution at the potential range of 0.05 to 0.5 V at 50 mV s-1.
All chemicals used for the preparation of the solutions
were of high purity: RuCl3.xH2O (Aldrich), HClO4 (Merck),
H2SO4 (Mallinkrodt), ethanol (Mallinkrodt) and potassium
iodide (Merck). All the solutions were prepared with
Milli-Q water (18.2 MΩ cm).
The electrochemical experiments were carried out in a three compartments glass cell. All the electrolytic solutions
were saturated with N2. The potentials were measured
against a reversible hydrogen electrode (RHE). A platinum wire was used as counter electrode and the experiments were carried out at room temperature.
The ethanol electrooxidation reaction on Pt(100)/Ru was preliminary studied by cyclic voltammetry and
chronoamperometry in 0.5 mol L-1 ethanol + 0.1 mol L-1
H2SO4 solution at a potential range of 0.05 to 0.8 V at 50
mV s-1. The first voltammetric cycle for the ethanol
oxidation was recorded for each deposition time. This procedure was followed due to the self-poisoning effect, which difficults the establishment of the influence of the deposits in the ethanol oxidation voltammetric profiles. The chronoamperometry technique was used to determine the current densities of ethanol oxidation as a function of time. Therefore, 1200 s was chosen as enough time to reach the almost steady state at 0.55 V. This potential was chosen due to the influence of Ru to catalyze the oxidation of small organic molecules in overpotentials lower than that
enough to favor the continuation of the reaction. The study of the surface morphology of Pt(100)/Ru system was carried out through the STM technique. The
images were obtained by the ex situ method in argon
atmosphere, using an instrument Pico SPM - Molecular Imaging Co., operating in the constant height mode.
Pt0.8Ir0.2 tips prepared by electrochemical etching in
concentrated KOH solution were used. The images were treated with the visual software SPM.
Before and after the ruthenium deposition, the electrode
was cycled in 0.1 mol L-1 HClO
4 solution in the potential
range of 0.06 to 0.85,18,25 and just after that it was immersed
in a 0.01 mol L-1 KI + 0.1 mol L-1 HClO
4 solution during 40
seconds. The perchloric acid was used because the perchlorate anion does not adsorb on platinum. The iodine adsorption on Pt(100) and Pt(100)/Ru from potassium
iodide solution, forms a protective I2 layer on the electrode.
This procedure is necessary in order to prevent the surface disordering provoked by oxygen adsorption and to protect
the surface from contamination,8,18,26 thus improving the
quality of the STM images and allowing longer time to realize the STM experiments.
Results and Discussion
Voltammetric profile of Pt (100)/Ru
The obtained Pt(100) single crystal electrodes were first characterized by cyclic voltammetry in
hanging-meniscus pattern, in 0.1 mol L-1 H
2SO4 saturated with N2 at
the potential range of 0.05 to 0.8 V at 50 mV s-1. Before
each measurement, the electrode of ca. 2.2 mm in diameter,
was always flame-annealed in hydrogen flame for 5 min and cooled in hydrogen/argon (1:1) atmosphere. To avoid atmospheric contamination a drop of water was used to protect the electrode surface during the transfer to the electrochemical cell. Once the voltammetric profiles of
Pt(100) were in accordance with literature,27-30 it was
possible to start the spontaneous Ru deposition.
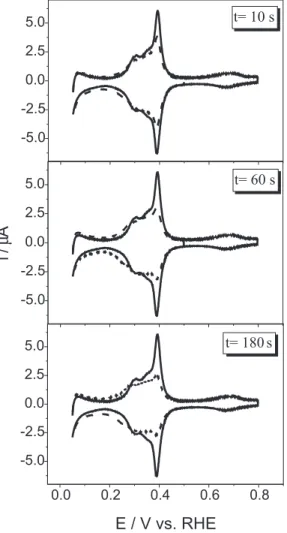
Figure 1 shows the cyclic voltammograms for Pt(100)/
Ru electrodes obtained in 0.1 mol L-1 H
2SO4 at the potential
range of 0.05 to 0.5 V at 50 mV s-1 for Ru spontaneous
deposition time of 10, 60 and 180 s. This potential range was chosen in order to avoid the formation of irreversible
ruthenium oxides. In all cases just the 4th cycle was recorded.
For comparison, the voltammogram for clean Pt (100) is presented in the potential range of 0.05 and 0.8 V. It can be observed that for all deposition times there is a gradual decrease in the peak centered around of 0.4 V, which corresponds to both the hydrogen and the anion adsorption/desorption peaks for the Pt (100). Also, an
increase of the current density at the range of 0.05 to 0.3 V it is clearly seen, when compared to that of clean Pt (100). This behavior has been attributed to two effects: the weak hydrogen adsorption on the deposited ruthenium (surface modifier), as previously proposed in the literature for
metallic ruthenium,31 and an increase of the specific surface
area due to the presence of Ru particles on the Pt (100) surface.
By comparimg the hydrogen adsorption charge for the Pt (100)/Ru electrode with that for clean Pt (100) the hydrogen coverage for each deposition time can be determined according to the following equation:
(1)
where QHPt/Ru and Q
H
Pt are the hydrogen/anion desorption
charges (in the potential range of 0.15 and 0.50 V) after
and before ruthenium deposition, respectively. The decrease of the hydrogen/anion adsorption peaks as a function of the increase of the deposition time suggests that hydrogen atoms are not strongly adsorbed on the ruthenium deposits. So, it is possible to estimate the ruthenium coverage by using the values of hydrogen/anion coverage through the equation:
H Ru =1-q
q (2)
This equation was used under the assumption that charges for the hydrogen and the anion adsorption/ desorption contribute in the same extension to the variation of the ruthenium coverage.
The values of ruthenium coverage degree on Pt(100) calculated from the equations above for deposits grown up to 180 s are shown in Figure 2. The tendency of saturation in the ruthenium coverage is clearly observed. A maximum value for the coverage degree of 0.35 monolayer is obtained for the deposition time of 180 s.
This behavior is in accordance with the literature3 and
supports the assumption stated above regarding the same contribution of the hydrogen and of the anion adsorption to the changes in the experimental charges associated with
the ruthenium coverage. Tremiliosi-Filho and co-workers,7
studying the spontaneous deposition of ruthenium on Pt(111) have concluded that the coverage degree does not reach higher values because of a significant presence of ruthenium oxides in the deposit composition, which difficult the deposition process with the consequent limitation of the growth of the deposit.
Additionally, they have analyzed the chemical composition of the spontaneously deposited ruthenium
on Pt(111) by XPS7 and they proposed that a large amount
of surface oxygen is present as ruthenium oxides or hydroxides. However, these spontaneously formed ruthenium oxo-species decompose mainly to metallic ruthenium under voltammetric conditions. There is no information in the literature concerning the chemical composition of the system Pt(100)/Ru but it is believed that it follows the same as observed for Pt(111)/Ru.
STM studies of Pt(100)/Ru
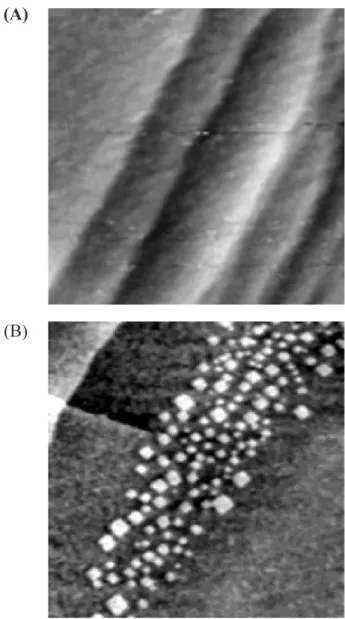
Figure 3 shows the STM image obtained for a clean Pt(100) electrode following the procedure described at the experimental section. The presence of terraces delimited by random monoatomic steps is observed (Figure3A). In other small regions of this same surface (Figure 3B) the
Figure 2. Coverage degree of Ru species deposited on Pt(100) by spontaneous deposition and calculated from voltammetric hydro-gen adsorption peaks .
formation of high monoatomic, square-shaped islands is also observed. The presence of such islands on the surface is a clear indication that the surface was partially disordered. Kolb and co-workers reported similar observation when
using high H2 concentration in the cooling atmosphere.24
The STM images in the presence of ruthenium deposits were obtained in the region where the square-shaped islands were not present.
The STM images obtained for the Pt(100)/Ru surface prepared by different deposition times are presented in Figures 4 and 5.
Figure 4A presents the STM image of Pt(100) after ruthenium deposition during 3 s. It is only seen the platinum terraces delimited by monoatomic steps and no formation of the ruthenium deposits on the Pt (100) surface is observed in the used resolution of 100x100 nm. Under this deposition time the degree of coverage is lower than 0.1 monolayer. A reasonable explanation for the not observing surface ruthenium deposits on Pt(100) after 3 s of spontaneous deposition is associated with the STM sensitivity that is not enough to detect traces of small spots (nucleus) of ruthenium on the platinum crystal. However, after 20 s of ruthenium deposition (Figure 4B) the definition of small spots on Pt(100) is clear. The observable bright spots are ruthenium islands homogeneously spread on the platinum surface, with no preferential deposition on the steps or edges. The average values of the islands diameter
and area are ca. 2.04 nm and 3.26 nm2, respectively.
In the case of deposition time of 60 s, the images were acquired under two conditions: before (Figure 5A) and after (Figure 5B) conditioning the electrode by four
voltammetric cycles in HClO4 solution just after the
deposition process, in order to check the effect of the voltammetric treatment on the surface morphology.
Similar observation can be done for platinum surface modified by ruthenium deposition during 60 s (see Figure 5A). In this case, the statistical analysis of the islands dimensions reveals an average value of 2.53 ± 0.85 nm and 0.51 ± 0.13 nm for diameter and height, respectively. The height of the islands corresponds to the formation of a ruthenium bilayer, although a full monoatomic layer has not been detected. These values are in good agreement with the literature.5,8
When the Pt(100)/Ru surface is submitted to the voltammetric treatment between 0.06 and 0.8 V (four
cycles) in 0.1 mol L-1 HClO
4 solution, no significant change
is observed on the distribution and size of Ru islands, as can be seen in Figure 5B. The average value for the islands
diameter is 2.27 ± 0.52 nm and their height is ca. 0.40 ±
0.07 nm. According to Wieckowski and co-workers,8 the
voltammetric treatment in HClO4 solution in the potential
range of 0.06 to 0.8 V reduces the RuO2+ species and forms
strongly adsorbed elemental ruthenium and others ruthenium oxides species. This supports the observable reduction of the island height after the voltammetric cycling.
A more careful statistical analysis of the islands dimensions is shown in the histogram of Figures 6 and 7, for Pt(100) modified by ruthenium deposition during 60 s before and after voltammetric treatment.
The histograms shown in Figure 6A and 6B present the area and diameter size distributions of the islands before voltammetric treatment. Most of the islands have an area
of ca. 2.5 nm2, varying in the range of 0.3 and 10 nm2. For
the diameter, the largest amount of particles is concentrated around 2.0 nm varying from 1.0 to 4.5 nm. After the
voltammetric treatment the majority of the islands have
an area of 2.8 nm2 that is a little larger than that in the
previous case, indicating that a partial particle agglomeration is facilitated by the electrochemical treatment. The diameter remains approximately equal (2.0 nm) varying between 1.0 and 3.5 nm. Additionally, it can be seen from the histograms that after the electrochemical treatment the total amount of islands decreases after the voltammetric cycling indicating a partial dissolution of the surface deposited ruthenium.
Ethanol electrooxidation on Pt(100)/Ru
Ethanol electrooxidation was studied in 0.1 mol L-1
ethanol + 0.1 mol L-1 H
2SO4 solution, in order to correlate
the catalytic activity of the Pt(100)/Ru system with the ruthenium coverage degrees.
Figure 8 shows the voltammetric profile for a clean Pt (100) surface. The anodic peak for ethanol oxidation on Pt (100) occurs around 0.780 V. The voltammogram presents hysteresis between the anodic and the cathodic sweeps, in which a higher ethanol oxidation charge is observed in the cathodic sweep together a shift of the peak to lower potentials. This feature is due to the fact that the ethanol adsorption in the anodic sweep competes with the strong adsorption of water, CO or other carbonaceous species, formed as intermediates, during the course of the reaction.
All of these species are oxidized to CO2 in potentials as
high as 780 mV, liberating the active reaction sites and increasing the efficiency of the ethanol oxidation in the
cathodic sweep.32
The studies of the catalytic activity of the platinum surface modified by ruthenium deposition were carried out using only the anodic sweep of the voltammograms. The corresponding anodic voltammetric sweeps for three
Figure 5. Ex situSTM images obtained for Pt(100)/Ru: (A) after 60 s of ruthenium deposition without voltammetric treatment (100 x 100 nm) and (B) after 60 s of ruthenium deposition and after voltammetric treatment in HClO4 (100 x 100 nm).
that for the non-modified electrode. This indicates a higher activity of the modified surface and a larger tolerance to the poisoning by adsorbed species formed in potentials lower than 780 mV. At low overpotentials (between 50 and 600 mV), which is showed in details in Figure 9 as an inset, it is also observed that the highest densities of ethanol oxidation occur after different Ru deposition times.
The chronoamperometric curves obtained for Pt (100) and Pt (100)/Ru electrodes, presented in Figure 10, confirm the best performance of the modified electrode for the ethanol oxidation. A plot of the final chronoamperometric current (measured after 20 min of polarization at 0.550 V) as a function of the ruthenium deposition time is shown in Figure 11.
The shape of the resulting curve infers that the deposition time of 90 s of spontaneous deposition of ruthenium exhibits the best catalytic activity. At higher deposition times, the current decreases. This information
Figure 7. Statistical histograms:(A)Number of particles vs distribu-tion of areas of ruthenium particles deposited during 60 s (with voltammetric treatment). (B) Number of particles vs distribution of diameters of ruthenium particles deposited during 60 s (with voltammetric treatment).
Figure 9. Anodic voltammetric sweeps for ethanol oxidation on clean Pt(100) (—) and Pt(100)/Ru (––) electrodes in 0.1 mol L-1 ethanol + 0.1 mol L-1 H
2SO4 solution. v = 20 mV s
–1, for different Ru deposition times.
Figure 8. Cyclic voltammogram for the ethanol oxidation on clean Pt(100) in 0.1 mol L-1 ethanol + 0.1 mol L-1 H
2SO4 solution. v = 20 mV s–1.
is in agreement with the bifunctional mechanism for the ethanol oxidation on modified electrodes, proposed in the
literature.33,34 The maximum reactivity achieved for a
deposition time of 90 s can be associated with the chemical state of ruthenium. The distribution of ruthenium valencies in deposits obtained by spontaneous deposition contains
Ru4+ (as RuO
2), Ru
6+ (as RuO
3) and Ru
0 (metallic phase),
and the catalytic enhancement is associated with the
presence of metallic ruthenium.7 Coincidentally, the Pt/
Ru surface obtained by spontaneous deposition for 90 s promotes the appearance of more metallic species than the other studied deposition times (this assumption should be verified by XPS measurements). An important prerequisite for higher ethanol oxidation activity is to achieve a catalyst surface of highly metallic character. In this way, the bifunctional mechanism operates for the enhancement of ethanol electrooxidation. When metallic ruthenium is present in the surface, the ethanolic C-C bond breaks on the Pt surface site forming adsorbed CO. Water is activated on the surface of metallic ruthenium, and acts as the source
of oxygen needed for the catalytic transformation of
surface CO to CO2 at the edge of ruthenium islands.7,18
Conclusions
STM images of Pt (100)/Ru showed the formation of ruthenium islands, uniformly distributed on the electrode surface. These islands have diameters between 1 and 4.5 nm and have a bi-atomic thickness in the center of the islands.
The ruthenium coverage degrees on Pt (100)/Ru did not show significant change in their values with the increase of the deposition time, exhibiting an average value of 0.3.
Experimental results have shown that Pt(100)/Ru electrodes present higher current densities at low potentials for ethanol oxidation than non-modified Pt (100). This fact supports that the Pt (100) modified by ruthenium produces intermediated reaction and probably final products at lowest overpotential, where the Pt (100) is not enough to cause it through the by bifunctional mechanism.
Acknowledgements
V. Del Colle acknowledges FAPESP for a scholarship granted (99/12099-2). The authors also thank FAPESP, CNPq and CAPES (Brazil) for financial support.
References
1. Kolb, D. M.; Przasnycki, M.; Gerisher, H. J.; J. Electroanal.
Chem. 1974, 54, 25.
2. Sung, Y. –E.; Chrzanowski, W.; Zolfaghari, A.; Jerkiewicz, G.; Wieckowski, A.; J. Am. Chem. Soc. 1997, 119, 194.
Figure 11. Current densities of ethanol oxidation after 1,200 sec-onds at 0.55 V, as a function of the Ru deposition time.
Figure 10. Chronoamperometric curves for ethanol oxidation at 0.55 V on clean Pt(100) (—) and Pt(100)/Ru (––) electrodes in 0.1 mol L-1 ethanol + 0.1 mol L-1 H
3. Tremiliosi-Filho, G.; Kim, W.; Chrzanowski, W.; Wieckowski, A., B. Grzybowska, P. Kulesza; J. Electroanal. Chem. 1999,
467, 143.
4. Iwasita, T.; Hoster; H.; John-Anacker; A.; Lin, W. F.; Vielstich,
W.; Langmuir2000, 16, 522.
5. Crown, A.; Moraes, I. R.; Wieckowski, A.; J. Electroanal.
Chem.2001, 500, 333.
6. Chrzanowski, W.; Wieckowski, A.; Langmuir 1997, 13, 5974 7. Kim, H.; Moraes, I.; R.; Tremiliosi-Filho, G.; Haasch, R.;
Wieckowski, A.; Surf. Sci.2001, 474, L203.
8. Crown, A.; Johnston, C.; Wieckowski, A.; Surf. Sci.2002,
506, L268.
9. Bakos, I.; Szabo, S.; J. Electroanal. Chem.2003, 547,103. 10. Gomez, R.; Feliu, J. M.; Electrochim. Acta1998, 44, 1191. 11. Carbo, R.; Albalat, R.; Claret, J.; Electrochim. Acta1998, 44,
1097.
12. Feliu, J. M.; Fernandez-Vega, A.; Aldaz, A.; Clavilier, J.; J.
Electroanal. Chem.1998, 256, 149.
13. Clavilier, J. Feliu, J. M.; Aldaz, A.; J. Electroanal. Chem.1998,
243, 419.
14. Evans, R. W.; Attard, G. A.; J. Electroanal. Chem.1993, 345, 337.
15. Feliu, J. M.; Fernandez-Vega, A.; Aldaz, A.; Clavilier, J.; J.
Electroanal. Chem.1998, 269, 175.
16. Vielstich, W.; Fuel Cells: Modern Processes for the
Electro-chemical Production of Energy, Wiley: New York, 1970.
17. Wang, J.; Wasmus, S.; Savinell, R. F.; J. Electroanal. Chem.
1995, 142, 4218.
18. Herrero, E.; Feliu, J. M.; Wieckowski, A.; Langmuir1999, 15, 4944.
19. Jarvi, T. D.; Madden, T. H.; Stuve, E. M.; Electrochem.
Solid-State Lett.1999, 2, 224.
20. Clavilier, J.; Armand, D.; Sun, S. G.; Petit, M.; J. Electroanal.
Chem.1986, 205, 267.
21. Dall’Antonia, L. H.; Perez, J.; Tremiliosi-Filho, G.; Gonzalez, E. R.; Quim. Nova1999, 22, 760.
22. Feliu, J. M.; Rodes, A.; Orts, J. M.; Clavilier, J.; Pol. J. Chem.
1999, 68, 1575.
23. Kolb, D. M.; Prog, Surf. Sci.1996, 51, 109.
24. Kibler, L. A.; Cuesta, A.; Kleinert, M.; Kolb, D. M.; J.
Electroanal. Chem.2000, 484, 73.
25. Frelink, T.; Visscher, W.; Van Veen, J.A.R.; Langmuir1996,
12, 3702.
26. Orts, J. M.; Gómez, R.; Feliu, J. M.; Aldaz, A.; Clavilier, J.;
Langmuir1997, 13, 3016.
27. Clavilier, J.; Armand, D.; Wu, B. L.; J. Electroanal. Chem.
1982, 135, 159
28. Clavilier, J.; Armand, D.; J. Electroanal. Chem.1986, 199, 187.
29. Clavilier, J.; Armand, D.; Sun, S. G.; Petit, M.; J. Electroanal.
Chem.1986, 205, 267.
30. Rodes, A.; Clavilier, J.; J. Electroanal. Chem.1992, 338, 317. 31. Woods, R. In Electroanalytical Chemistry; Bard, A. J.; ed.;
Marcel Dekker: New York, 1976, vol. 9.
32. Xia, X. H.; Liess, H. D.; Iwasita, T.; J. Electroanal.Chem.
1997, 437, 233.
33. Watanabe, M.; Motoo, S.; J. Electroanal. Chem.1975, 60, 275.
34. Watanabe, M.; Motoo, S.; J. Electroanal. Chem.1975, 60, 267.
Received: February 3, 2003 Published on the web: August 15, 2003