Quim. Nova, Vol. 34, No. 7, 1163-1166, 2011
Artigo
*e-mail: [email protected]
EVALUATION OF THE CORROSION BEHAVIOR OF THE Al-356 ALLOY IN NaCl SOLUTIONS
Mauricio Vásquez Rendón* y Jorge Andrés Calderón
Grupo de Corrosión y Protección, Universidad de Antioquia, SIU, Calle 62 Nº 52-59, Torre 2, Lab. 330, Medellín – Colombia Patricia Fernández
Grupo de Investigación sobre Nuevos Materiales, Universidad Pontiicia Bolivariana, Circular 1 No. 70-01, Medellín – Colombia
Recebido em 26/8/10; aceito em 28/2/11; publicado na web em 5/5/11
Cellular metals are a new class of materials with promising applications and a unique combination of physical, chemical and mechanical properties. The Al-356 alloy is used to manufacture metal foams from NaCl preforms. Despite the usefulness of these materials, their performance may be affected by corrosion due to residual salt. This paper reports the study of the behavior of the Al-356 alloy in chloride solutions by electrochemical techniques in rotating disk electrode. The cathodic reaction of oxygen reduction is the crucial stage of process dissolution of the material, which shows that is the oxygen transport which limits the corrosion process. Keywords: metal foams; rotating disk electrodes; oxygen transport.
INTRODUCTION
Aluminium and its alloys are generally resistant to corrosion in aqueous media due to the formation of a passive layer that protects them,1-7 except in solutions containing chloride ions which can break
in the passive layer causing pitting corrosion damage.6,8 Due to low
speciic weight and mechanic properties aluminium alloys are com-monly used to produce metallic foams.
Metallic foams are part of a new family of materials called cellular metals. These materials are characterized by a unique combination of physical, chemical and mechanical properties such as hardness coupled with a low speciic weight, or high permeability to gases with high mechanical strength.9-13 These can be obtained by different
processing methods, like the Soluble Preform Iniltration, which is a promissory process.11-15 This technique is economical and relatively
simple, especially because it uses common salt (NaCl) as material for the manufacture of preforms. This reduces production costs, since salt is a material relatively inexpensive and easy to achieve. The disadvantage of its use in this process is associated with any signs of corrosion that may occur because of the reactivity of aluminium with NaCl at different stages of the process, especially in the wash-ing stage to remove the preform, where the metal may interact with NaCl solutions at different concentrations.
To understand the corrosion process of aluminium in NaCl it is possible to use electrochemical techniques such as polarization curves and electrochemical impedance spectroscopy EIS, which allow studying the rate, mechanisms of corrosion of a metal16-21 and the
dif-fusional phenomenon that occurs due to the electrochemical nature of corrosion. The latter is inluenced by the potential, the concentration of species within the solution and the luid low.21
Sometimes it is necessary to use hydrodynamic test where it is possible to change the rate of mass transport from bulk solution to the metal/electrolyte interface and vice versa, and the effect on metal corrosion process can be evaluated. For this a rotating disk electrode RDE can be used. The RDE is a device that helps to maintain a low pattern very well deined. If the reaction is limited by mass transport
to or from the metal surface, and the surface is freely accessible, the current distribution on the disk is uniform and the average current density of the electrode can be described by the equation of Levich,21
Ilim = 0.62nFCbD
0.67ν–0.167ω0.5
In this paper an analysis of the corrosion behavior of 356 alumi-nium alloy using a RDE was made in chloride solutions. This alloy is commonly used in the manufacture of aluminium metal foams by Soluble Preform Iniltration, (IPS from its Spanish acronym) from a NaCl preform. For this purpose, polarization curves and electro-chemical impedance spectroscopy were performed using a rotating disk electrode at different rotation speeds, in solutions of NaCl with different concentrations. The aim of this study is to understand the interactions between aluminium and NaCl solutions trying to repro-duce some stages of the process of metal foams fabrication. EXPERIMENTAL
Sample preparation
The electrochemical tests were carried out with a solid bar of Al-356 alloy. The chemical composition of the alloy is: 7.6% Si, 0.6% Fe, 0.3% Mn, 0.3% Mg. The aluminium bar was ixed to a brass bar which was connected to an Autolab rotating electrode as working electrode. This connection was provided to ensure an optimal electrical connection between the working electrode and the rotating equipment. This assembly was then embedded in epoxy resin (Resin SP 1840 A, distributed by Suproquin Ltd.) in order to isolate the lateral surface, allowing an exposure circular surface area of 0.66 cm2 for the working electrode. Special care was taken during
Rendón et al.
1164 Quim. Nova
Solutions
All solutions were prepared with distilled water and commercial NaCl. This NaCl is the same as that used in the manufacture of pre-forms for the production of aluminium foams. Two solutions were prepared, 3 wt% NaCl and 0.3 wt% NaCl (0.5 M and 0.05 M respec-tively). All the pH measures were made by mean of HANNA type pH-metre, and the O2 concentration was measured with an oximeter.
Electrochemical measurements
Electrochemical measurements were carried out in a conventional three-electrode electrochemical glass cell, with a saturated Calomel elec-trode as reference elecelec-trode and a platinum mesh as counter elecelec-trode. Autolab and Gamry Instruments potentiostats were employed as the me-asuring equipments for polarization and impedances curves, respectively. Polarization curves
The software used to record the polarization curves was the GPES (General Purpose Electrochemical System). Polarization curves were performed in NaCl solutions at different rotation speeds: 100, 400, 900, 1600 and 2500 rpm.
Al-356 alloy sample was immersed in solution and allowed to attain a stable open circuit potential (OCP) before starting polarization scan. The time to reach a stable value for OCP was 6 min approxi-mately. The sweep was made from a cathodic overpotential of -0.3 to 0.6 V of anodic overpotential, both with respect to OCP. The scan rate was 0.166 mV/s. These curves were performed by triplicate to verify reproducibility in the corrosion behavior of Al-356 alloy in NaCl solution at different electrolyte concentrations.
EIS curves
The impedance diagrams were obtained at OCP in a frequency range of 100 kHz to 3 mHz. Amplitudes were used in 5 mV and 10 mV. Different times were employed to reach OCP stabilization. An Electrochemical Software Version 5.30 by Gamry Instruments was used to draw the impedance diagrams.
RESULTS AND DISCUSSION
Polarization curves
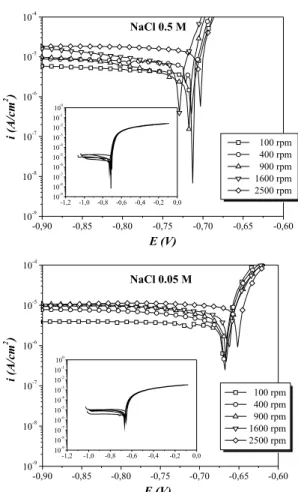
Figure 1 shows the polarization curves of Al-356 alloy at diffe-rent NaCl electrolyte concentrations. The behavior observed in these curves is similar to that reported by Guillaumin et al..2 It can be seen
that the values of anodic current ia, are much higher than the catho-dic current ic, at high overpotentials values. This indicates that the reduction reaction occurs at slower rate than oxidation reaction, and therefore, cathodic reaction controls the electrochemical corrosion of aluminium alloy.
It can be seen in both graphs that the anodic portion of the polarization curves does not change with the increase of the elec-trode rotation speed, while the cathodic portion for both electrolyte concentrations has a remarkable variation, which is relected in the increase of cathodic limiting current density, iLCat.
The metal dissolution and the interactions at the metal-electrolyte interface depend on the environmental conditions under which the tests were performed (pH, concentration of NaCl). The pH was measured after each one of the polarization curves for the three repetitions, showing values very close to 7.0. It is known, accord-ing to thermodynamics, that in aqueous media with neutral pH and natural aeration, the predominant cathodic reaction is the reduction of dissolved oxygen (DO),
O2 + 2H2O + e–→ 4OH– ; Eo = +0.82 V
Figure 1 shows that the corrosion potential for both electrolyte concentrations did not change signiicantly with the increase of the rotation speed of the working electrode. These values were approxi-mately -0.7 V and -0.65 V for 0.5 M NaCl and 0.05 M NaCl, respec-tively. It is well known that at certain conditions aluminium forms a passive layer that protects it from corrosion. The reason because the curves do not show passivation region in anodic curves is because the corrosion potential Ecorr coincides with the pitting potential Epit,
as was experimentally corroborated, Figure 2.
Figure 2 shows the comparison of the results for the polarization curves of Al-356 alloy obtained in 0.5 M NaCl solution at alkaline pH (11.5) and neutral pH (6.5), with an electrode rotation speed of 400 rpm.
Figure 1. Polarization curves of Al-356 alloy in 0.5 M NaCl and 0.05 M NaCl,
at different electrode rotation speeds
Figure 2. Polarization curves of Al-356 in 0.5 M NaCl solution at different
Evaluation of the corrosion behavior of the Al-356 alloy in NaCl solutions 1165
Vol. 34, No. 7
density response of the electrochemical system. It means that only the cathodic reaction exhibits mass transport control, related to the oxygen reduction. Additionally, the cathodic reaction controls the overall corrosion process. In order to evaluate the effect of mass transport in the corrosion of the metal, cathodic polarization curves were plotted from the OCP to a cathodic overpotential of -0.4 V. The cathodic limit current density iLCat in the polarization curves occurs when there is a deiciency of the cathodic electroactive species, in this case DO at the metal/electrolyte interface, which causes the current density reaches a stable value independent of the applied potential, and proportional to the concentration of these species, as shown in Figure 1. The linear relationship between iL and rotation speed of the electrode is deined by the Levich equation. Figure 4, shows the relationship iLCat vs ω
1/2 for the two electrolyte concentrations of NaCl
tested. All iLCat values were taken directly from the cathodic portion of the curves. The iLCat was selected at a potential value of -0.9 V. From this relationship were obtained linear correlation coeficients of 0.96 and 0.99 for 0.5 M NaCl and 0.05 M NaCl, respectively. Although Levich curves do not intercept the origin. This might be because some of the Levich conditions are not fully satisied, including: stationary conditions and metal surface is not freely accessible and invariant. The irst one is because our measures were potentiodynamic, and the second because there is a surface covered with rust and is subject to a process of passivation and repassivation during the process of dissolution.22 These results conirm the dependence of the metal
dissolution on transport of dissolved oxygen to the interface metal.
Effect of NaCl concentration on corrosion
When chlorides are present in the medium, the decrease in the concentration of NaCl is manifested by a shift of corrosion potential The pH of the alkaline solution was adjusted by adding a few drops of
5 M NaOH. During the polarization at alkaline pH was possible to see the metal passivation at a potential range between -1.2 V to -0.65 V (Epit).
In the curve obtained at a pH = 11.5 at an anodic potential of -0.65 V can be seen a sharp rise of the anodic current indicating the break-down of the passive ilm and a subsequent pitting of material. It may be noted that the pitting potential value is very close to the values of Ecorr for
tests carried out at neutral pH. This means that the pitting corrosion is the main phenomenon seen under conditions of neutral pH, making it impossible the formation of stable passive layers on the metal. These results are similar to those obtained by Zaid B. et al.6 for an AA6061
aluminium alloy tested at different pH values and NaCl concentration. EIS curves
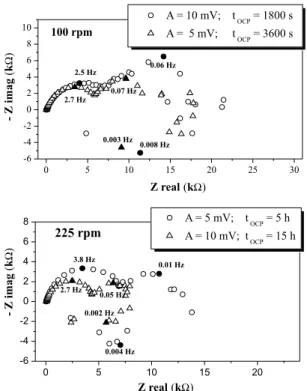
Figure 3 shows the electrochemical impedance results of Al-356 in 0.5 M NaCl solution carried out at the open circuit potential. It can be seen that impedance diagrams are constituted for at less three time constants, two capacitive loops at high and intermediate frequencies and an inductive loop at low frequencies. However, high dispersion at low frequencies in the impedance diagrams is evident at different conditions of immersion time and amplitude perturbation, making it dificult to observe the inductive loop in any conditions; indicating that for aluminium under this conditions is not possible to reach a steady state in impedance diagrams. Stabilization is not achieved because, as was mention above, the OCP potential is equal to pitting potential and metal surface is changing continually. For this reason the system is permanently at a transient state. So, to obtain deine impedance diagrams the time of OCP stabilization must be really high. Some authors suggest up to 96 h of stabilization time.18-20
Effect of hydrodynamic in the corrosion process
As was mentioned before, only the cathodic portion of the polarization curves shows the hydrodynamic’s effect on the current
Figure 3. Impedance diagrams of Al-356 in 0.5 M NaCl solution at OCP and
different stabilization time, amplitude and electrode rotation speed
Figure 4. Levich curves for Al-356 alloy at different NaCl electrolyte
Rendón et al.
1166 Quim. Nova
towards more positive values and also, a slight increase in the cathodic limiting currents and corrosion currents were observed. This could be explained because in chloride media, increasing of the chloride concentration leads to a decrease in dissolved oxygen concentration.23 That situation results in a corresponding decrease
in cathodic limiting current and thus a decrease in the corrosion current or the corrosion rate of metal (iLCat= corrosion rate, by Levich) when high levels of chloride are present. On the other hand, when the chloride concentration decreases in the medium the solubility of oxygen is enhanced and its concentration increases with the consequent increase of both, the cathodic limiting current and the corrosion current. This can be explained by mixed potential theory.24
CONCLUSIONS
The behavior exhibited by the polarization curves for Al-356 alloy in chloride media was similar to those reported in literature for others aluminium alloys, where the main form of corrosion for aluminium in chloride solution with neutral pH is pitting corrosion. The corrosion of the Al-356 alloy in chloride solution at neutral pH values did not show the typical zone of passivity that characterizes the corrosion resistance that aluminium presents in alkaline NaCl so-lution. The open circuit potential of Al-356 alloy in chloride solutions at neutral pH values coincide with the pitting corrosion potential and the dissolution of the metal is enhanced by localized corrosion form. That can be corroborated by the lack of stability in the impedance diagrams at low frequencies.
A lesser amount of NaCl in the solution causes an increase in the dissolved oxygen concentration, which causes the corrosion rate increases. This is because oxygen transport to metal-electrolyte in-terface is the process that controls the corrosion rate of Al-356 alloy in aqueous neutral NaCl solution and natural aeration.
ACKNOWLEDGEMENTS
The authors thank to COLCIENCIAS for the support to carry out this work through the framework of the project “Simulation and development of an economically viable process for producing alu-minium foams” Contract No. 1210-452-21201. Authors also thank to the “Programa de Sostenibilidad” of the University of Antioquia for the partial inancial support.
REFERENCES
1. Vargel, C.; Corrosion of aluminium, Elsevier Sci. Ltd.: Oxford, 2004. 2. Guillaumin, V.; Mankowski, G.; Corros. Sci. 2000, 42, 105. 3. Liu, N.; Wang, J.; Wang, L.; Wu, Y.; Corros. Sci. 2009, 51, 1328. 4. Pardo, A.; Merino, M. C.; Coy, A. E.; Arrabal, R.; Viejo, F.; Matykina,
E.; Corros. Sci. 2008, 50, 823.
5. Trueba, M.; Trasatti, S.; Mater. Chem. Phys. 2010, 121, 523. 6. Zaid, B.; Saidi, D.; Benzaid, A.; Hadji, S.; Corros. Sci. 2008, 50, 1841. 7. Ezuber, H.; El-Houd, A.; El-Shawesh, F.; Mater. Design 2008, 29, 801. 8. Restrepo, A. H.; Undergraduate Thesis, Universidad de Antioquia,
Colombia, 2008.
9. Banhart, J. C. S.; Neumann, U.; Proc. Conf. Materials in Oceanic Envi-ronment (Euromat ’98) 1998, 1, 55.
10. Banhart, J. In Proceedings Eurofoam; J. Banhart, J.; Zitha, P.; Verbist, G., eds., Verlag: Bremen, 2000, p. 13-20.
11. Fernández, P.; Torres V.; Cruz, G.; Gaviria, S.; Ochoa, E.; Sci. et Technica 2007, 677.
12. Fernández, P.; Cruz, L.; Coleto, J.; Revista de Metalurgia 2008, 44, 540. 13. Fernández, P.; Cruz, L.; Coleto, J.; Revista de Metalurgia 2009, 45, 124. 14. Fernández, P.; IBEROMET XI - X CONAMET/SAM, Viña del Mar, Chile,
2010.
15. Fernández, P.; Daza, M.; Oviedo, E.; Ortega, C.; Cruz, J.; Suplemento de la Revista Latinoamericana de Metalurgia y Materiales 2009, S1, 1269. 16. Nagy, E. B. A. Z.; Electrochemistry of corrosion, http://electrochem.
cwru.edu/encycl/art-c02-corrosion.htm, accessed February 2010. 17. Malayoglu, U.; Neville, A.; Lovelock, H.; Corros. Sci. 2005, 47, 1911. 18. Darowicki, S. K. A. K.; Anti-Corros. Methods Mater. 2010, 57, 28. 19. van Gheem, E.; Pintelon, R.; Vereecken, J.; Schoukens, J.; Hubin, A.;
Verboven, P.; Blajiev, O.; Electrochim. Acta 2004, 49, 4753.
20. Aoki, I. V.; Bernard, M. C.; de Torresi, S. I. C.; Deslouis, C.; de Melo, H. G.; Joiret, S.; Tribollet, B.; Electrochim. Acta 2001, 46, 1871. 21. León, M. A. V.; Ing. 2006, 16, 17.
22. Barcia, O.; Mattos, O.; Pebere, N.; Tribollet, B.; Electrochim. Acta 1996,
41, 1385.
23. Winston, R.; Uhlig’s Corrosion Handbook,2nd ed., John Wiley and Sons,
Inc.: New York, 2000.