The relationship between body mass index and body image
in Brazilian adults
Idalina S. Kakeshita and Sebastião Sousa Almeida
Universidade de São Paulo, Ribeirão Preto, BrazilAbstract
The aim of this work was to assess the relationship between nutritional status and body image perception in Brazilian adults. Participants included 280 adults (18-60 years) of both genders. The sample was composed proportionally to the Brazilian nutritional status distribution according to body mass index, with volunteers of all economic classes and educational levels. We applied a Figure Rating Scale to examine body image concerning size and shape. Both men and women were dissatisied with their body size. Regarding body discrepancy, eutrophic adults overestimated their body size and desired leaner bodies. Our results also showed that the higher the BMI, the smaller the differences between men and women. These indings reinforce that body image perception is an important factor to be considered by health professionals in order to improve quality of life. Keywords: Body mass index, body image, body discrepancy.
Received 10 September 2008; received in revised form 21 November 2008; accepted 04 December 2008. Available online 22 December 2008
Idalina S. Kakeshita and Sebastião de Sousa Almeida, Departamento de Psicologia e Educação, Faculdade de Filosoia, Ciências e Letras de Ribeirão Preto, Universidade de São Paulo , Brazil. Correspondence regarding this article should be directed to: Sebastião de Sousa Almeida, Laboratório de Nutrição e Comportamento do Departamento de Psicologia e Educação da Faculdade de Filosoia, Ciências e Letras de Ribeirão Preto. Av. Bandeirantes, 3900 – Monte Alegre – Ribeirão Preto – SP – CEP 14040-901. E-mail: [email protected]
NEUROSCIENCE
Introduction
The study of body image among normal populations has greatly increased over recent years (Tehard, Van Liere, Com Nougue & Clavel-Chapelon, 2002; Kakeshita & Almeida, 2006). It is also known that body image is a multi-dimensional construct with the implication of several variables (Thompson, 2004) and a large number of instruments have been developed to assess this construct (Thompson, 1996).
Previously, the studies focused on factors associated with body image disturbances related to neuropathological forms of body experiences, from a psychoanalytic perspective (Cash, 2004). Body image perception was assessed in both eating disordered (Matos et al., 2002; Vander Wal & Thomas, 2004; Legenbauer, Rühl & Vocks, 2008) and body dysmorphic disordered populations. Nowadays, research on body image has mostly focused on body image dissatisfaction among the normal population (Fingeret, Gleaves & Pearson, 2004; McCabe, Ricciardelli, Sitaram & Mikhail, 2006; Van Den
Berg et al., 2007; Neighbors & Sobal, 2007) in order to identify discrepancies in body image perception (Cachelin, Monreal & Juarez, 2006; Steenhuis, Bos & Mayer, 2006), which have been considered for the prevention and the treatment of a variety of other disorders (Matos et al., 2002), especially the ones involving behavioral changes (Lynch, Heil, Wagner & Havens, 2008) and/or the promotion of well-being and quality of life (Damasceno, Lima, Vianna, Vianna & Novaes, 2005).
In spite of the development of a large number of instruments (Thompson, 1996), the Figure Rating Scale has still been the most used tool for the assessment of body size and weight-related components of body image (Tehard, Van Liere, Com Nougué & Clavel-Chapelon, 2002; Fingeret, 2004; Sánchez-Johnsen, Hogan, Wilkens & Fitzbbon, 2008; Swami, Salem, Furnham & Tovée, 2008). It is a simple, low cost instrument which does not require the use of high technology equipment.
The aim of this study was to assess body image perception in a Brazilian adult sample according to the nutritional status
classiied by the body mass index (BMI) using the Figure
Rating Scale, which was developed by our group and had its reliability and validity previously tested in the Brazilian context (Kakeshita, 2008).
Methods
Participants
gender. This proposal was not possible due to the low occurrence of representative adults of the silhouettes in the lower end of the scale within the normative population.
Some participants would have to be contacted in speciic
programs for people with Anorexia Nervosa.
Therefore, in order to guide a feasible outlining, we decided to search for statistical data of the Brazilian population according to their BMI distribution. To this
end, the nutritional status classiication based on the
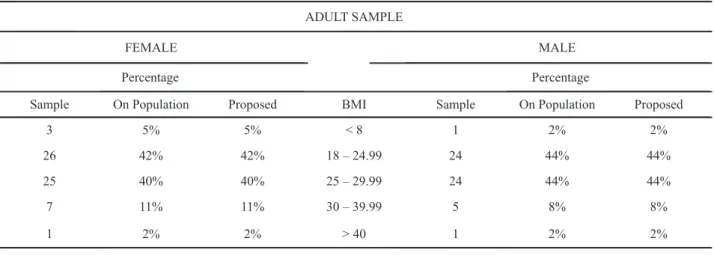
anthropometric measures of the last Family Expenditure Survey (POF-2002-2003) of the Brazilian Institute of Geography and Statistics (IBGE, 2004) was used. Thus, the minimal sample size contained people representing the BMI classes according to the World Health Organization (WHO, 1997) (Table 1) and each BMI interval of the Figure Rating Scale (Kakeshita, 2008).
This research was carried out at the urban zone of two cities in the countryside of the state of São Paulo (Brazil). Participants were recruited in a variety of places, such as colleges and health and recreation centers. A similar percentage of men and women (50.71% and 49.29%, respectively), of different ages, socioeconomic status, educational level and BMI classes were included.
The data collection began as soon as the Ethics Committee of the Faculty of Philosophy, Sciences and Letters of Ribeirão Preto, University of São Paulo, approved the research. Data from 311 adults between the ages of 18-59(163 women and 148 men) were collected. Data from below-normal BMI and morbid obese participants were excluded, given that their low representativeness percentage could bias the statistical
analysis (see Table 1). The inal convenient sample was
composed by 280 volunteers (138 women and 142 men).
Apparatus
The Figure Rating Scale developed by Kakeshita (2008) was used. This scale consists of 15 cards depicting each gender with drawings of silhouettes.
Each silhouette represents a BMI interval with mean values of BMI ranging from 12.5 kg/m2 to 47.5 kg/m2.
Participants’ weight and height were measured using an electronic calibrated scale and a portable anthrop meter (Kratos-Cas, Brazil).
Procedure
All participants gave signed informed consent. Personal and social demographic data were collected. Presented with the scale of their own gender in ascending order, from very thin to very large silhouettes,
the participants were required to indicate which igure
best represented their current and desired body size,
as well as the igure they believed to be the ideal body
size in general. After measuring their weight and height, we calculated their actual BMI. The difference between current and actual BMI was considered body discrepancy, and the difference between desired and actual BMI was considered body dissatisfaction. The
current BMI is the BMI represented by the igure
indicated by the participants as representing their actual body size. The actual BMI is the BMI calculated based on the weight and height of the participants.
Statistics
The data were analyzed using the software SPSS 13.0. A two-way analysis of variance (ANOVA) was performed to analyze the effect of gender and BMI class (normal, overweight, obese) on body image discrepancy and dissatisfaction, examining differences between current, desired and actual BMI. The post hoc analysis was conducted using the Newman-Keuls test with the
level of signiicance set at 5%.
Results
The frequency distribution of the inal sample is shown in
Table 2, according to the variables used in the characterization of the normative Brazilian adults of both genders.
ADULT SAMPLE
FEMALE MALE
Percentage Percentage
Sample On Population Proposed BMI Sample On Population Proposed
3 5% 5% < 8 1 2% 2%
26 42% 42% 18 – 24.99 24 44% 44%
25 40% 40% 25 – 29.99 24 44% 44%
7 11% 11% 30 – 39.99 5 8% 8%
1 2% 2% > 40 1 2% 2%
Total: 62 Total: 55
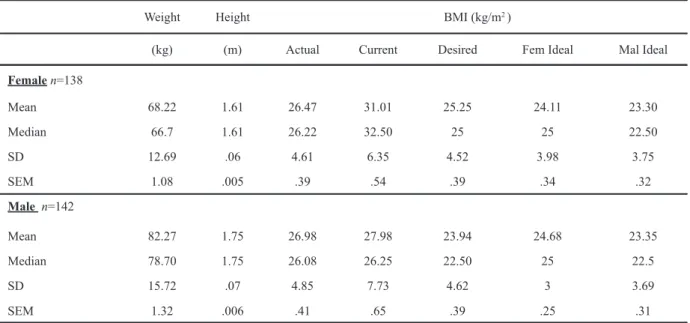
The examination of the means (Table 3) demonstrated that both men and women distorted their current body size. Women overestimated their current body size more
than men. Pearson’s correlation coeficients between actual and current BMI measures were signiicantly
positive and high for women (r=.81; p<.01) and men
(r=.84; p<.01). ANOVA showed signiicant differences
for gender [F(1,274)=45.48; p<.001] and BMI class [F(2,274)=8.33; p<.001].
Figure 1 demonstrates the differences of the discrepancy by gender and BMI class which were given by the differences between current and actual BMI, with positive (overestimation) or negative (underestimation) absolute values. Positive values indicate that the participants perceived themselves as larger than they actually were. Overestimation was found in all groups, except in men with normal BMI interval, who underestimated their body size as represented by negative values.
The examination of body image dissatisfaction (Figure 2), considered as the difference between the
desired and current BMI, also revealed signiicant
differences for gender [F(2,274)=9.81; p<.01], BMI class [F(2,274)=67.18; p<.001] and the interaction of both factors [F(2,274)=2.96; p<.05]. In spite of the different magnitudes, all participants of this study were
dissatisied with their body size, desiring to be thinner
than they thought they were, and this was true even for eutrophic male participants.
Discussion
The Figure Rating Scale has been usually used to evaluate body dissatisfaction alone (Fingeret et al., 2004). In this study, the psychometric qualities of the scale we used also enabled the evaluation of the body image discrepancy by the difference between the current and actual body size perception. The scale presented a test-retest reliability of
.93 (p<.01) for current BMI and a correlation coeficient of
Variables
Female Male
n (%) n (%)
BMI class
Eutrophic 58 (48.03) 58 (41)
Overweight 51 (37) 48 (34)
Obese 29 (21) 36 (25)
Age (years)
18 - 30 70 (50.72) 82 (57.75)
31 - 40 43 (31.16) 35 (24.65)
41 - 59 25 (18.12) 25 (17.60)
Social economic status
A1 + A2 12 (8.7) 30 (21.31)
B1 + B2 42 (30.44) 54 (38.03)
C 63 (45.65) 51 (35.92)
D 21 (15.22) 7 (4.93)
Educational level
Primary 49 (36) 19 (13.5)
Secondary 54 (39) 77 (54)
College 35 (25) 46 (32.5)
Total sample (n=280) 138 (49.29) 142 (50.71) Table 2. Frequency distribution of the adult sample (n=280) according to its social demographic variables.
Figure 2. Body dissatisfaction given by the difference between desired and actual BMI, by gender and BMI class. Bars represent the SEM. * p<.05 compared to women and men of all other BMI classes. ** p<.01 compared to other classes except obese women and men. *** p<.001 compared to eutrophic women and men, and overweight men.
.84 (p<.01) between actual and current BMI measured in two different moments (Kakeshita, 2008).
The results concerning body image discrepancies
are in agreement with previous indings. Women in
general overestimate their body size more than men (Laus, Zancul, Martins, Kakeshita & Almeida, 2006; Steenhuis et al., 2006; Bessenoff & Snow, 2006), and overweight or pre-obese women present the highest levels of body size overestimation in relation to normal and obese women and men. One possible explanation
for this inding is that pre-obese women are more likely
to be vulnerable to body shame, as they have not been
classiied as obese yet, but are far from the
socio-cultural standard of beauty and successful woman body size and shape. By overestimating their body sizes, they could express the consciousness of not being within the healthy and recommended nutritional status.
Additional studies in order to examine the current body self perception in relation to biological, psychological, and social factors are needed. They are particularly important when it comes to overweight people who are more vulnerable to emotional consequences such as shame and inadequate eating behavior reactions. These people tend to fail to join health programs to prevent obesity and related co-morbidities before becoming actually obese (Brownell & Rodin, 1994; Wadden, Brownell & Foster, 2002; Bernardi, Cichelero & Vitolo, 2005; Kakeshita & Almeida, 2006).
Regarding body image dissatisfaction, our results
reinforce previous indings showing that females present
greater body dissatisfaction than males (Van Den Berg et al., 2007; Neighbors & Sobal, 2007). Van Den Berg et al.
(2007) showed that males and females are dissatisied with
their bodies, but quite differently affected by the variables which mediate body dissatisfaction. Similarly, Lynch et al.
(2008) found that body dissatisfaction is present in both
males and females, and it is a highly signiicant mediator
of the relationship between BMI, body size, risky weight control behaviors, and vulnerability to eating disorders.
On the other hand, the worldwide prevalence of overweight and obesity has led people to search for an attainable normative body size and shape. However, the normative condition is quite close to overweight, despite the recommendations of a healthy body size (Donath, 2000).
Finally, further studies are needed to better understand the processes and variables related to body image, body discrepancy, and body dissatisfaction.
The remaining question is how these indings can
help us elaborate preventive actions and public health programs, in order to provide people with a better quality of life.
Acknowledgment
Research supported by grants from the National Council
for Scientiic and Technological Development (CNPq).
References
Bernardi, F., Cichelero, C., & Vitolo, M.R. (2005). Restrained eating behavior and obesity. Brazilian Journal of Nutrition, 18(1), 85-93.
Bessenoff, G.R., & Snow, D. (2006). Absorbing society’s inluence:
Body image self-discrepancy and internalized shame. Sex Roles, 54, 727-731.
Brownell, K.D., & Rodin, J. (1994). The Dieting Maelstrom – Is it possible and advisable to lose weight? American Psychologist, 49(9), 781-791.
Cachelin, F.M., Monreal, T.K., & Juarez, L.C. (2006). Body image and size perception of Mexican American women. Body Image, 3, 67-75. Cash, T.F. (2004). Body image: Past, present, and future. Body Image, 1, 1-5. Damasceno, V.O., Lima, J.R.P., Vianna, J.M., Vianna, V.R.A., &
Novaes, J.S. (2005). Tipo físico ideal e satisfação com a imagem corporal de praticantes de caminhada. Revista Brasileira de Medicina do Esporte,11(3), 181-186.
Weight Height BMI (kg/m2 )
(kg) (m) Actual Current Desired Fem Ideal Mal Ideal
Female n=138
Mean 68.22 1.61 26.47 31.01 25.25 24.11 23.30
Median 66.7 1.61 26.22 32.50 25 25 22.50
SD 12.69 .06 4.61 6.35 4.52 3.98 3.75
SEM 1.08 .005 .39 .54 .39 .34 .32
Male n=142
Mean 82.27 1.75 26.98 27.98 23.94 24.68 23.35
Median 78.70 1.75 26.08 26.25 22.50 25 22.5
SD 15.72 .07 4.85 7.73 4.62 3 3.69
SEM 1.32 .006 .41 .65 .39 .25 .31
Table 3. Descriptive data of the adult sample (n=280) by gender, related to weight, height, actual BMI, and the perceived igures
Donath, S.M. (2000). Who’s overweight? Comparison of the medical
deinition and community views. MJA-Medical Journal Australian, 172(8), 375-377.
Fingeret, M.C., Gleaves, D.H., & Pearson, C.A. (2004). On the
methodology of body image assessment: the use of igural
rating scales to evaluate body dissatisfaction and the ideal body standards of women. Body Image, 1, 207-212.
Instituto Brasileiro de Geograia e Estatística (IBGE). (2004). Pesquisa de Orçamento Familiar (POF) 2002-2003: primeiros resultados: Brasil e grandes regiões. Análise da disponibilidade domiciliar de alimentos e do Estado Nutricional no Brasil. Available online at: <http://www.ibge.gov.br> Accessed in: 02 jun. 2008. Kakeshita, I.S., & Almeida, S.S. (2006). Relationship between body
mass index and self-perception among university students.
Revista de Saúde Pública, 40(3), 497-504.
Kakeshita, I.S. (2008).Adaptation and validation of a Figure Rating Scale for Brazilian children and adults. 2008. Doctoral Thesis, Faculdade de Filosofia Ciências e Letras de Ribeirão Preto, Universidade de São Paulo. Laus, M.F., Zancul, M.S., Martins, T.M., Kakeshita, I.S., & Almeida,
S.S. (2006). Percepção da imagem corporal e estado nutricional em estudantes de nutrição. Alimentos e Nutrição, 17(1), 85-89.
Legenbauer, T., Rühl, I., & Vocks, S. (2008). Inluence of
appearance-related TV commercials on body image state. Behavior Modiication, 32, 352-370.
Lynch, W.C., Heil, D.P., Wagner, E., & Havens, M.D. (2008). Body dissatisfaction mediates the association between body mass index and risky weight control behaviors among White and Native American adolescent girls. Appetite, 51, 210-213. Matos, M.I.R, Aranha, L.S, Faria, A.N., Ferreira, S.R.G., Bacaltchuck,
J., & Zanella, M.T. (2002). Binge eating disorder, anxiety, depression and body image in grade III obesity patients. Revista Brasileira de Psiquiatria, 24(4), 165-169.
McCabe, M.P., Ricciardelli, L.A., Sitaram, G., & Mikhail, K. (2006). Accuracy of body size estimation: Role of biopsychosocial variables. Body Image, 3(2), 163-171.
Neighbors, L.A., & Sobal, J. (2007). Prevalence and magnitude of body weight and shape dissatisfaction among university students.
Eating Behaviors, 8, 429-439.
Sánchez-Johnsen, L.A.P., Hogan, K.., Wilkens, L.R., & Fitzgibbon, M.L. (2008). Correlates of problematic eating behaviors in less acculturated Latinas. Eating Behaviors, 9, 181-189.
Steenhuis, I.H.M., Bos, A.E.R., & Mayert, B. (2006). (Mis) interpretation of body weight in adult women and men. Journal of Human Nutrition Dietetic, 19, 219-228.
Swami, V., Salem, N., Furnham, A., & Tovée, M.J. (2008). Initial examination of the validity and reliability of the female
photographic igure rating scale for body image assessment.
Personality and Individual Differences. Available online at: <www.sciencedirect.com>.
Tehard, B., Van Liere M.J., Com Nougué, C., & Clavel-Chapelon, F. (2002). Anthropometric measurements and body silhouette of women: Validity and perception. Journal of the American Dietetic Association, 102(12), 1779-1784.
Thompson, J.K. (1996). Assessing body image disturbance: measures, methodology, and implement. In: Thompson, J.K. (Ed.). Body image, eating disorders, and obesity:an integrative guide for assessment and treatment. (pp. 51-61). Washington, D.C.: American Psychological Association.
Thompson, J. K. (2004). The (mis)measurement of body image: Ten strategies to improve assessment for applied and research purposes. Body Image, 1, 7-14.
Van Den Berg, P., Paxton, S.J., Keery, H., Wall, M., Guo, J., & Neumark-Sztainer, D. (2007). Body dissatisfaction and body comparison with media images in males and females. Body Image, 4, 257-268.
Vander Wal, J.S., & Thomas, N. (2004). Predictors of body image dissatisfaction and disturbed eating attitudes and behaviors in African American and Hispanic girls. Eating Behavior, 5, 291-301. Wadden, T.A., Brownell, K.D., & Foster, G.D. (2002). Obesity:
Responding to the global epidemic. Journal of Consulting and Clinical Psychology, 70(3), 510-525.