ACPD
14, 26803–26855, 2014The effects of China’s pollution control on
atmospheric Hg emissions
Y. Zhao et al.
Title Page
Abstract Introduction
Conclusions References
Tables Figures
◭ ◮
◭ ◮
Back Close
Full Screen / Esc
Printer-friendly Version
Interactive Discussion
Discussion
P
a
per
|
Discus
sion
P
a
per
|
Discussion
P
a
per
|
Discussion
P
a
per
|
Atmos. Chem. Phys. Discuss., 14, 26803–26855, 2014 www.atmos-chem-phys-discuss.net/14/26803/2014/ doi:10.5194/acpd-14-26803-2014
© Author(s) 2014. CC Attribution 3.0 License.
This discussion paper is/has been under review for the journal Atmospheric Chemistry and Physics (ACP). Please refer to the corresponding final paper in ACP if available.
Evaluating the e
ff
ects of China’s pollution
control on inter-annual trends and
uncertainties of atmospheric mercury
emissions
Y. Zhao1, H. Zhong1, J. Zhang2, and C. P. Nielsen3
1
State Key Laboratory of Pollution Control & Resource Reuse and School of the Environment, Nanjing University, 163 Xianlin Ave., Nanjing, Jiangsu 210023, China
2
Jiangsu Provincial Academy of Environmental Science, 241 West Fenghuang St., Nanjing, Jiangsu 210036, China
3
Harvard China Project, School of Engineering and Applied Sciences, Harvard University, 29 Oxford St, Cambridge, MA 02138, USA
Received: 20 September 2014 – Accepted: 3 October 2014 – Published: 27 October 2014
Correspondence to: Y. Zhao ([email protected])
ACPD
14, 26803–26855, 2014The effects of China’s pollution control on
atmospheric Hg emissions
Y. Zhao et al.
Title Page
Abstract Introduction
Conclusions References
Tables Figures
◭ ◮
◭ ◮
Back Close
Full Screen / Esc
Printer-friendly Version
Interactive Discussion
Discussion
P
a
per
|
Discus
sion
P
a
per
|
Discussion
P
a
per
|
Discussion
P
a
per
Abstract
China’s atmospheric mercury (Hg) emissions of anthropogenic origin have been eff ec-tively restrained through the national policy of air pollution control. Improved methods based on available field measurements are developed to quantify the benefits of Hg abatement through various emission control measures. Those measures include
in-5
creased use of flue gas desulfurization (FGD) and selective catalyst reduction (SCR) systems for power sector, precalciners with fabric filter (FF) for cement production, ma-chinery coking with electrostatic precipitator (ESP) for iron and steel production, and advanced manufacturing technologies for nonferrous metal smelting. Declining trends in emissions factors for those sources are revealed, leading to a much slower growth of
10
national total Hg emissions than that of energy and economy, from 679 in 2005 to 750 metric tons (t) in 2012. In particular, nearly half of emissions from the above-mentioned four types of sources are expected to be reduced in 2012, attributed to expansion of technologies with high energy efficiencies and air pollutant removal rates after 2005. The speciation of Hg emissions keeps stable for recent years, with the mass fractions
15
of around 55, 39 and 6 % for Hg0, Hg2+and Hgp, respectively. The lower estimate of Hg emissions than previous inventories is supported by limited chemistry simulation work, but middle-to-long term observation on ambient Hg levels is further needed to justify the inter-annual trends of estimated Hg emissions. With improved implementation of emission controls and energy saving, 23 % reduction in annual Hg emissions for the
20
most optimistic case in 2030 is expected compared to 2012, with total emissions below 600 t. While Hg emissions are evaluated to be gradually constrained, increased un-certainties are quantified with Monte-Carlo simulation for recent years, particularly for power and certain industrial sources. The uncertainty of Hg emissions from coal-fired power plants, as an example, increased from −48∼+73 % in 2005 to −50∼+89 %
25
ACPD
14, 26803–26855, 2014The effects of China’s pollution control on
atmospheric Hg emissions
Y. Zhao et al.
Title Page
Abstract Introduction
Conclusions References
Tables Figures
◭ ◮
◭ ◮
Back Close
Full Screen / Esc
Printer-friendly Version
Interactive Discussion
Discussion
P
a
per
|
Discus
sion
P
a
per
|
Discussion
P
a
per
|
Discussion
P
a
per
|
those technologies results in lower but highly varied emission factors. To further confirm the benefits of pollution control polices with reduced uncertainty, therefore, systematic investigations are recommended specific for Hg pollution sources, and the variability of temporal trends and spatial distributions of Hg emissions need to be better tracked for the country under dramatic changes in economy, energy and air pollution status.
5
1 Introduction
Increasing international attentions and efforts have been made on study and control of mercury (Hg), a well-known pollutant due to its toxicity and long-range transport. Atmospheric release is identified as the most significant for Hg emissions (Pirrone and Mason, 2009). Different from other heavy metals that are mainly associated with air
10
particles, atmospheric Hg includes the gaseous elemental Hg (GEM, Hg0) that has longest lifetime and transport distance, reactive gaseous mercury (RGM, Hg2+) that is more affected by local sources, and particle-bound mercury (PBM, Hgp).
Coal combustion is major source of anthropogenic Hg. As its energy supply is dom-inated by coal, China’s atmospheric Hg emissions from coal combustion have been
15
analyzed by series of studies since late 1990s (Wang et al., 2000; Streets et al., 2005; Wu et al., 2006; Pacyna et al., 2010; Tian et al., 2010). Pacyna et al. (2010) calculated the national emissions from fossil fuel use at 400 metric tons (t) in 2005, accounting for almost half of the country’s anthropogenic emissions. In recent years, research focus has been broadened from coal combustion to other industrial and residential sectors
20
including cement (Li, 2011), metal mining and smelting (P. Li et al., 2009; Li et al. 2012, 2010; Wang et al., 2010a; Wu et al., 2012), solid waste incinerator (L. Chen et al., 2013; Hu et al., 2012) and biomass burning (C. Chen et al., 2013; Huang et al., 2011). Growing domestic field measurements have been conducted for those sources and the results are expected to be applied for improving estimate of China’s anthropogenic
25
ACPD
14, 26803–26855, 2014The effects of China’s pollution control on
atmospheric Hg emissions
Y. Zhao et al.
Title Page
Abstract Introduction
Conclusions References
Tables Figures
◭ ◮
◭ ◮
Back Close
Full Screen / Esc
Printer-friendly Version
Interactive Discussion
Discussion
P
a
per
|
Discus
sion
P
a
per
|
Discussion
P
a
per
|
Discussion
P
a
per
et al., 2012a; Pacyna et al., 2010; Pirrone et al., 2010) as well as some other crite-ria pollutants like SO2 and NOX, attributed largely to big and fast growing industrial economy and intensive use of fossil fuels.
Under big pressure to improve air quality, China’s government has been implement-ing series of comprehensive national policy of energy conservation and emission
con-5
trol. Since 2005, for example, the small and inefficient plants or boilers in the power sector and certain heavy industrial sectors including cement and steel production have been gradually replaced with larger, energy-efficient ones with advanced dust collec-tors; and flue gas desulfurization (FGD) systems have been compulsorily installed at all newly built thermal power units for SO2 emission abatement (Zhao et al., 2008,
10
2013). Given the recent serious urban air pollution and extremely severe regional haze episodes across the country, more efforts in air pollution control are or will be required. Since 2010, selective catalyst reduction (SCR) systems have been widely applied in power sector for NOxcontrol, and a set of emission standards across various sectors, have been updated or proposed, with much more tightened criteria pollutant emission
15
limits than previous ones. The announcement of national plan of air pollution control action is expected to result in further solid work on emission abatement and air quality improvement in the future (Zhao et al., 2014).
Although not specific for Hg control, those above-mentioned policy and measures have ancillary benefits of atmospheric Hg emission abatement. For example, the use
20
of advanced dust collectors (e.g., fabric filter (FF) and electrostatic precipitator (ESP)) and FGD are expected to capture part of Hg into fly ash or gypsum and to significantly reduce the emission levels (USEPA, 2002a; Wang et al., 2010b). SCR catalyst is able to convert part of Hg0to Hg2+ that is more liable to be absorbed by the FGD scrubber (Wang et al., 2012; Tian et al., 2012). The varied penetrations of air pollutant
con-25
ex-ACPD
14, 26803–26855, 2014The effects of China’s pollution control on
atmospheric Hg emissions
Y. Zhao et al.
Title Page
Abstract Introduction
Conclusions References
Tables Figures
◭ ◮
◭ ◮
Back Close
Full Screen / Esc
Printer-friendly Version
Interactive Discussion
Discussion
P
a
per
|
Discus
sion
P
a
per
|
Discussion
P
a
per
|
Discussion
P
a
per
|
pected to reach 70 % in 2015 from 10 % in 2010 (Wang, 2013). If such swift changes of emission control are not well evaluated, possible overestimate in recent and future emissions for the country would be made, and misleading conclusions (e.g., elevated contribution of China’s emissions to the Hg pollution) would be drawn once those esti-mates are further used for model simulation. Besides the recent and future trends, the
5
uncertainty of Hg emissions is not thoroughly analyzed, which is another big concern in the community (Pacyna et al., 2010; Ci et al., 2012). Till now only the uncertainty of emissions from power sector are systematically quantified for the country (Wu et al., 2010), attributed mainly to the limited information of other emission sources. The lack of analysis on emission control effectiveness and uncertainty in emissions might lead
10
to inconsistence between the estimated increased emissions (driven by Asia) and de-creased worldwide trends in background atmospheric Hg concentrations (Slemr et al., 2011; Ci et al., 2012).
This study, therefore, evaluates the effects of recently implemented and ongoing con-trol measures on the past and future inter-annual trends and sector distributions of
15
China’s anthropogenic Hg emissions. The uncertainty of emissions is quantified with most sensitive parameters identified for further improvement of emission estimate. Sec-tion 2 briefly describes the methodology of emission inventory development with im-proved data and methods for certain emission sources specifically stressed, the basic assumptions in scenarios for future emission prediction, and the Monte-Carlo
frame-20
work of uncertainty analysis. Section 3 is a thorough analysis of Hg emission factors by species, sector and year, incorporating the latest information of emission control strategies and the data of domestic field measurements and investigations. Section 4 presents China’s recent trends of anthropogenic Hg emissions (2005–2012) and future trajectories by scenario (till 2030), the effects of pollution control measures,
evalua-25
ACPD
14, 26803–26855, 2014The effects of China’s pollution control on
atmospheric Hg emissions
Y. Zhao et al.
Title Page
Abstract Introduction
Conclusions References
Tables Figures
◭ ◮
◭ ◮
Back Close
Full Screen / Esc
Printer-friendly Version
Interactive Discussion
Discussion
P
a
per
|
Discus
sion
P
a
per
|
Discussion
P
a
per
|
Discussion
P
a
per
2 Methodology and data sources
2.1 Brief summary of Hg emission estimate
The research domain covers the 31 provinces of mainland China, and annual Hg emis-sions with speciation (Hg0, Hg2+, and Hgp) at provincial level are estimated from 2005 to 2012 to evaluate the effectiveness of China’s air pollution control measures. Main
5
anthropogenic activities fall into three main sector categories: coal-fired power plants (CPP), all other industry (IND), and the residential and commercial sector (RES). IND is further divided into cement production (CEM), iron and steel plants (ISP), heating boilers (HB), other industrial boilers (OIB), nonferrous metal smelting (NMS), gold met-allurgy (GM), and other miscellaneous processes (OMP). RES mainly includes the
10
coal combustion (RC), oil and gas combustion (ROG), biofuel use/biomass open burn-ing (BIO), and solid waste incineration (SWI) subcategories. As the dominatburn-ing primary energy resource, coal plays important roles in China’s anthropogenic pollutant emis-sions (Zhao et al., 2013). In this work, therefore, the Hg emisemis-sions from coal use are estimated based on the above-mentioned source categories, e.g., power plants,
indus-15
trial boilers, residential coal stoves, and iron and steel production (most emissions of which come from coal use). For cement production, Hg emissions come both from coal combustion and non-combustion process, and a new method is developed in this work to differentiate the two parts, as described in Sect. 2.2.
In general, annual emissions of total and certain speciation Hg for a given province
20
i and a given yeartare calculated using Eqs. (1) and (2), respectively:
Ei,t=X m
X
n
ALm,n,i,t×EFm,n,i,t (1)
Ei,t,s=X m
X
n
ALm,n,i,t×EFm,n,i,t×fm,n (2)
whereE is the Hg emission; AL is the activity levels (fuel consumption or industrial
25
ACPD
14, 26803–26855, 2014The effects of China’s pollution control on
atmospheric Hg emissions
Y. Zhao et al.
Title Page
Abstract Introduction
Conclusions References
Tables Figures
◭ ◮
◭ ◮
Back Close
Full Screen / Esc
Printer-friendly Version
Interactive Discussion
Discussion
P
a
per
|
Discus
sion
P
a
per
|
Discussion
P
a
per
|
Discussion
P
a
per
|
f is the mass fraction of given Hg speciation; i, t, m, n and s represent province, year, emission source type, technology of manufacturing and emission control, and Hg speciation (Hg0, Hg2+ or Hgp).
For coal combustion, Eq. (1) can be further revised to Eq. (3) with detailed combustor and fuel information:
5
Ei,t=X m
X
n
ALm,n,i,t×HgCi,t×Rm,n× 1−ηm,n,t
(3)
where HgC is the Hg content of coal by province;R is the mass fraction of Hg released from fuels;ηis Hg removal efficiency of air pollution control devices.
There are some sources of which the emissions cannot be directly calculated based
10
on emission factor and activity level, attributed mainly to lack of information. Arti-sanal and small-scale gold metallurgy (ASGM), for example, was officially prohibited in 1990s, but it may still exist illegally in some areas driven by huge economic profit. Difficult to estimate the penetration of those technologies, the results of expert judg-ment have to be applied in this work (AMAP and UNEP, 2013).
15
Activity levels for 2005–2012 are compiled annually by sector from various data sources. Multiple-year fossil fuel consumption and industrial production at provincial level are obtained from Chinese official energy (NBS, 2013a) and industrial economy statistics (NBS, 2013b), respectively. The coal consumptions from CEM and ISP are calculated following the methods by Zhao et al. (2011, 2012), and the coal consumption
20
by OIB is estimated by subtracting the fuel consumed by CEM, ISP and HB from that by IND (Zhao et al., 2012). The annual biofuel use before 2008 are taken from official statistics (NBS, 2013a), and those for the following years are from unpublished data by Ministry of Agriculture, since official statistics stopped reporting the relevant data from 2008 (C. Chen et al., 2013). The biomass combusted in open fields are calculated as
25
ACPD
14, 26803–26855, 2014The effects of China’s pollution control on
atmospheric Hg emissions
Y. Zhao et al.
Title Page
Abstract Introduction
Conclusions References
Tables Figures
◭ ◮
◭ ◮
Back Close
Full Screen / Esc
Printer-friendly Version
Interactive Discussion
Discussion
P
a
per
|
Discus
sion
P
a
per
|
Discussion
P
a
per
|
Discussion
P
a
per
a product of rural population, the average waste per capita, and the ratios of waste that is burned (Yao et al., 2009).
The Hg emission factors, speciation and the time-series trends due to improved con-trols will be described by sector in Sect. 3.
2.2 Improved methods of emission estimate for given sources
5
The data and methods of emission estimate for given industrial sources are updated in this work to better understand the effectiveness of ongoing pollution control measures in China. Those sources include cement, iron and steel production, and nonferrous metal smelting, the emissions of which were traditionally estimated with uniform and time-independent emission factors at sector average level.
10
With improved data on kiln technology and emission control devices (Lei et al., 2011; Zhao et al., 2013), the technology/device penetrations of cement production for mul-tiple years are derived in this work. The Hg emission factors by control type from do-mestic measurements are accordingly applied to generate the inter-annual trends of emissions. Equation (3) is used as well to separate the emissions from coal use. For
15
nonferrous metal smelting, similarly, the penetrations of different manufacturing tech-nologies for typical years (2005, 2007 and 2010) are obtained from a plant-by-plant database developed by Tsinghua University (Wu et al., 2012), and penetrations for other years have to be interpolated attributed to lack of information. The inter-annual trends of emissions can then be estimated combining the penetration and emission
20
factors by technology.
For iron and steel production, Hg emissions come mainly from coal-consuming pro-cesses including coking, sintering, and pig iron production. In recent years, implemen-tation of national energy saving and pollution control policy leads to improved energy efficiency and enhanced use of emission control devices of those processes (Zhao
25
ACPD
14, 26803–26855, 2014The effects of China’s pollution control on
atmospheric Hg emissions
Y. Zhao et al.
Title Page
Abstract Introduction
Conclusions References
Tables Figures
◭ ◮
◭ ◮
Back Close
Full Screen / Esc
Printer-friendly Version
Interactive Discussion
Discussion
P
a
per
|
Discus
sion
P
a
per
|
Discussion
P
a
per
|
Discussion
P
a
per
|
as fuel and total coal use for the sector. In this work, therefore, the coal consumption by process is estimated as the combusted coal for the whole sector weighted by the process-specific energy efficiency (expressed as kg coal-equivalent per unit produc-tion, Wang et al., 2011).
2.3 Uncertainty analysis
5
The uncertainties of Hg emissions with different chemical speciation are quantified by sector and year using a Monte-Carlo framework developed by Zhao et al. (2011). Prob-ability distributions are estimated for all the parameters with different principles. Ten thousands simulations are then performed to estimate the uncertainties of emissions and to identify the crucial parameters that significantly contribute to the uncertainties
10
for different source types.
In most cases, the uncertainties of activity levels (including penetration rates of dif-ferent technologies by sector) are determined following our previous work (Zhao et al., 2011, 2013). Generally, normal distributions are assumed for fuel consumption and in-dustrial and agricultural production, with coefficients of variation (CV, the SD divided
15
by the mean) set at 5, 10 and 20 % for power, industry and residential and commercial sectors, respectively. It should be noted that some activity levels are strongly associ-ated with others, e.g., the use of coke, and the production of sinter, pig iron and steel. For those parameters, a correlation coefficient of 1 is applied to represent the full cor-relation and to avoid possible underestimate of uncertainties from the “compensation
20
of error” mechanism (Zhao et al., 2011).
A comprehensive analysis of uncertainties of Hg emission factors was conducted by sector and species, with domestic field measurements thoroughly evaluated. For parameters with adequate measurement data, the Kolmogorov–Smirnov test for the goodness-of-fit (p=0.05) is applied and bootstrap simulation is in succession
con-25
ACPD
14, 26803–26855, 2014The effects of China’s pollution control on
atmospheric Hg emissions
Y. Zhao et al.
Title Page
Abstract Introduction
Conclusions References
Tables Figures
◭ ◮
◭ ◮
Back Close
Full Screen / Esc
Printer-friendly Version
Interactive Discussion
Discussion
P
a
per
|
Discus
sion
P
a
per
|
Discussion
P
a
per
|
Discussion
P
a
per
experience of previous work (e.g., Wu et al., 2010) and authors’ judgment. The details for emission factor uncertainties by sector will be discussed in Sect. 3.
For ASGM of which the emissions were not calculated with emission factor method-ology but directly taken from other study, the uncertainties are assumed at±67 % ac-cording to expert judgment (AMAP and UNEP, 2013).
5
2.4 Emission projections till 2030
Three scenarios are determined to predict China’s atmospheric Hg emissions in 2015, 2020 and 2030. Scenario 0 (S0) is the most conservative case in which the national policy of energy saving and air pollution control will not change in practice after 2012. This does not imply, however, that the penetration levels of advanced technologies
10
and emission control devices for specific will necessarily be the same as in 2012. For example, the current policy on power sector will undoubtedly raise the use of FGD and SCR systems, and that on cement will increase the share of precalciner kilns with FF systems (the share of precalciner kilns would reach 100 % in 2030, compared to 88 % in 2012). While keeping the control strategy the same as S0, Scenario 1 (S1)
15
integrates the national energy policy commitments that have been announced (e.g., the plans to reduce fossil energy use and to reduce greenhouse gas emissions) and thus shows the benefits of energy saving on Hg emissions. The activity level data for S0 and S1 come respectively from the CPS and NPS scenarios by our previous work (Zhao et al., 2014), which are mainly based on the projection by IEA (2012) with
20
revisions on specific sectors including power and transportation. For sources that are not mentioned in Zhao et al. (2014), the specific working reports are consulted. For example, the burned ratio of urban municipal solid waste is assumed to reach 50 % in 2030, according to CAUES (2013). Scenario 2 shares the same activity level trends as S1 but includes more stringent emission control mainly for industrial sources. Those
25
ACPD
14, 26803–26855, 2014The effects of China’s pollution control on
atmospheric Hg emissions
Y. Zhao et al.
Title Page
Abstract Introduction
Conclusions References
Tables Figures
◭ ◮
◭ ◮
Back Close
Full Screen / Esc
Printer-friendly Version
Interactive Discussion
Discussion
P
a
per
|
Discus
sion
P
a
per
|
Discussion
P
a
per
|
Discussion
P
a
per
|
electric furnaces for steel smelting resulting in less pig iron production and thereby less coal combustion, and more penetrations of advanced manufacturing technologies with lower Hg emission factors for non-ferrous metal smelting. The detailed benefits of those technologies on Hg emission control can be found in Sect. 3.
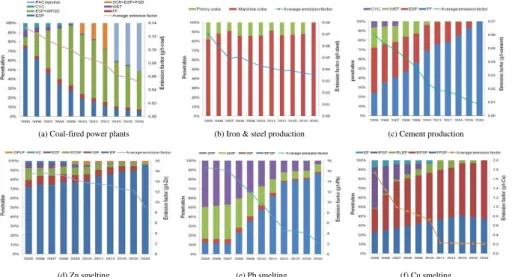
3 Evolution of emission factors
5
3.1 Evolution of emission factors for key sectors with key assumptions and
uncertainties
The improvements of emission factors come mainly from two aspects: (1) new and better data available from domestic measurements for key sectors; and (2) better un-derstanding on penetration variations of manufacture and control technologies for
dif-10
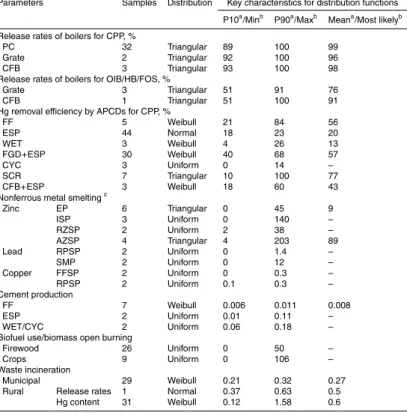
ferent sources during 2005–2012. Those improvements thus provide more accurate emission factors with clearer inter-annual trends by sector, as shown in Fig. 1. In this study, a comprehensive review of literatures is conducted and an updated database for China’s atmospheric Hg emission factors is established, with their uncertainties care-fully analyzed expressed by probability distribution functions (PDF), as summarized in
15
Table 1.
3.1.1 Power plants
As Eq. (3) indicates, the integrated Hg emission factor for power plants, expressed as the metric tons (t) Hg emissions per million metric tons (Mt) coal combusted, are calculated as the product of the Hg content of coal, release rate of specific combustion
20
ACPD
14, 26803–26855, 2014The effects of China’s pollution control on
atmospheric Hg emissions
Y. Zhao et al.
Title Page
Abstract Introduction
Conclusions References
Tables Figures
◭ ◮
◭ ◮
Back Close
Full Screen / Esc
Printer-friendly Version
Interactive Discussion
Discussion
P
a
per
|
Discus
sion
P
a
per
|
Discussion
P
a
per
|
Discussion
P
a
per
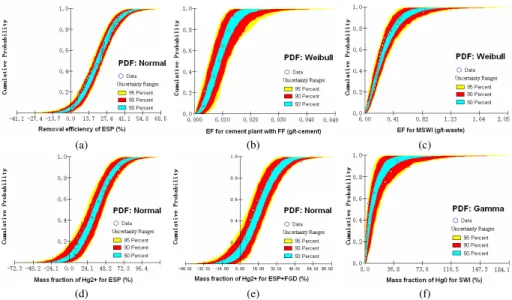
determine the values and uncertainties by province, i.e., the percentiles of Hg con-tent by province are estimated based on the available measurements data and the lognormal distributions are conservatively applied as PDF, with relatively long tails for most provinces. Regarding the release rates, the values for of pulverized combustion (PC), circulating fluidized bed (CFB), and grate boiler reach 98.7, 98.4, and 95.9 %,
5
respectively, indicating that most Hg in coal is emitted into the flue gas due to the high combustion temperature (see details in Table S1 in the Supplement). Since current available measurements are not sufficient for data fitting to determine the uncertainty, triangular distributions are assumed for the parameter, with 10 and 90 % percentiles as the lowest and highest investigated values from measurements, respectively.
10
As the main emission control target since 2005, the use of advanced APCD has increased fast in coal-fired power sector. The penetration rates of FGD and SCR sys-tems, for example, reached 90 and 27 % respectively in 2012. Those technologies are confirmed to result in lower Hg emission factors and thereby side benefits of Hg removal (Wang et al., 2012). In this work, the removal efficiencies of major types of
15
APCDs including ESP, FF, ESP+FGD, SCR+ESP+FGD, are analyzed combining most recent field measurements for China’s power plants (see details in Table S2 in the Supplement). As shown in Fig. 2, the system of SCR+ESP+FGD has the highest Hg removal efficiency at 76.6 %, followed by FF at 56.1 % and ESP+FGD at 53.8 %. Large variations of Hg removal efficiencies of APCDs are indicated by different studies, and
20
the values estimated and applied in this work are relatively conservative, particularly for ESP+FGD, currently the dominating APCD for power sector. In addition, the re-moval efficiencies are much lower than those from developed countries like US and Japan. Part of reasons could be the large difference in coal quality between countries and poorer running conditions of APCD in China (Li, 2011; Zhi et al., 2013). For other
25
uncer-ACPD
14, 26803–26855, 2014The effects of China’s pollution control on
atmospheric Hg emissions
Y. Zhao et al.
Title Page
Abstract Introduction
Conclusions References
Tables Figures
◭ ◮
◭ ◮
Back Close
Full Screen / Esc
Printer-friendly Version
Interactive Discussion
Discussion
P
a
per
|
Discus
sion
P
a
per
|
Discussion
P
a
per
|
Discussion
P
a
per
|
tainty since the capacity share of units with WET or CYC is small, e.g., at roughly 2 % in 2010. Regarding the possibility of further improvement on Hg emission control in the future, new-built power units are assumed to apply the powdered activated carbon (PAC) injection technology (Srivastava et al., 2006; Cui et al., 2011) or modified cat-alytic oxidation of elemental Hg (Guo et al., 2011; Yan et al., 2011) in S2, and average
5
Hg removal efficiencies of those technologies are expected to reach 90 %. The PDF of removal efficiencies by device are estimated following the instruction described in Sect. 2.3. In most cases, the PDFs are assumed to be Weibull distribution due to insuf-ficient data samples. For ESP, however, the data from current available measurements passed the statistical test and bootstrap simulation is applied to determine its PDF as
10
normal distribution, as shown in Fig. 3a.
Attributed mainly to the distinctly growing use of APCD, the average Hg emission factor for power plants is estimated to decrease 0.13 in 2005 to 0.08 g (t-coal)−1 in 2012, as shown in Fig. 1a. With PAC injection applied in S2 in the future, the average emission factor would further decrease to 0.05 g (t-coal)−1in 2030.
15
3.1.2 Iron and steel production
In previous studies, a uniform emission factor of 0.04 g (t-steel)−1 is generally ap-plied for iron and steel production, with little consideration of technology improvement (Streets et al., 2005; Wu et al., 2006). In this work, as described in Sect. 2.2, latest information on APCD penetration trends and removal efficiencies is combined and Hg
20
emissions are calculated separately for each coal-consuming process with Eq. (3), and then aggregated to the sector level. The Hg release ratios of coking and pig iron pro-duction are estimated at 63 and 84 %, respectively (Wang et al., 2000; Hong et al., 2004), with uniform distributions conservatively determined for lack of updated results from measurements. Without specific information, the removal efficiencies with PDF for
25
ACPD
14, 26803–26855, 2014The effects of China’s pollution control on
atmospheric Hg emissions
Y. Zhao et al.
Title Page
Abstract Introduction
Conclusions References
Tables Figures
◭ ◮
◭ ◮
Back Close
Full Screen / Esc
Printer-friendly Version
Interactive Discussion
Discussion
P
a
per
|
Discus
sion
P
a
per
|
Discussion
P
a
per
|
Discussion
P
a
per
that possible underestimate could be partly quantified by uncertainty analysis, more investigation on APCD benefits on Hg removal for sectors other than power plants are further needed.
Driven by the increased penetration of advanced manufacturing and emission con-trol technologies, in particular, the growth of machinery coking, the emission factor is
5
estimated to have declined from 0.071 to 0.039 g (t-steel)−1 from 2005 to 2012, indi-cating that the application of 0.04 g (t-steel)−1 might underestimate the emissions for the sector previous years (Fig. 1b). Regarding the future projection, the ratio of pig iron to steel is assumed to decrease from 92 % in 2012 to 80 % in the S2, 2030, due to expanding use of electric arc furnaces that apply more waste steel inputs instead of
10
more energy-intensive inputs including pig iron (Wang et al., 2007; Zhao et al., 2012). The emission factor would thus further reduce to 0.035 g (t-steel)−1.
3.1.3 Non-ferrous metal smelting
Although non-ferrous metal industry including Pb, Zn and Cu smelting is estimated as one of the main sources of Hg emissions (Li et al., 2010; Wu et al., 2012), the
avail-15
able emission factors from field tests are still limited, given the multiple and complex factors that are influential in emission levels (e.g., the Hg concentration in ore concen-trate, smelting technology, the penetration of acid plants and APCDs). Based on those limited data, a process-based methodology is developed and applied in this work to es-timate the emission factors for various kinds of smelters employed in China, as shown
20
in Table S3 in the Supplement. All the processes and their corresponding emission factors are obtained from field measurements (Feng et al., 2004; G. Li et al., 2009; Li et al., 2010; Wang et al., 2010; Zhang et al., 2012b) or field-based calculation (Wu et al., 2012). In particular, oxygen pressure leaching process for Zinc smelting has not been included in the table, because it does not include the process of high temperature
25
ACPD
14, 26803–26855, 2014The effects of China’s pollution control on
atmospheric Hg emissions
Y. Zhao et al.
Title Page
Abstract Introduction
Conclusions References
Tables Figures
◭ ◮
◭ ◮
Back Close
Full Screen / Esc
Printer-friendly Version
Interactive Discussion
Discussion
P
a
per
|
Discus
sion
P
a
per
|
Discussion
P
a
per
|
Discussion
P
a
per
|
90th percentiles set as the minimum and maximum values from field measurements, respectively.
Based on the plant-by-plant database (Wu et al., 2012) and the name list of small smelters that have been shut down since 2010, the penetrations of various kinds of smelters are calculated by year and non-ferrous metal type, and the inter-annual trends
5
of emission factors can then be analyzed. As shown in Fig. 1d–f, the national av-erage EFs for Zn, Pb and Cu smelting are estimated to drop from 15.5, 16.7, and 1.7 g (t-product)−1 in 2005 to 13.3, 4.7, and 0.2 g t−1 in 2012, respectively. In S2 for future projection, the EFs are predicted based on the assumption that the most ad-vanced technologies will compulsorily be applied for the new-built smelters. The EFs
10
for Zn and Pb are thus estimated to further reduce to 9.1 and 2.2 g (t-product)−1 in 2030, respectively.
3.1.4 Cement production
Series of studies have been conducted to measure the Hg emission levels of cement production (Li, 2011; Zhang, 2007). Based on the available data from those field tests
15
the emission factors are estimated at 0.008, 0.052 and 0.120 g (t-product)−1for cement kilns with FF, ESP, and WET dust collectors, respectively. The data sample for FF passed the statistical test and bootstrap simulation is applied to determine its PDF as Weibull distribution, as shown in Fig. 3b. For other dust collectors, however, the current data are limited and uniform distribution are used, with 10th and 90th percentiles set
20
as the minimum and maximum values from field measurements, respectively.
Combining the inter-annual trends of APCD penetration for the sector (Lei et al., 2011; Zhao et al., 2013), the national average of emission factor is estimated to de-cline from 0.06 in 2005 to 0.018 g t−1
in 2012 (Fig. 1c), resulting mainly from the sharp increase of precalciner kilns with FF. For the future, all the kilns other than precalciner
25
ACPD
14, 26803–26855, 2014The effects of China’s pollution control on
atmospheric Hg emissions
Y. Zhao et al.
Title Page
Abstract Introduction
Conclusions References
Tables Figures
◭ ◮
◭ ◮
Back Close
Full Screen / Esc
Printer-friendly Version
Interactive Discussion
Discussion
P
a
per
|
Discus
sion
P
a
per
|
Discussion
P
a
per
|
Discussion
P
a
per
0.008 g (t-product)−1for S0, S1 and S2 in 2030, respectively. Regarding the emissions from coal combustion in cement production, the Hg removal efficiencies for various APCDs are applied to generate the emission factors, and the national average value is estimated to be reduced from 0.11 to 0.08 g (t-coal)−1during 2005–2012. While no sig-nificant abatement is found for S0 and S1 after 2010, the emission factor would further
5
decrease to 0.04 g (t-coal)−1for S2, 2030, attributed to the growth of SCR application in the scenario.
3.1.5 Other industrial sources
Emission factors of industrial and heating boilers are estimated using Eq. (3). The Hg release ratios for grate boilers and CFB are estimated at 76 and 91 % based on limited
10
domestic measurements (Wang et al., 2000; Tang et al., 2004), lower than those for power plants. Uniform distributions are used to quantify the uncertainty of the param-eter. WET and CYC are the dominating types of dust collectors for boilers and their removal efficiencies with PDF are assumed to be the same as those for power plants. For S2 in the future, FGD are assumed to be used for the new-built boilers, leading to
15
larger fraction of Hg removal.
Production of polyvinyl chloride polymer (PVC) is a significant contributor to the Hg emission due to the widely using of mercuric chloride catalyst in the acetylene tech-nologies. The emission factor is calculated as the product of Hg content in PVC and its release ratio to atmosphere during the production process. In this work, the Hg content
20
in PVC is estimated to range 0.12–0.20 kg Hg (t-PVC)−1based on investigation by Hao et al. (2005) and the release ratio at 1 % according to THU (2009). For other processes including Hg mining, production of battery and fluorescent lamp, large-scale gold pro-duction, and oil/gas combustion, the emission factors from AP-42 (USEPA, 2002a) and previous inventory work (Streets et al., 2005) are used due to lack of updated
informa-25
ACPD
14, 26803–26855, 2014The effects of China’s pollution control on
atmospheric Hg emissions
Y. Zhao et al.
Title Page
Abstract Introduction
Conclusions References
Tables Figures
◭ ◮
◭ ◮
Back Close
Full Screen / Esc
Printer-friendly Version
Interactive Discussion
Discussion
P
a
per
|
Discus
sion
P
a
per
|
Discussion
P
a
per
|
Discussion
P
a
per
|
3.1.6 Residential sources
For residential coal consumption, the determination of Hg emission factors is similar as that for industrial boilers. Biomass combustion in this work includes crop residue (used as biofuel in household and as waste burned in open fields) and fuel wood (used for household). Domestic information and field measurements (Huang et al., 2011; Zhang
5
et al., 2013) are adopted in this work to estimate the emission factors, and uniform distributions are assumed reflecting the relatively big uncertainty. Based on domestic dataset, the average EFs for crop residue (16.7 ng g−1) and fuel wood (12.3 ng g−1) cal-culated in this work are lower than the values adopted in previous study (e.g., 37 ng g−1 for crop residues and 20 ng g−1for fuel wood, Streets et al., 2005).
10
Hg emissions from solid waste incineration (SWI) are estimated separately for mu-nicipal solid waste incineration (MSWI) and rural household waste incineration (RHWI) due to the different mercury content levels and burning methodologies. For MSWI, an emission factor of 0.22 g t−1 with Weibull distribution is evaluated with bootstrap sim-ulation based on domestic field tests by L. Chen et al. (2013) and Hu et al. (2012)
15
(Fig. 3c). The emission factor for RHWI is estimated as the product of Hg content and release ratio to atmosphere, which are obtained from Hu et al. (2012).
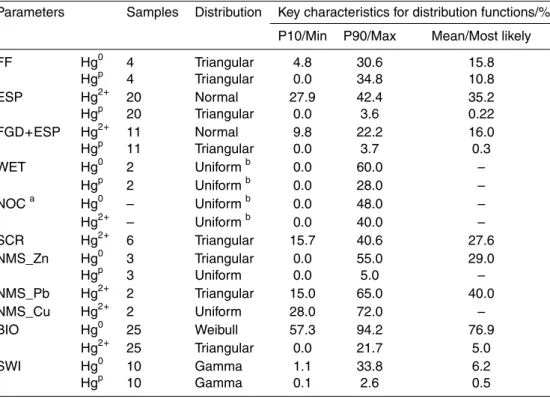
3.2 Speciation of Hg with probability distribution functions
Besides the total amount, the speciation of Hg emissions plays a crucial role in under-standing the transport and cycling of Hg since the activity of Hg depends significantly
20
on the chemical form. The fate of Hg (Hg0, Hg2+, and Hgp) released to atmosphere can be primarily affected by the fuel quality and the removal mechanisms of APCDs, and thereby varies largely among different emission sources. In this work, a thorough investigation on existing studies is conducted to compile a database of Hg speciation by sector and thus to provide the mass fractions of the three chemical forms of Hg
25
ACPD
14, 26803–26855, 2014The effects of China’s pollution control on
atmospheric Hg emissions
Y. Zhao et al.
Title Page
Abstract Introduction
Conclusions References
Tables Figures
◭ ◮
◭ ◮
Back Close
Full Screen / Esc
Printer-friendly Version
Interactive Discussion
Discussion
P
a
per
|
Discus
sion
P
a
per
|
Discussion
P
a
per
|
Discussion
P
a
per
application and data availability. In the first case, for sources whose emission factors are calculated with the removal efficiencies of different APCD considered (e.g., CPP, CEM, ISP, OIB and RC), the mass fractions are estimated based on the results from field measurements by APCD type. The second, for sources lack of sufficient mea-surement sample to determine emission factors by APCD type, the average values of
5
available field test results are calculated and applied as mass fraction of speciation for the sector (e.g., NMS, BIO and SWI). The third, for sources that very little domestic information can be found in speciation split, results from global studies (Pacyna and Pacyna, 2002) have to be used and little update is made compared to previous inven-tory work (Streets et al., 2005). Those sources mainly include industrial processes like
10
artisanal gold production, Hg mining, battery and fluorescent lamp production, etc. As shown in Table S4, the speciation split of total Hg varies largely among different types of APCD combination. For example, the average of Hg0mass fraction reaches 83 % for FGD+ESP, attributed to the relatively strong removal effects of the both APCDs on Hg2+ and Hgp. Once SCR applied, significant increase of Hg2+fraction is observed,
15
resulting mainly from the conversion of Hg0 to Hg2+ by SCR (Wang et al., 2010b). In general, oxidation of Hg0leads to higher removal of Hg since Hg2+ is more liable to be adsorbed, and use of advanced dust collectors leads to lower Hgpas most of them can be captured with particles.
For mass fraction data that pass the Kolmogorov–Smirnov test, bootstrap simulation
20
ACPD
14, 26803–26855, 2014The effects of China’s pollution control on
atmospheric Hg emissions
Y. Zhao et al.
Title Page
Abstract Introduction
Conclusions References
Tables Figures
◭ ◮
◭ ◮
Back Close
Full Screen / Esc
Printer-friendly Version
Interactive Discussion
Discussion
P
a
per
|
Discus
sion
P
a
per
|
Discussion
P
a
per
|
Discussion
P
a
per
|
4 Results and discussion
4.1 Historical trends in mercury emissions to the atmosphere
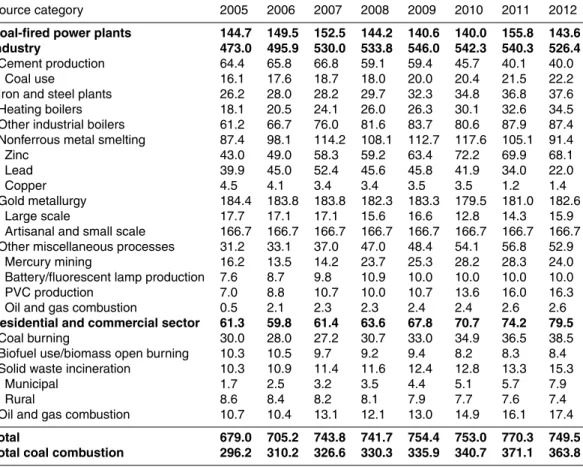
The national total emissions of anthropogenic Hg are estimated to increase from 679.0 metric tons (t) in 2005 to 749.8 t in 2012, with the peak at 770.6 t in 2011, as shown in Fig. 4. The annual growth rate of emissions can then be calculated at 2.1 % during
5
2005–2011, much lower than that of energy consumption (7.6 %) or economy of the country (>10 %). Although slight increase in emissions is evaluated for recent years, the inter-annual variation is much smaller than the estimated uncertainty of annual emissions (provided in Sect. 4.4). That indicates the constrained Hg emissions for the country since 2005, compared to relatively fast growth in early 2000s (e.g., 8 % of
an-10
nual growth of Hg emissions suggested by Wu et al., 2006 from 2000 to 2003). This trend, however, is currently difficult to be confirmed through field observations of at-mospheric ambient Hg in China, attributed mainly to lack of middle and long term Hg observation, either in polluted cities or background areas. Limited inter-annual results for background areas (Changbai Mountain in northeastern China) show reduced Hg
15
levels (Wan et al., 2009; Fu et al., 2012b). Those differences, however, are believed to come from changes in sampling location instead of in emissions (personal com-munication with X. Fu from Institute of Geochemistry Chinese Academy of Sciences, 2014). Tightened air pollution control in China, even not specifically for Hg, should be important reasons for the smooth emission trends, and it will be interpreted in details
20
in Sect. 4.2. The speciation of Hg emissions is relatively stable for recent years, with the mass fractions of around 55, 39 and 6 % for Hg0, Hg2+ and Hgp, respectively.
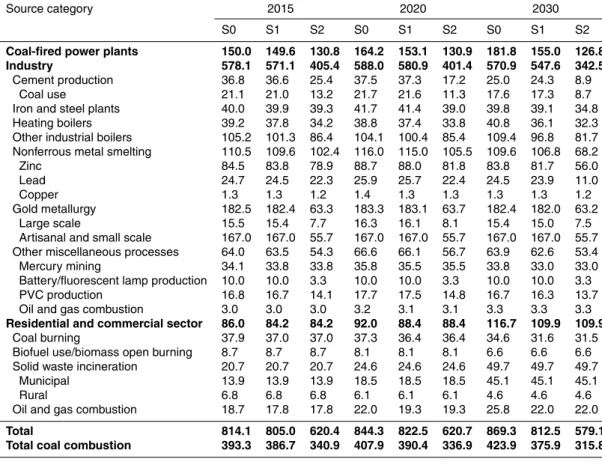
The annual emissions by sector are summarized in Table 3. Coal combustion, gold metallurgy and nonferrous metal smelting are the most significant Hg sources of an-thropogenic origin, accounting together for 85 % of national total emissions. Coal
com-25
ACPD
14, 26803–26855, 2014The effects of China’s pollution control on
atmospheric Hg emissions
Y. Zhao et al.
Title Page
Abstract Introduction
Conclusions References
Tables Figures
◭ ◮
◭ ◮
Back Close
Full Screen / Esc
Printer-friendly Version
Interactive Discussion
Discussion
P
a
per
|
Discus
sion
P
a
per
|
Discussion
P
a
per
|
Discussion
P
a
per
in 2012. This is mainly because the relatively constant emission levels are evaluated for gold metallurgy and nonferrous metal smelting sectors during the same period, result-ing from penetrations of newer and more advanced manufacturresult-ing technologies under the national policy of emission control. Emissions of Hg0, Hg2+ and Hgp are summa-rized by sector in Tables S5–S7 of the Supplement. For Hg0and Hg2+, the three biggest
5
sources are the same as those for total Hg emissions, i.e., coal combustion, gold met-allurgy and nonferrous metal smelting. For Hgp, coal combustion plays a dominant role to the emissions, with the share ranged 78–84 % for various years, since very few Hgp emissions are assumed from gold metallurgy, zinc and lead smelting in this work.
Provincial emissions with inter-annual variability are analyzed and illustrated in
10
Fig. 5. Attributed to unclear amount and spatial distribution, Hg emissions from ASGM are not included in the provincial analysis. While coal combustion is identified as the biggest source of atmospheric Hg for most provinces, relatively high emissions from non-combustion sources are estimated for several provinces including Hunan, Yunnan, Henan, Guangxi, Anhui, and Shaanxi, resulting mainly from the large production of Zn
15
and/or Pb in those regions. Clear difference in emission trends from 2005 to 2012 is found by region. In contrast to most provinces that have had their emissions increased, reduced emissions are prominently estimated for the three regions with largest den-sity of population, economy and pollution in China, i.e., Jing-Jin-Ji region (JJJ, includ-ing Beijinclud-ing, Tianjin and Hebei), Yangtze River Delta region (YRD, includinclud-ing Shanghai,
20
Jiangsu and Zhejiang), and Pearl River Delta region (PRD, including Guangdong). The share in Hg emissions of those 7 provinces is estimated to decline from 24 % in 2005 to 19 % in 2012, similar with other criterion air pollutants (Zhao et al., 2013). This deviation in emission trends, on one hand, indicates the slower increase in industry with heavy pollution and the progress of emission control in developed regions. On the other hand,
25
ACPD
14, 26803–26855, 2014The effects of China’s pollution control on
atmospheric Hg emissions
Y. Zhao et al.
Title Page
Abstract Introduction
Conclusions References
Tables Figures
◭ ◮
◭ ◮
Back Close
Full Screen / Esc
Printer-friendly Version
Interactive Discussion
Discussion
P
a
per
|
Discus
sion
P
a
per
|
Discussion
P
a
per
|
Discussion
P
a
per
|
4.2 Implication of emission control on national Hg emissions
Instead of keeping fast increasing driven by the accelerated economic growth, China’s Hg emissions of anthropogenic origin have been efficiently restrained since 2005, in-dicating the success of national strategies on the Hg emission control. Contributing together to this apparent national trend, the emission trends by sector, however, vary
5
greatly attributing to different driven factors and uneven control policies. Detailed analy-sis is thus conducted to explore the sources dominating the Hg emission trends. Due to lack of accurate information, high uncertainty exists in the estimation of emissions from ASGM, and its annual emission level is unchanged over-time in this work. Although rec-ognized as the biggest contributor to total Hg emissions among all the single sources
10
(Table 3), ASGM is not included here as a type of source that has direct effects on the national emission trend.
Therefore, we divide the rest anthropogenic sources into three categories, as indi-cated in Fig. 6a. The first category includes sectors for which uniform and unchanged emission factors are applied through the sector over-time (i.e., OMP, BIO, SWI and
15
large scale gold metallurgy). The inter-annual variability of Hg emissions from those sources are thereby only affected by the changes of activity levels, and the annual emissions for category-1 sectors have been keeping increasing from 80.3 in 2005 to 109.8 t in 2012. Due to their relatively small fraction to the total anthropogenic emis-sions (<15 %), however, the category-1 sectors have little influence on the trend of
20
national total emissions that shows much slower growth with even declined emissions for a few years, as shown in Fig. 6a. The second category consists of coal combustion for heating (HB), other industrial boilers (OIB) and residential use (RC and ROG), for which the emission factors are region-dependent, with little inter-annual variation due to very limited pollution control measures implemented. Hg emission trend of those
25
ACPD
14, 26803–26855, 2014The effects of China’s pollution control on
atmospheric Hg emissions
Y. Zhao et al.
Title Page
Abstract Introduction
Conclusions References
Tables Figures
◭ ◮
◭ ◮
Back Close
Full Screen / Esc
Printer-friendly Version
Interactive Discussion
Discussion
P
a
per
|
Discus
sion
P
a
per
|
Discussion
P
a
per
|
Discussion
P
a
per
and nonferrous metal smelting (NMS). Although the activity levels (i.e., coal consump-tion and industrial producconsump-tion) increased for those sources similar as category-1 and -2 sectors, Hg emission trends of category-3 sectors are dominated by the co-effects of emission control on criteria air pollutants through increased use of APCD and improved manufacturing technologies. The emissions of the sectors are estimated to reach peak
5
at 362 t in 2007 and then to be reduced to 313 t in 2012, largely offsetting the increase in emissions from the above two categories and playing a crucial role in constraining the national total emissions.
Figure 6b compares the trends of activity levels and Hg emissions for category-3 sec-tors from 2005 to 2012. During the period, coal consumption of coal-fired power plants,
10
cement production, steel production and nonferrous metal production increased by 70, 107, 158 and 104 % respectively. A leveling off in 2008 was found for industrial pro-duction, attributed mainly to the production limitation imposed for the Beijing Olympics and to the economic recession at the end of 2008. However, the economy activities increased sharply again under a major economic stimulus policy to respond to the
15
recession, and the energy and industrial production keep fast growing in the follow-ing years. In contrast to the large growth of activity levels, the Hg emissions from the four sectors are clearly constrained to varying degrees: those from CEM decreased by 38 %, those from CPP and NMS in 2012 dropped to the levels in 2005, and those from ISP increased by 44 %, far less than growth of steel production. As described
20
in Sect. 3, the reduced emission factors through the period are the main reasons for the emission abatement, attributed to the replacement of old and small plants or kilns with those with advanced control technologies and high combustion efficiencies. The increased penetrations of FGD and SCR in CPP, precalciner kilns with FF in CEM, ma-chinery coking with ESP in coking, and improved manufacturing technologies in NMS
25
sec-ACPD
14, 26803–26855, 2014The effects of China’s pollution control on
atmospheric Hg emissions
Y. Zhao et al.
Title Page
Abstract Introduction
Conclusions References
Tables Figures
◭ ◮
◭ ◮
Back Close
Full Screen / Esc
Printer-friendly Version
Interactive Discussion
Discussion
P
a
per
|
Discus
sion
P
a
per
|
Discussion
P
a
per
|
Discussion
P
a
per
|
tors since 2005. Without the controls, the Hg emissions of those sectors in 2012 would then exceed 600 t, almost doubling the current estimate. It can thus be confirmed that China’s pollution controls in power and certain industrial sectors have greatly slowed down the national Hg emissions.
4.3 Evaluation on reliability of the estimated emissions against other studies
5
The estimated China’s total Hg emissions in this work can hardly be compared di-rectly with other studies for two main reasons: (1) very few studies were conducted on China’s national total Hg emissions for continuous years after 2005, the period with dramatic changes in emission controls across the country; and (2) the sectors and sources of anthropogenic Hg emissions concerned are not completely the same
be-10
tween different emission inventories. Wu et al. (2006) estimated China’s Hg emissions at 696 t in 2003, slightly larger than our estimate for 2005. Given the fast growth of economy and energy use for the following years, our study thus yields lower estimates for China’s Hg emissions once the benefits of emission controls are included in the analysis. This revision is supported by chemistry simulation that overestimated the
am-15
bient Hg concentrations based on previous inventory studies (personal communication with H. Zhang from Institute of Geochemistry Chinese Academy of Sciences, and L. Wang from Tsinghua University, 2014). A more recent study evaluated the emissions of China’s anthropogenic Hg at 643 t for 2007, roughly 100 t smaller than our estimate (Wang et al., 2014). Compared with observations, however, lower levels of ambient
20
total Hg or Hg0 were generally simulated through GEOS-Chem based on the calcu-lated emissions for background/rural sites, indicating a possible underestimate of Hg emissions (Wang et al., 2014). The results of speciation analysis are similar between Wu et al. (2006) and this work, with slightly larger mass fraction of Hgp (12 vs. 6 %) but smaller for Hg2+ (32 vs. 39 %) by Wu et al. This is probably attributed to oxidation
25
ACPD
14, 26803–26855, 2014The effects of China’s pollution control on
atmospheric Hg emissions
Y. Zhao et al.
Title Page
Abstract Introduction
Conclusions References
Tables Figures
◭ ◮
◭ ◮
Back Close
Full Screen / Esc
Printer-friendly Version
Interactive Discussion
Discussion
P
a
per
|
Discus
sion
P
a
per
|
Discussion
P
a
per
|
Discussion
P
a
per
For coal combustion sources as a whole, Tian et al. (2010) calculated the Hg emis-sions at 284 and 306 t for 2005 and 2007, respectively, close to our estimate. In par-ticular, Hg emissions from CPP during 2005–2010 have been evaluated by several studies. Streets et al. (2009b) calculated the emissions for 2005 at 125 t, while Tian et al. (2012) estimated the annual emissions during 2005–2007 ranged 135–139 t, with
5
little inter-annual variability. Those estimates are somewhat lower than our results. Al-though the differences could be attributed to many factors including discrepancies in depth of details in boiler technologies and data sources of Hg content in coals, the conservative removal efficiencies of APCDs for Hg evaluated and applied in this work (as shown in Fig. 2) are believed to be the most important reason responsible for the
10
higher estimate of Hg emissions. Wang et al. (2010c) estimated that Hg emissions from CPP would reach 155 t in 2010, larger than our results. However, the energy data and penetrations of APCDs (especially FGD) in Wang et al. (2010c) were not from actual statistics but prediction based on Zhao et al. (2008), as the actual data for 2010 were unavailable when the study was conducted. The larger annual coal consumption by
15
CPP (1735 million metric tons in the study vs. 1576 in actual facts) and lower pene-trations of FGD (70 % in the study vs. 86 % in actual facts) than the actual facts would lead to a possible overestimate of Hg emissions for the sector. Compared with all those studies, therefore, the relatively low emissions of national total Hg in this work could probably not be attributed to underestimate of emissions from CPP but to improved
20
estimates for certain other sources as described below.
For NMS, constant emission factors were commonly used in previous inventories attributed to lack of detailed analysis on the trends of manufacturing technology pene-trations and thereby the synergic effects of Hg emission mitigation. Feng et al. (2009) evaluated that the emission factors of NMS in China could reach 155 g (t-Zn)−1,
25
ACPD
14, 26803–26855, 2014The effects of China’s pollution control on
atmospheric Hg emissions
Y. Zhao et al.
Title Page
Abstract Introduction
Conclusions References
Tables Figures
◭ ◮
◭ ◮
Back Close
Full Screen / Esc
Printer-friendly Version
Interactive Discussion
Discussion
P
a
per
|
Discus
sion
P
a
per
|
Discussion
P
a
per
|
Discussion
P
a
per
|
Hg emissions from NPS in 2012 would then be calculated at 672 and 80 t, i.e., 635 % larger and 12 % lower than this work, respectively. The big gaps between different stud-ies, as indicated in Fig. 8a, reveal the importance of better tracking the inter-annual trends of emission factors for the sector. Based on a detailed survey on individual smelting plants, a more recent study by Wu et al. (2012) developed a
technology-5
based methodology with consideration of smelting processes, mercury concentration in concentrates, and mercury removal efficiencies APCDs. They calculated the emis-sions declining from 87 in 2005 to 72 t in 2010, more consistent with our study than those using constant emission factors.
For ISP and CEM, emission factors in previous inventories were mainly
ob-10
tained from Pacyna and Pacyna (2002) and Streets et al. (2005), respectively, i.e., 0.04 g (t-product)−1. With these uniform emission factors adopted, Hg emissions from the two sectors during 2005–2012 would be evaluated to keep increasing from 15 to 38 and 43 to 88 t, respectively, as shown in Fig. 8b and c. This would definitely ig-nore the effects of improved manufacturing technologies and increased use of APCDs
15
on emission growth constraint, and would potentially overestimate the emissions par-ticularly for the most recent years. For MSWI, the emission factor of 2.8 g t−1
from UNECE/EMEP (2004) was widely accepted in previous inventories. Series of domestic field measurements, however, suggested a much smaller values of 0.22 g t−1for China (L. Chen et al., 2013; Hu et al., 2012), and lower emissions are estimated in this work
20
(Fig. 8d). Given the swift growth of solid wastes for the country, more field tests on both municipal and rural solid waste burning plants are thus imperative to confirm the levels of emission factors and to reduce the uncertainty of Hg emission estimate.
4.4 Uncertainties of national emission inventory
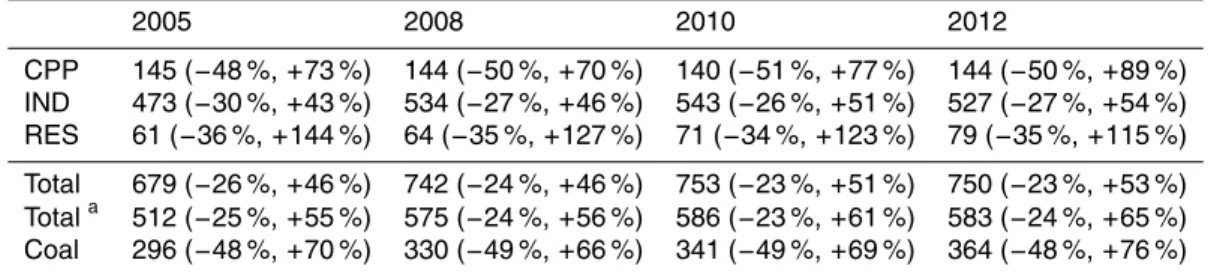
The uncertainties of anthropogenic Hg emissions in China for 2005–2012 are
quan-25
ACPD
14, 26803–26855, 2014The effects of China’s pollution control on
atmospheric Hg emissions
Y. Zhao et al.
Title Page
Abstract Introduction
Conclusions References
Tables Figures
◭ ◮
◭ ◮
Back Close
Full Screen / Esc
Printer-friendly Version
Interactive Discussion
Discussion
P
a
per
|
Discus
sion
P
a
per
|
Discussion
P
a
per
|
Discussion
P
a
per
−49∼+69 % (95 % CI), respectively. Since the annual emissions with uncertainties from ASGM are assumed unchanged during the period and thus bear large subjectiv-ity, the uncertainties of anthropogenic Hg emissions without ASGM is further calculated at−23∼+61 % (95 % CI). The uncertainties of current Hg emission inventory are be-lieved to be partly responsible for the difference in ambient Hg levels from observation
5
and model simulation (e.g., 0–50 % difference suggested by Wang et al., 2014). Larger uncertainties are found for Hg species than total Hg, e.g., the uncertainties of Hg0, Hg2+ and Hgpare evaluated at−31∼+58,−32∼+69 %, and −51∼+114 % (95 % CIs) for 2010, respectively (not shown in the table). Among the three sectors (CPP, IND, and RES), the uncertainties of IND are relatively small. However, it does not imply that the
10
emission characteristics of IND are well understood but results from the aggregation of the uncertainties of all industrial sources and thus cannot reflect larger uncertainties for certain sources.
Figure 9 illustrates the emission uncertainties by source for different Hg species in 2010. For all species, biomass burning (BIO), solid waste incineration (SWI) and
res-15
idential oil and gas burning (ROG) are the sources with the largest estimated relative variations to central estimate (i.e., 95 % CIs expressed in percentages), attributed to limited field measurements on those sources. Nevertheless, some certain industrial sources, even with less relative variations, are identified as well to be crucial to uncer-tainties of national Hg emissions, because of their large fractions to total emissions.
20
Those sources include coal-fired power plants (CPP) for Hg0, nonferrous metal smelt-ing (NMS) and gold metallurgy (GM) for Hg0 and Hg2+, and industrial and residential coal burning (OIB and RC) for Hgp.
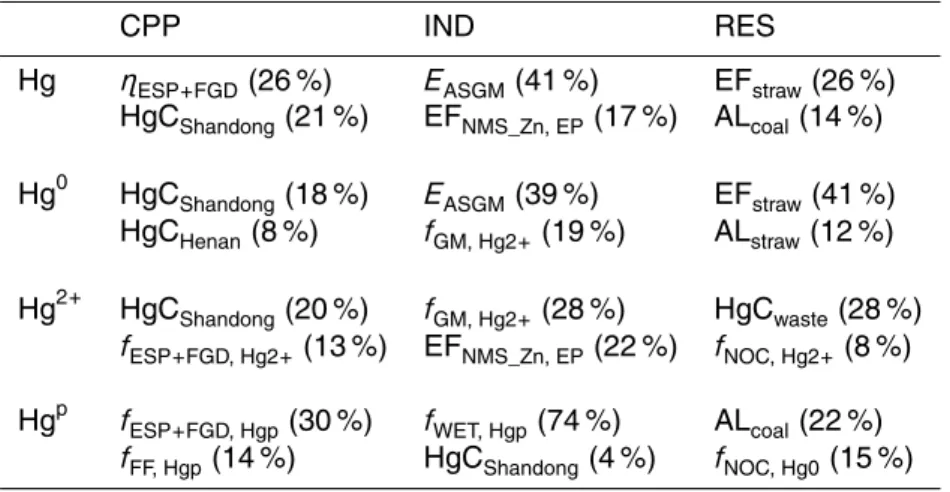
Table 5 summarizes the parameters that are most significant in determining the un-certainties of emissions according to their contribution to the variance of emissions. In
25
ACPD
14, 26803–26855, 2014The effects of China’s pollution control on
atmospheric Hg emissions
Y. Zhao et al.
Title Page
Abstract Introduction
Conclusions References
Tables Figures
◭ ◮
◭ ◮
Back Close
Full Screen / Esc
Printer-friendly Version
Interactive Discussion
Discussion
P
a
per
|
Discus
sion
P
a
per
|
Discussion
P
a
per
|
Discussion
P
a
per
|
of burned coal and biomass are found important specifically for emissions of residen-tial sector. For Hg speciation, the mass fractions of different species for various APCDs and gold metallurgy are identified as key parameters to the bigger uncertainties than total Hg, implying the necessity of further domestic studies.
Attributed to inclusion of more results of recent measurements on emission factors,
5
uncertainty of CPP for 2005 quantified in this work was lower than that for 2003 by Wu et al. (2003), expressed as 80 % CI. It can be seen from Table 4, however, that the uncertainties of emissions from CPP increased from 2005 to 2012. This results mainly from the fast increased penetration of FGD systems after 2005 and that of SCR after 2010, of which the co-effects of Hg control varied significantly among measured plants.
10
In past years, the installed FGD systems are not believed to be fully operated for run-ning cost saving, and big discrepancies in SO2 removal efficiencies exist across the country (Xu, 2011; Zhao et al., 2013, 2014). The unclear operation of FGD leads to big ranges of Hg removal efficiencies of the systems and thus enhances the uncertainties of emission estimate, as FGD gradually dominates the sector. Besides, the Hg removal
15
effects of SCR are still poorly quantified, and the uncertainties of Hg emissions are fur-ther elevated for most recent years since China is currently undergoing the NOxcontrol through broad use of SCR (Zhao et al., 2014). As shown in Fig. 10, the contribution of Hg removal efficiency of FGD to variance of CPP emissions increased from 0 % in 2005 to 26 % in 2010, and it has been the most important parameter contributing to
20
the uncertainty of CPP emissions since 2009. In 2012, Hg removal efficiencies of FGD and SCR are estimated to contribute together 37 % of the uncertainty of Hg emissions. The emission uncertainties of given industrial sources increased recently for simi-lar reasons. The uncertainty of Hg emissions from NMS, for example, increased from −46∼+116 % in 2005 to−45∼+169 % in 2012. It is attributed mainly to the increase
25