E
NERGY AND
E
NVIRONMENT
Volume 1, Issue 1, 2010 pp.161-176
Journal homepage: www.IJEE.IEEFoundation.org
China's regional carbon emissions change over 1997-2007
Lan-Cui Liu
1, Jin-Nan Wang
1, Gang Wu
2, 3, Yi-Ming Wei
2,31 Center for Climate and Environmental Policy, Chinese Academy of Environmental Planning, Ministry
of Environmental Protection of the People’s Republic of China, Beijing 100012, China.
2 School of Management and Economics, Beijing Institute of Technology, Beijing, 100081, China. 3 Center for Energy and Environmental Policy Research, Beijing Institute of Technology, Beijing,
100081, China.
Abstract
The increased demand for energy in China has generated concomitant increase of carbon emissions, which poses an unprecedented challenge to China’s, and even global, sustainable development. In this paper, from the perspective of provincial carbon emissions, we analyze China’s carbon emissions changes during 1997-2007 based on the index decomposition analysis method. We find that: (1) China's CO2 emissions from end-use energy consumption mainly originated from such major industrial provinces
as Hebei, Jiangsu, Zhejiang, Shandong, Henan and Guangdong. (2) Economic growth and decline in energy intensity will have the greatest impact on CO2 emissions from end-use energy consumption.
Economic growth is the key factor driving the increase of CO2 emissions. Change in energy intensity can
more or less decrease CO2 emissions. In the future, China’s carbon emissions mitigation policies should
be developed to address these differences in provincial carbon emissions.
Copyright © 2010 International Energy and Environment Foundation - All rights reserved.
Keywords: Carbon intensity, Climate change, Provincial carbon emissions.
1. Introduction
Next to the United States, China is the greatest source of greenhouse gas emissions in the world, and has been one of bigger contributors to the rapid growth of global CO2 emissions in recent years, accounting
for 44% of the increase in global CO2 emissions in 1990–2004 [1]. Moreover, in the very short period
2002 – 2007, China’s CO2 emissions almost doubled as its economy continued to expand rapidly, with
carbon intensity presenting an upward trend.
To understand the evolution of Chinese CO2 emissions, many studies have used the index decomposition
analysis (IDA) method to analyze China’s national carbon emissions and carbon intensity change (e.g. [2-7].
Wu et al. [2] argued that the rate of decline in energy intensity and slowdown in growth of average labor productivity in the industrial sectors were the dominant contributors to the sudden changes in energy-related CO2 emissions in the period 1996-1999. Wu et al. [3] used the Log-mean Divisia Index (LMDI)
method to study CO2 emissions from 1980-2002, and concluded that before 1996, economic scale, fuel
mix and energy intensity on the energy-demand side mainly drove the changes in China’s CO2 emissions,
CO2 emissions related to the total primary energy supply. Wang et al. [4] concluded, based on the LMDI
method, that the total theoretical decrease of CO2 emissions was 2466 MtC during 1957-2000, of which
about 95% of the total decrease could be attributed to energy intensity decline, and only 1.6% and 3.2% to fossil fuel mix and renewable energy penetration, respectively. Fan et al. [5] show that industry structure partly offset the decline over the period 1987-2002, and the change in final-energy-mix partly offset the decline in carbon intensity over the period 1981-2002, suggesting that final-energy use in the material production sectors and development of the material production sectors became carbon-intensive. Therefore, further decline in carbon intensity should focus on the material production sectors’ final-energy use, especially the industrial sectors. Liu et al. [6] analyzed the industrial carbon emissions changes, finding that raw chemical materials and chemical products, nonmetal mineral products and smelting and pressing of ferrous metals accounted for 59.31% of total increase of industrial CO2
emissions. Therefore, the overwhelming contributors to the change in China’s industrial sectors’ carbon emissions in the period 1998-2005 were industrial activity and energy intensity. The impact of the emissions coefficients of heat and electricity, and fuel and structural shifts was relatively small. Zhang et al.[7] analyze the nature of the factors that influence the changes in energy- related CO2 emission and
CO2 emission intensity during the period 1991–2006, and find that: energy intensity effect is confirmed
as the dominant contributor to the decline in CO2 emission and CO2 emission intensity, and economic
activity is the most important contributor to increased CO2 emission.
These aforementioned studies show that China’s economic growth and energy intensity are two important and key factors to effect the change of China’s carbon emissions or carbon intensity, and the impacts of other factors (fuel mix, economic structure and carbon coefficient) are relative less, but their impact can not be ignored. However, all these studies focus on the analysis of national carbon emissions, and there have been no systematic empirical studies on the analysis of provincial CO2 emissions, in
particular, how they have changed over time. An exception is Auffhammer and Carson [8], who forecast China’s carbon emissions based on provincial carbon emissions.
For China, there exist obvious differences in economic growth, size, population, energy use and energy efficiency across provinces, and some key indicators in every province were shown in Appendix A, which have led to great differences in energy consumption, mix and carbon emissions. This raises the following questions: (1) Which provinces are mainly responsible for China’s total carbon emissions? (2) What are the provincial characteristics of per capita CO2 emissions? (3) What are the differences in
provincial CO2 emission intensity? (4) Which factors have an important role in the change of provincial
CO2 emissions? All these questions are important for China’s policy makers to understand more about
the characteristics of provincial carbon emissions to draw up specific climate policies decisions. Consequently, this paper analyzes China’s provincial CO2 emission change over the period 1997-2007
aiming to provide answers.
The article is organized as follows. Section 2 describes the LMDI method and the data used. Section 3 presents the provincial carbon emissions characteristics. Section 4 shows the impact of different factors on the changes of provincial CO2 emission based on LMDI. The final section presents the conclusions
and offers some policy implications.
2. Data source and methodology
2.1 The source of China’s regional carbon emissions
In this paper, China’s regional carbon emissions are calculated based on the Sectoral Approach recommended by IPCC, which was shown in the Eq. (1):
∑
∑
=
×
×
×
=
ij
ij j j j ij
ij
EF
O
E
C
C
δ
(1)where, C is CO2 emissions from end-use energy consumption of 28 provinces;
i
refers to the 28provinces (excluding Hainan, Ningxia, Taiwan and Tibet);
j
refers to different energy types;C
ij is CO2emissions from energy
j
in provincei
;δ
j is conversion factor of energyj
from tons to TJ;EF
j iscarbon emissions factor of energy
j
, the unit is tC/TJ;O
j is the fraction of carbon oxidized of energyThe fraction of carbon oxidized and carbon emissions factor of different type of energy excluding electricity and heat come from IEA [9]. The conversion factor of energy
j
from tons to TJ comes from China Energy Statistical Yearbooks 2008 [12].The carbon emissions from thermal power generation and heat industry are calculated by their fossil energy use input, the fraction of carbon oxidized and their carbon emissions factor. Then we can get the carbon coefficient of total electricity including thermal power, hydro, nuclear and other renewable electricity and heat.
2.2 Decomposition method of China's provincial CO2 emissions
Researchers and policy makers use various decomposition methods to quantify the impact of different factors on the change in energy consumption and CO2 emissions. However, there is no consensus among
them as to which is the most appropriate decomposition method. Ang [10] compared various index decomposition analyses, and concluded that the LMDI method is the preferred method due to its theoretical foundation, adaptability, ease of use and interpretation of results, among other desirable properties in the context of decomposition analysis.
In order to identify key factors affecting the change of provincial CO2 emissions, we adopted the LMDI
method to decompose CO2 emissions related to end-use energy consumption of material production
sectors into economic growth, economic structure, energy intensity and CO2 emission coefficients, as
indicated in Eq. (2).
∑
∑
∑
= ==
ik ik
ik ik ik i ik
ik ik ik i ik i ik
ik
m QS I R
E C Q E Q Q Q C
C (2)
where,
C
mis CO2 emissions from end-use energy consumption of material production sectors of 28provinces;
C
ikis CO2 emissions from end-use energy consumption of sector k in provincei
;Q
ik isvalue-added of sector k in province
i
;Q
i is sum of value-added in provincei
;E
ik is the end-useenergy consumption of sector k in province
i
;R
ik is the CO2 emissions coefficient of end-use energyconsumption of sector k in province
i
;S
ik is value-added share of sector k in provincei
; andI
ik is energy intensity of sector k in province i ; k refers to the sectors.Based on the energy balance table in China Energy Statistical Yearbooks, sectors are classified into the agricultural sector; industrial sector; construction, transport, storage, postal & telecommunications services; and wholesale, retail trade & catering services; residential consumption and others. In general, agricultural sector is defined as Primary industry, industry and construction are defined as Secondary industry, and transport, storage, postal & telecommunications services, and wholesale, retail trade & catering services are defined as Tertiary industry. Primary industry, Secondary industry and Tertiary industry are usually defined as the material production sectors. In China, three industries are very different in many aspects, such as energy use, economic growth etc, and economic structure adjustment addressed in national policies often refers to the adjustment of three industries. So we use three-sector decomposition method, i.e. primary industry, secondary industry and tertiary industry.
For detailed LMDI methodology, refer to the Ang [11].
2.3 Data
2.3.1 GDP data of every province
The provincial GDP and corresponding value-added data in every sector are derived from the China Statistical Yearbooks 1998-2008 [12-17]. All data are expressed to 2005 prices based on the value-added in the current prices and their growth rates.
2.3.2 The end-use energy consumption data
generation and heat industry also include the above energies excluding electricity and heat. All these data are derived from China Energy Statistical Yearbooks 1997-1999, 2005, 2006, 2007 and 2008 [12-17]. Since the China Energy Statistical Yearbook does not contain the energy consumption data of Taiwan, Tibet, and lack the energy use data of Ningxia in 2000, 2001, and 2002 and that of Hainan in 2002, so this paper does not include analysis of these four provinces in order to keep consistent discussions and interpretations.
3 Provincial carbon emissions in China
There are great differences in CO2 emissions related to end-use fossil fuel among provinces.
3.1 Provincial carbon emissions from 1997 to 2007
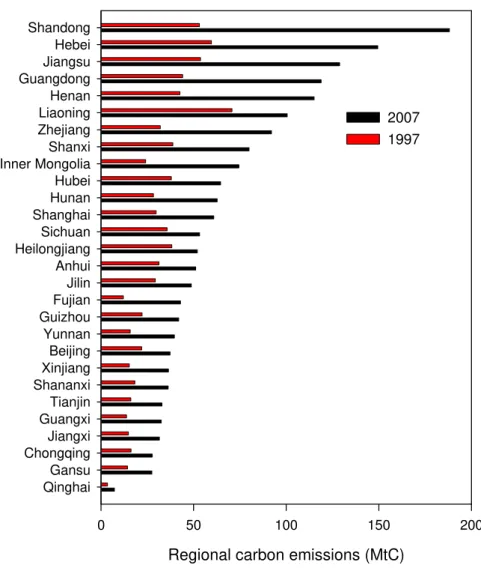
Total carbon emissions from end-use energy consumption (Carbon emissions in this section include material production sectors, urban and rural household, and other sectors.) are closely related to end-use energy consumption, energy mix and provincial economic growth. Figure 1 shows the provincial carbon emissions from end-use energy consumption in 1997 and 2007.
In 1997, the CO2 emissions of Liaoning, Hebei, Jiangsu, Shandong, Guangdong, Henan, Shanxi,
Heilongjiang and Hubei provinces accounted for 52.64% of total CO2 emissions related to total end-use
energy consumption of 28 provinces (excluding Hainan, Ningxia, Taiwan and Tibet owing to data unavailability). In 2007, the CO2 emissions of Shandong, Hebei, Jiangsu, Guangdong, Henan, Zhejiang,
Shanxi and Inner Mongolia accounted for 57.08%.
Regional carbon emissions (MtC)
0 50 100 150 200
Qinghai Gansu Chongqing Jiangxi Guangxi Tianjin Shananxi Xinjiang Beijing Yunnan Guizhou Fujian Jilin Anhui Heilongjiang Sichuan Shanghai Hunan Hubei Inner Mongolia Shanxi Zhejiang Liaoning Henan Guangdong Jiangsu Hebei Shandong
2007 1997
Figure 1. Provincial carbon emissions in 1997 and 2007
Furthermore, compared with 1997, the total CO2 emissions related to the end-use energy consumption of
Zhejiang provinces were characterized by the greatest increase, being 13.24%,8.82%,7.37%,7.34%
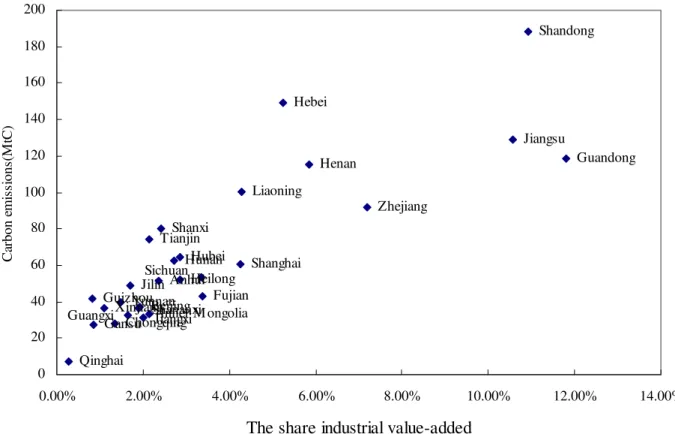
,7.11% and 5.89%, respectively, and accounting for 49.77% of the total emissions of 28 provinces. Variation in CO2 emission was closely related to economic development level, especially the industrial
development level, as shown in Figure 2.
BeijingInner M ongolia Gansu
Guizhou
Anhui Hunan
Yunnan Fujian Shanxi
Shandong
Guandong Jiangsu
Hebei
Henan
Zhejiang Liaoning
Qinghai
Shanghai Sichuan
Tianjin
Jilin
Hubei
ChongqingShananxi Xinjiang
Heilong
Guangxi Jiangxi
0 20 40 60 80 100 120 140 160 180 200
0.00% 2.00% 4.00% 6.00% 8.00% 10.00% 12.00% 14.00%
The share industrial value-added
Ca
rbon e
m
is
si
ons
(M
tC
)
Figure 2. Carbon emissions and the share of industrial value-added in 2007
Guangdong, Shandong, Jiangsu, Zhejiang, Henan and Hebei provinces are top 6 important industrial provinces, whose industrial value-added share in total industrial value-added were 51.59%. Industrial economic growth heavily depends on the demand for energy. This shows that China should pay more attention to their mitigation of CO2 emissions.
In China, carbon emissions from material production sectors can account for more than 80% of total emissions, which is closely related to China’s rapid industrializations. In 2007, China’s end-use energy from industrial sector was responsible for 70.45%. Carbon emissions from China’s urban and rural residential energy consumption was obviously less than material production sector because China’s urban and rural residents’ direct commercial energy use per capita was very lower, and up to 2007, 28,000 villages or 7 million families and 30 million rural people still had no power supply in China. In 2007 straw consumption for rural life was 159.79 Mtce and firewood was 92.91 Mtce, totally 252.70 Mtce, much higher than consumption of other commercial energy resources (in 2007 rural consumption of commercial energy resource for living was 100.19 Mtce). So it is necessary to pay more attention to emphasize China’s carbon emissions mitigation from material production sectors.
3.2 Provincial growth rate of carbon emissions from 1997 to 2007
Therefore, for major industrial provinces, total carbon emissions, growth and growth rates were all obvious than those of the other provinces. For China, CO2 emissions mitigation in these provinces
became the key.
3.3 Provincial CO2 emissions per capita from 1997 to 2007
CO2 emissions per capita can reflect the degree of equality in carbon emissions and energy use. The CO2
emissions per capita in 28 provinces increased from 0.69 tons of carbon in 1997 to 1.43 tons of carbon in 2007, representing an increase of 0.74 ton per capita. Compared with 1997, the CO2 emissions per capita
of every province increased more or less. The greatest increase was in Shandong, from 0.61 tons of carbon in 1997 to 2.01 tons of carbon in 2007, as shown in Figure 3.
The CO2 emissions per capita of Beijing, Shanxi, Inner Mongolia and Shanghai were more than 2.5 tons
per capita, while those of Anhui, Jiangxi, and Guangxi provinces were still lower than 0.85 ton per capita. For Fujian, Shandong, and Inner Mongolia, the growth rate of carbon emissions per capita from 1997 to 2007 also ranked the top 3 corresponding with the growth rate of total carbon emissions.
And the carbon emissions per capita in 15 provinces (Beijing, Tianjin, Hebei, Shanxi, Inner Mongolia, Liaoning, Jilin, Heilongjiang, Shanghai, Jiangsu, Zhejiang, Shandong, Xinjiang, Guangdong, Qinghai) in 2007 have been higher than the average level of the world in 2005 (the data of CDIAC shows that in 2005, the average level of the world was 1.23 t C/person), which means that it is necessary to consider specific carbon emissions mitigation policies for different provinces.
Carbon emissions per capita (tC/person)
0.0 .5 1.0 1.5 2.0 2.5 3.0 3.5 Beijing
Tianjin Hebei Shanxi Inner Mongolia Liaoning Jilin Heilongjiang Shanghai Jiangsu Zhejiang Anhui Fujian Jiangxi Shandong Henan Hubei Hunan Guangdong Guangxi Chongqing Sichuan Guizhou Yunnan Shananxi Gansu Qinghai Xinjiang
1997 2007
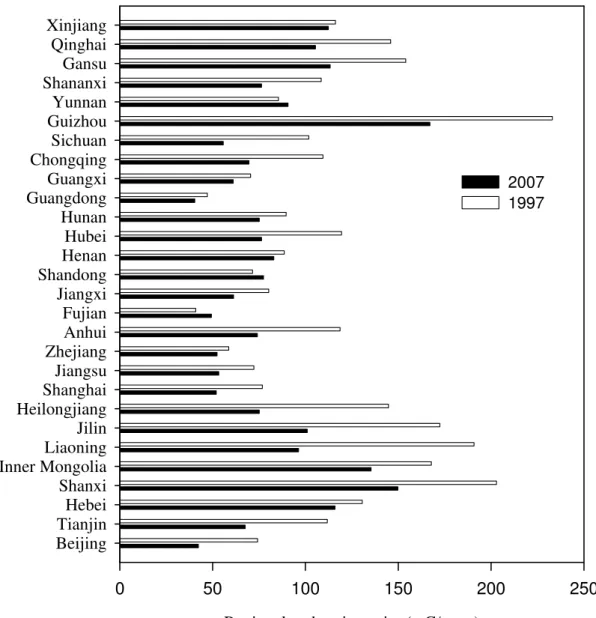
3.4 Provincial carbon intensity from 1997 to 2007
Carbon intensity is an important indicator widely used for international and provincial comparisons. Compared with 1997, the CO2 emission intensity declined in a majority of provinces in 2007 except for
Shandong, Yunnan, and Fujian. Significant drops of above 30% took place in Beijing, Tianjin, Liaoning, Jilin, Heilongjiang and Sichuan provinces. Liaoning Province had the greatest drop of 49.53%, as shown in Figure 4.
Regional carbon intensity (g C/yuan)
0 50 100 150 200 250
Beijing Tianjin Hebei Shanxi Inner Mongolia Liaoning Jilin Heilongjiang Shanghai Jiangsu Zhejiang Anhui Fujian Jiangxi Shandong Henan Hubei Hunan Guangdong Guangxi Chongqing Sichuan Guizhou Yunnan Shananxi Gansu Qinghai Xinjiang
2007 1997
Figure 4. Provincial carbon intensity in 1997 and 2007
The CO2 emission intensity was high in Shanxi, Inner Mongolia, Guizhou, Gansu, and Qinghai, being
even more than 100 gC/yuan in 2007. The highest CO2 emission intensity was in Guizhou, reaching
167.01 gC/yuan in 2007. The CO2 emission intensity of Beijing, Shanghai, and Guangdong provinces
was on the low side, lower than 60 gC/yuan in 2007. The lowest CO2 emission intensity was that of
Guangdong Province at only 40.44 gC/yuan. The difference in CO2 emission intensity is closely related
to the level of economic development and energy supply, as shown in Figure 5.
75.12Hubei Jiangxi
Henan
Sichuan
Liaoning
Shandong Yunanan
Qinghai
Guangdong Beijing
Gansu
Tianjin
Shanghai Inner M ogonglia
Shanxi Guizhou
Fujian Zhejiang Jiangsu Hebei
Jilin
Heilongjiang Hubei
Xinjiang
Chongqing Guangxi
Anhui
20.00 60.00 100.00 140.00 180.00
0 10000 20000 30000 40000 50000 60000 70000
GDP per capita (yuan)
Ca
rbo
n
i
n
te
ns
it
y
(gC
/y
u
an
)
Figure 5. Provincial carbon intensity and GDP per capita in 2007
The above analysis shows us that provincial carbon emissions have obvious characteristics, which can be found in Table 1.
The top five provinces by total carbon emissions from end-use energy consumption are the major industrial provinces with high industrial value-added share. Provinces with high carbon intensity are those with lower GDP per capita and less carbon emissions, and for them, developing economy and alleviating the poverty is first and foremost. So in the future, it is important for China to establish different policy measures to control carbon emissions of different regions.
To control the rapid growth of carbon emissions in Shandong, Hebei, Jiangsu, Guangdong and Henan provinces, we suggest that setting a target for carbon emissions growth in the future years. To minimize the mitigation cost, establishing a voluntary and incentive-based trading scheme may be useful at the basis of China Beijing Environment Exchange, Shanghai Environment and Energy Exchange and Tianjin Climate Exchange. In this market, the permitted allowance is the growth of carbon emissions, other than the absolute carbon emissions.
Table 1. Provincial carbon emissions in 2007
Indicator Top five provinces
Carbon emissions Shandong, Hebei, Jiangsu, Guangdong, Henan
Carbon emissions growth rate Fujian, Shandong, Inner Mongolia, Zhejiang, Henan Carbon emissions per capita Shanghai, Inner Mongolia, Tianjin, Shanxi, Beijing
Carbon intensity Guizhou, Shanxi, Inner Mongolia, Hebei, Gansu
For Guizhou, Shanxi, Inner Mongolia and Hebei provinces, regions with higher self-supply of coal, policy design should focus on mandatory measures to address energy intensity decline through production technology improvement, energy conservation management and energy efficiency enhancement in larger energy-intensive enterprises.
4. Empirical results and discussions
The above analysis shows that carbon emissions change in China varies across provinces. To identify which factors are driving the change in provincial carbon emissions, we analyzed China’s provincial CO2
emission changes of the material production sectors over the period 1997-2007 based on the LMDI method.
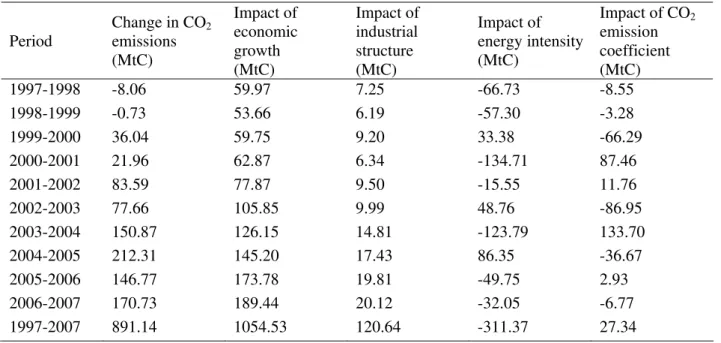
Table 2 shows that the acceleration of CO2 emissions of 28 provinces varied during 1997-2007. CO2
emissions grew the fastest during 2003-2007, accounting for 76.38% of the total growth during 1997-2007. Generally, changes in economic growth, industrial structure and CO2 emission coefficient resulted
in increase of CO2 emissions.
The growth of CO2 emissions during 1997-2007 was mainly driven by the economic growth of the
material production sector and change in industrial structure in 28 provinces. As a result of economic growth, CO2 emissions in the 28 provinces increased by 1054.53 MtC during 1997-2007. Meanwhile, the
increase in the proportion of the secondary industry in the economic structure also resulted in the growth of CO2 emissions by 120.64 MtC. The increase in carbonemission coefficients helped increase CO2
emissions by 27.34 MtC. However, the decline in energy intensity also resulted in the decrease of CO2
emissions by 311.37 MtC, almost equal to the sum of carbon emissions of Shandong and Jiangsu provinces. Therefore, China's CO2 emissions in 2007 from the end-use energy consumption of the
material production sectors of 28 provinces increased by 891.14 MtC over 1997.
Table 2. Impact of various factors on China's carbon emissions during 1997-2007
Period
Change in CO2
emissions (MtC)
Impact of economic growth (MtC)
Impact of industrial structure (MtC)
Impact of energy intensity (MtC)
Impact of CO2
emission coefficient (MtC)
1997-1998 -8.06 59.97 7.25 -66.73 -8.55
1998-1999 -0.73 53.66 6.19 -57.30 -3.28
1999-2000 36.04 59.75 9.20 33.38 -66.29
2000-2001 21.96 62.87 6.34 -134.71 87.46
2001-2002 83.59 77.87 9.50 -15.55 11.76
2002-2003 77.66 105.85 9.99 48.76 -86.95
2003-2004 150.87 126.15 14.81 -123.79 133.70
2004-2005 212.31 145.20 17.43 86.35 -36.67
2005-2006 146.77 173.78 19.81 -49.75 2.93
2006-2007 170.73 189.44 20.12 -32.05 -6.77
1997-2007 891.14 1054.53 120.64 -311.37 27.34
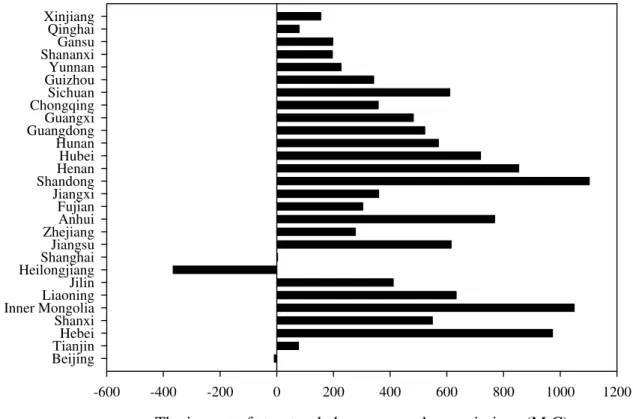
4.1 The impact of economic growth on carbon emissions
The rapid economic growth of the material production sector in each province was the major factor driving the increase of CO2 emissions year by year, as indicated in Table 2. Figure 6 shows the impact of
The impact of economic growth on carbon emissions(MtC)
0 2000 4000 6000 8000 10000 12000 Beijing
TianjinHebei Shanxi Inner MongoliaLiaoning Jilin HeilongjiangShanghai Jiangsu ZhejiangAnhui Fujian Jiangxi ShandongHenan Hubei Hunan GuangdongGuangxi ChongqingSichuan GuizhouYunnan ShananxiGansu Qinghai Xinjiang
Figure 6. The impact of economic growth on provincial carbon emissions
Figure 6 shows us that the economic growth in Hebei, Liaoning, Jiangsu, Shandong, and Guangdong provinces helped increase CO2 emissions by 83.32, 62.74, 83.38, 108.49, and 72.96 MtC, respectively
(410.88 MtC in total, accounting for 38.96% of the overall impact of economic growth on CO2
emissions). These provinces are not only the major provinces for energy consumption but also for booming economic growth, which contribute 39.33% to national GDP growth, proportional to their impact on carbon emissions. Therefore, the policy makers of these provinces face the challenge of how to coordinate between economic growth and the reduction in CO2 emissions.
Hebei, Liaoning, Jiangsu, Shandong, and Guangdong provinces are typical export regions, i.e. much of their economic production is exported to meet the final and intermediate production demands of other regions in China and other countries in the world. So carbon emissions caused by their economic growth comprise two parts: the emissions embodied in exported goods; and the emissions meeting the final demand of their own final and intermediate productions. It is difficult to divide these due to the data unavailability. However, this is an important consideration for accounting for emissions and setting targets in the future in these provinces.
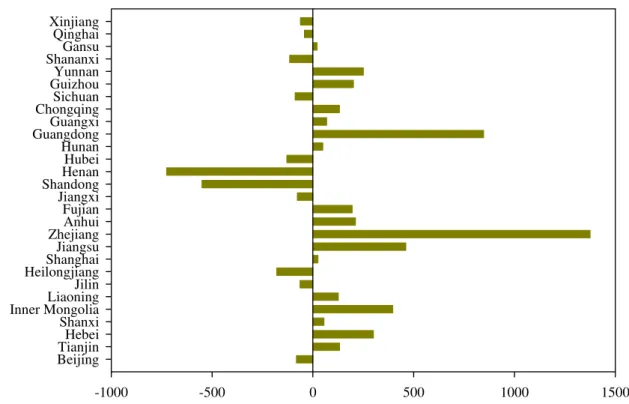
4.2 The impact of structural change on carbon emissions
The change in economic structure during 1997-2007 increased CO2 emissions in China year by year (as
indicated in Table 2). Figure 7 shows the impact of economic structural change on CO2 emissions of 28
provinces.
Only the economic structural change in Beijing and Heilongjiang provinces reduced CO2 emissions,
while such change in all other provinces increased CO2 emissions, meaning that China’s economic
structure became carbon-intensive.
In Hebei, Inner Mongolia, Shandong and Henan, the carbon emissions from economic structural change increased 39.79 MtC, accounting for about 32.99% of the total increment of CO2 emissions caused by
The impact of structural change on carbon emissions (MtC)
-600 -400 -200 0 200 400 600 800 1000 1200
BeijingTianjin Hebei Shanxi Inner MongoliaLiaoning Jilin HeilongjiangShanghai Jiangsu ZhejiangAnhui Fujian Jiangxi ShandongHenan Hubei Hunan GuangdongGuangxi ChongqingSichuan GuizhouYunnan ShananxiGansu Qinghai Xinjiang
Figure 7. The impact of economic structural change on provincial carbon emissions
4.3 The impact of energy intensity on carbon emissions
Energy intensity is the key factor to mitigate the growth of CO2 emissions, as shown in Table 2.
However, instead of decreasing CO2 emissions, the impact from energy intensity has resulted in an
increase of CO2 emissions by 48.76 MtC and 86.35 MtC, respectively, during 2002-2003 and 2004-2005,
resulting from the rebound of energy intensity in such major industrial provinces as Shandong, Hebei, Jiangsu, Henan and Guangdong.
The impact of energy intensity on carbon emissions (MtC) -6000 -5000 -4000 -3000 -2000 -1000 0 1000 2000 BeijingTianjin
Hebei Shanxi Inner MongoliaLiaoning Jilin HeilongjiangShanghai Jiangsu ZhejiangAnhui Fujian Jiangxi ShandongHenan Hubei Hunan GuangdongGuangxi ChongqingSichuan GuizhouYunnan ShananxiGansu Qinghai Xinjiang
Figure 8 shows the impact of energy intensity change on CO2 emissions during 1997-2007. The energy
intensity change in Shandong, Henan, Fujian, Yunnan and Xinjiang provinces resulted in an increase of CO2 emissions by 25.08 MtC, the greatest increase originating from Henan Province. The energy
intensity change in the other provinces reduced CO2 emissions, the greatest decrease originating from
Liaoning Province. Such difference in the impact on CO2 emission is due to the difference in the change
of energy intensity in the secondary sector. The energy intensity of the secondary sector in Henan Province increased by 2.48%, but that in Liaoning Province decreased by 47.78%. Therefore, energy intensity decline in the secondary sector is the key to mitigating the growth of carbon emissions.
4.4 The impact of carbon coefficients on carbon emissions
The impact of the CO2 emission coefficient on CO2 emissions not only reflects the impact from the
change of the CO2 emission coefficients of electric power and heat generation, but also reflects the
impact from the change in the energy consumption structure, as shown in Figure 9.
The impact of carbon coefficents on carbon emissions (MtC)
-1000 -500 0 500 1000 1500
BeijingTianjin Hebei Shanxi Inner MongoliaLiaoning Jilin HeilongjiangShanghai Jiangsu ZhejiangAnhui Fujian Jiangxi ShandongHenan Hubei Hunan GuangdongGuangxi ChongqingSichuan GuizhouYunnan ShananxiGansu Qinghai Xinjiang
Figure 9. The impact of carbon coefficients on provincial carbon emissions
It can be observed that the impact of the CO2 emission coefficient is smaller than that of other factors in
Table 2. However, this does not present an identical trend. For Zhejiang, Guangxi, Hebei, Yunnan provinces etc., the change of carbon coefficients indicates increases in carbon emissions due to increasing share of electricity, while for others, a reduction in the carbon emissions due to a decline in coal share.
5. Conclusion and policy implications
Due to lack of the detailed data of manufacturing sectors, this paper only analyze regional carbon emissions from three sectors in 28 provinces and can not provide the analysis of carbon emissions from every manufacturing sector in every province. So we can only provide macro-level information for carbon emissions mitigation policy for every province. According to the analysis and empirical research conducted in this paper on provinces in China for 1997-2007, the main conclusions are summarized as follows:
1.China's CO2 emissions from end-use energy consumption mainly originated from such major
increased by 121.24% in 2007. Shandong, Hebei, Jiangsu, Guangdong, Henan and Zhejiang provinces were characterized by the greatest increase of CO2 emissions from energy end-use,
being 13.24%,8.82%,7.37%,7.34%,7.11% and 5.89%, respectively, accounting for 49.77% of the total emissions of 28 provinces, municipalities and autonomous regions. Therefore, efforts should be focused on these provinces during the mitigation of CO2 emissions.
2.Differences in provincial economic structure, economic development level and industrial structure result in differences in provincial CO2 emission intensity, which is high in Shanxi, Inner
Mongolia, Guizhou, Gansu, and Qinghai provinces and low in Beijing, Shanghai, and Guangdong provinces.
3.Economic growth and drop in energy intensity will have the greatest impact on CO2 emissions
from end-use energy consumption, and economic development is the key to increasing CO2
emissions, while change in energy intensity can more or less decrease CO2 emissions. Despite the
slight decrease of CO2 emission intensity in 2007 over 1997, economic growth contributed to the
continual growth of CO2 emissions in the respective provinces.
The above analysis provides important information for China to draw up different policy measures to control carbon emissions of different regions. We suggest that:
(1)To control carbon emissions in Shandong, Hebei, Jiangsu, Guangdong, Henan provinces, it would be better to set a target for carbon emissions growth. To minimize the mitigation cost, a voluntary and incentive-based trading scheme may be useful. In this market, the permitted allowance would be the growth rate of carbon emissions other than the absolute carbon emissions.
(2)Due to the higher GDP per capita and level of urbanization, to mitigate the growth of carbon emissions in Shanghai and Tianjin provinces, it would be better to establish policies addressing the lower carbon intensity and lower carbon emissions per capita.
(3)For Guizhou, Shanxi, Inner Mongolia and Hebei provinces, regions with higher self-supply of coal, policy design should focus on mandatory measures addressing production technology development, energy conservation management and energy efficiency enhancement in larger energy-intensive enterprises.
Appendix A: Some key indications of 30 provinces in 2007
Population (Million persons)
Size
(Thousand square kilometers)
GDP Per capita (Yuan/person, constant 2005 price)
End-use energy consumption (Mtce)
Beijing 16.33 16.8 53934.11 49.06
Tianjin 11.15 11.3 43752.13 36.77
Hebei 69.43 187.7 18573.87 164.77
Shanxi 33.93 156.3 15733.01 93.59
Inner Mongolia 24.05 1183 22887.61 74.93
Liaoning 42.98 145.9 24298.42 118.28
Jilin 27.3 187.4 17704.9 58.12
Heilongjiang 38.24 454.8 18108.69 57.77
Shanghai 18.58 6.3 63071.76 74.29
Jiangsu 76.25 102.6 31691.73 138.55
Zhejiang 50.6 102 34691.32 96.43
Anhui 61.18 139.7 11279.36 58.15 Fujian 35.81 121.3 24256.96 53.08
Jiangxi 43.68 167 11781.5 36.72
Shandong 93.67 153.8 25934.3 204.64
Henan 93.6 167 14818.6 124.95
Hubei 56.99 185.9 14838.16 88.51
Hunan 63.55 211.8 13144.41 81.40
Guangdong 94.49 180 31102.64 145.92
Guangxi 47.68 236 11169.17 44.16
Hainan 8.45 34 13666.58 8.27
Chongqing 28.16 82.3 14140.18 32.82
Sichuan 81.27 481.4 11763.05 77.90
Guizhou 37.62 176 6680.099 49.50
Yunnan 45.14 383.3 9682.693 50.29
Shananxi 37.48 205.6 12666.63 44.45
Gansu 26.17 454.4 9255.51 33.88
Qinghai 5.52 722.3 12428.2 11.62
Ningxia 6.1 66.4 12627.89 17.05
Xinjiang 20.95 1660 15483.85 45.97
Acknowledgements
The authors gratefully acknowledge the financial support from the National Natural Science Foundation of China under Grant Nos. 70903028, 70425001, 70733005, 70701032, the Natural Science Foundation of Beijing under Grant No. 9082015, the Knowledge Innovation Program of Chinese Academy of Sciences No. O801141601, and the National Key Projects from the Ministry of Science and Technology of China No. 2006-BAB08B01.
References
[1] Kahrl, F., David R.-H., 2006. China’s carbon challenge: insights from the electric power sector. http://are.berkeley.edu/~dwrh/CERES_Web/Docs/CCC_110106.pdf.
[3] Wu, L., Kaneko, S., Matsuoka, S., 2006. Dynamics of energy-related CO2 emissions in China
during 1980 to 2002: the relative importance of energy supply-side and demand-side effects. Energy Policy 34, 3549-3572.
[4] Wang, C., Chen, J.N., Zou, J., 2005. Decomposition of energy-related CO2 emission in China:
1957–2000. Energy 30, 73–83.
[5] Fan, Y., Liu, L.C., Wu, G.., Tsai, H.T., Wei, Y.M., 2007. Changes in carbon intensity in China: empirical findings from 1980 to 2003. Ecological Economics 62, 683–691.
[6] Liu, L.C., Fan, Y., Wu, G.., Wei,Y.M., 2007. Using LMDI method to analyze the change of
China’s industrial CO2 emissions from final fuel use: an empirical analysis. Energy Policy 35,
5892–5900.
[7] Zhang, M., Mu, H., Ning, Y., 2009. Accounting for energy-related CO2 emission in China,1991–
2006. Energy Policy 37, 767-773.
[8] Auffhammer, M., Carson, R.T., 2008. Forecasting the path of China's CO2 emissions using
province-level information. Journal of Environmental Economics and Management 55, 229-247. [9] IEA, 2008. CO2 emissions from fuel combustion 2008. IEA, Paris.
[10] Ang, B.W., 2004. Decomposition analysis for policymaking in energy: which is the prefered method? Energy Policy 32, 1131-1139.
[11] Ang, B.W., 2005. The LMDI approach to decomposition analysis: a practical guide. Energy Policy 33, 867-871.
[12] China Energy Statistical Yearbook 2008, Department of Industrial and Transport Statistics of National Bureau of Statistics, National Energy Administration of National Development and Reform Commission, 2009. Beijing: China Statistics Press.
[13] China Energy Statistical Yearbook 1997-1999, Department of Industrial and Transport Statistics of National Bureau of Statistics, 2001. Beijing: China Statistics Press.
[14] China Energy Statistical Yearbook 2004, Department of Industrial and Transport Statistics of National Bureau of Statistics, National Energy Administration of National Development and Reform Commission, 2006. Beijing: China Statistics Press.
[15] China Energy Statistical Yearbook 2005, Department of Industrial and Transport Statistics of National Bureau of Statistics, National Energy Administration of National Development and Reform Commission, 2006. Beijing: China Statistics Press.
[16] China Energy Statistical Yearbook 2006, Department of Industrial and Transport Statistics of National Bureau of Statistics, National Energy Administration of National Development and Reform Commission, 2007 . Beijing: China Statistics Press.
[17] China Energy Statistical Yearbook 2007, Department of Industrial and Transport Statistics of National Bureau of Statistics, National Energy Administration of National Development and Reform Commission, 2008. Beijing: China Statistics Press.
Dr. Lan-Cui Liu is an assistant Professor at the Chinese Academy of Environmental Planning, Ministry of
Dr. Jin-Nan Wang is a Professor at the Chinese Academy of Environmental Planning, Ministry of Environmental Planning, China.
Dr. Gang Wu is an associate Professor at the Center for Energy and Environmental Policy Research,
Beijing Institute of Technology (BIT).
Dr. Yi-Ming Wei is a Professor at the Center for Energy and Environmental Policy Research, Beijing
Institute of Technology (BIT), and is the Dean of School of Management and Economics, BIT. He was a visiting scholar at Harvard University, USA.