GMDD
3, 2291–2314, 2010Impact of a new toluene mechanism on model predictions
G. Sarwar et al.
Title Page
Abstract Introduction
Conclusions References
Tables Figures
◭ ◮
◭ ◮
Back Close
Full Screen / Esc
Printer-friendly Version Interactive Discussion
Discussion
P
a
per
|
Dis
cussion
P
a
per
|
Discussion
P
a
per
|
Discussio
n
P
a
per
|
Geosci. Model Dev. Discuss., 3, 2291–2314, 2010 www.geosci-model-dev-discuss.net/3/2291/2010/ doi:10.5194/gmdd-3-2291-2010
© Author(s) 2010. CC Attribution 3.0 License.
Geoscientific Model Development Discussions
This discussion paper is/has been under review for the journal Geoscientific Model Development (GMD). Please refer to the corresponding final paper in GMD if available.
Impact of a new condensed toluene
mechanism on air quality model
predictions in the US
G. Sarwar1, K. W. Appel1, A. G. Carlton1,*, R. Mathur1, K. Schere1, R. Zhang2, and M. A. Majeed3
1
Atmospheric Modeling and Analysis Division, National Exposure Research Laboratory, Office of Research and Development, US Environmental Protection Agency, RTP, NC 27711, USA
2
Department of Mathematics, The Hong Kong University of Science & Technology, Clear Water Bay, Kowloon, Hong Kong, China
3
Delaware Department of Natural Resources & Environmental Control, New Castle, DE, USA
*
now at: Department of Environmental Sciences, Rutgers University, New Brunswick, NJ, USA
Received: 23 November 2010 – Accepted: 29 November 2010 – Published: 6 December 2010 Correspondence to: G. Sarwar ([email protected])
GMDD
3, 2291–2314, 2010Impact of a new toluene mechanism on model predictions
G. Sarwar et al.
Title Page
Abstract Introduction
Conclusions References
Tables Figures
◭ ◮
◭ ◮
Back Close
Full Screen / Esc
Printer-friendly Version Interactive Discussion
Discussion
P
a
per
|
Dis
cussion
P
a
per
|
Discussion
P
a
per
|
Discussio
n
P
a
per
|
Abstract
A new condensed toluene mechanism is incorporated into the Community Multiscale Air Quality Modeling system. Model simulations are performed using the CB05 chemi-cal mechanism containing the existing (base) and the new toluene mechanism for the western and eastern US for a summer month. With current estimates of tropospheric 5
emission burden, the new toluene mechanism increases monthly mean daily maxi-mum 8-h ozone by 1.0–3.0 ppbv in Los Angeles, Portland, Seattle, Chicago, Cleveland, northeastern US, and Detroit compared to that with the base toluene chemistry. It re-duces model mean bias for ozone at elevated observed ozone mixing ratios. While the new mechanism increases predicted ozone, it does not enhance ozone produc-10
tion efficiency. Sensitivity study suggests that it can further enhance ozone if elevated toluene emissions are present. While changes in total fine particulate mass are small, predictions of in-cloud SOA increase substantially.
1 Introduction
Toluene is an important aromatic compound that can affect ozone (O3) and secondary
15
organic aerosol (SOA) in the atmosphere. However, there is currently a great deal of uncertainty related to toluene chemistry (Calvert et al., 2002). Different chemical mech-anisms use different approximations for toluene reactions that can result in different ozone predictions. For example, Faraji et al. (2008) used the Carbon Bond IV (CB-IV) (Gery et al., 1989) and the Statewide Air Pollution Research Center (SAPRC-99) chem-20
ical mechanisms (Carter, 2000) for Houston and reported that O3 predictions differed
by as much as 40 ppbv. The authors attributed the difference in predicted mixing ratios mostly due to the differences in aromatic chemistry in the two mechanisms. Yarwood et al. (2005) extended the CB-IV mechanism into an updated Carbon Bond (CB05) mech-anism consisting of 156 chemical reactions involving 52 chemical species. Sarwar et 25
GMDD
3, 2291–2314, 2010Impact of a new toluene mechanism on model predictions
G. Sarwar et al.
Title Page
Abstract Introduction
Conclusions References
Tables Figures
◭ ◮
◭ ◮
Back Close
Full Screen / Esc
Printer-friendly Version Interactive Discussion
Discussion
P
a
per
|
Dis
cussion
P
a
per
|
Discussion
P
a
per
|
Discussio
n
P
a
per
|
and reported that the use of CB05 increases predicted O3compared to those with the CB-IV. Toluene chemistry in CB05 was retained from the CB-IV chemical mechanism. Recently, Whitten et al. (2010) proposed a new condensed toluene mechanism for CB05 mechanism. They performed simulations using the existing CB05 mechanism as well as the new CB05 mechanism containing the new condensed toluene mech-5
anism for 38 environmental chamber experiments involving different combinations of toluene and oxides of nitrogen (NOx). They used four different performance metrics to compare model predictions with chamber data: maximum O3, maximum∆(NO-O3),
NOx crossover time, and cresol concentrations (NO=nitric oxide). The new toluene
mechanism provided better results than the existing toluene chemistry in simulating 10
chamber data. This study examines the impact of the new condensed toluene mecha-nism on air quality model predictions in the US.
2 Methodology
2.1 Model description
The study uses the Community Multiscale Air Quality (CMAQ) modeling system (ver-15
sion 4.7) (Binkowski and Roselle, 2003; Byun and Schere, 2006) to simulate air quality. Evaluations for the CMAQ modeling system have recently been conducted by compar-ing model predictions to measured ambient pollutants (Eder and Yu, 2006; Appel et al., 2007; Foley et al., 2010). The CMAQ model has considerable skill is simulating O3
mixing ratios in the atmosphere. For example, CMAQv4.7 predicts O3 with a
normal-20
ized median bias of 4.0% and a normalized median error of 13% (Foley et al., 2010). Two modeling domains are used for the study. One domain focuses on the western US and consists of 213×192 horizontal grid-cells while the other domain focuses on
the eastern US and consists of 213×188 horizontal grid-cells with a 12-km resolution.
Each model contains 14 vertical layers of variable thickness between the surface and 25
GMDD
3, 2291–2314, 2010Impact of a new toluene mechanism on model predictions
G. Sarwar et al.
Title Page
Abstract Introduction
Conclusions References
Tables Figures
◭ ◮
◭ ◮
Back Close
Full Screen / Esc
Printer-friendly Version Interactive Discussion
Discussion
P
a
per
|
Dis
cussion
P
a
per
|
Discussion
P
a
per
|
Discussio
n
P
a
per
|
The CMAQ chemical transport model is configured to use the mass continuity scheme to describe advection processes, the Asymmetric Convective Model Version 2 (ACM2) (Pleim, 2007) to describe vertical diffusion processes, the multiscale method to describe horizontal diffusion processes, and an adaptation of the ACM algorithm for convective cloud mixing. Aqueous chemistry, aerosol processes, and dry/wet de-5
position are included. The meteorological driver for the CMAQ modeling system is the PSU/NCAR MM5 system (version 3.5) (Grell et al., 1994). Initial and boundary conditions for this study are obtained from CMAQ model results of a larger modeling domain.
Each domain is first simulated using the CB05 chemical mechanism containing ex-10
isting toluene chemistry (CB05-Base) (Yarwood et al., 2005) and then using the CB05 chemical mechanism containing the new toluene chemistry (CB05-TU) (Whitten et al., 2010). The difference in modeling results obtained with the two model simulations are attributed to the differences in toluene chemistry.
The CMAQ modeling system currently provides three different gas-phase chemistry 15
solvers: the Sparse-Matrix Vectorized Gear Algorithm solver, the Rosenbrock solver, and the Euler Backward Iterative (EBI) solver. The EBI solver is dependent on chem-ical mechanism which necessitates the development of a new EBI solver for each new mechanism. The Rosenbrock and the Sparse-Matrix Vectorized Gear Algorithm solvers are generalized solvers that can usually be used for any chemical mechanisms 20
without requiring any changes. The Sparse-Matrix Vectorized Gear Algorithm solver is the slowest but the most accurate among the three solvers. The Rosenbrock solver is faster than the Sparse-Matrix Vectorized Gear Algorithm solver and was used for this study. The use of CB05-TU increases computational time of the model by 3–6% compared to the CB05-Base.
25
2.2 Toluene chemistry
GMDD
3, 2291–2314, 2010Impact of a new toluene mechanism on model predictions
G. Sarwar et al.
Title Page
Abstract Introduction
Conclusions References
Tables Figures
◭ ◮
◭ ◮
Back Close
Full Screen / Esc
Printer-friendly Version Interactive Discussion
Discussion
P
a
per
|
Dis
cussion
P
a
per
|
Discussion
P
a
per
|
Discussio
n
P
a
per
|
presented in Fig. 1. Reaction of toluene (TOL) with hydroxyl radical (OH) proceeds via three different channels: 36% of the reaction produces cresol (CRES), 56% pro-duces a bicyclic peroxy radical (TO2), and 8% propro-duces benzaldehyde. Contribution of benzaldehyde to O3 is negligible; thus, it is not further retained in CB05. TO2 re-acts with nitric oxide (NO) to produce organic nitrate (NTR) and a ring-opening product 5
(OPEN) or breaks down to produce CRES. OPEN reacts with OH to form acetyl peroxy radical (C2O3), which subsequently produces peroxy acetyl nitrate (PAN) via reaction with nitrogen dioxide (NO2). During daytime, CRES reacts with OH to produce methyl
phenoxy radical (CRO), which produces NTR via reaction with NO2.
Whitten et al. (2010) describe the detailed chemistry of CB05-TU containing 26 10
chemical reactions involving 13 species for toluene oxidation and provide a simplified schematic diagram for the chemistry (see Fig. 3 in the reference). Reaction of toluene with OH proceeds via four different channels: 18% of the reaction produces CRES, 65% produces TO2, 10% produces benzaldehyde, and 7% produces OH. TO2 reacts with NO to produce NTR, OPEN, and methyl glyoxal. OPEN reacts with OH to form 15
a peroxyacyl radical (OPO3), which leads to an organic PAN (OPAN) via reaction with NO2. During daytime, CRES reacts with OH to generate CRO, which produces nitro-cresol (CRON) via reaction with NO2. CRON reacts with OH and leads to an alkoxy
radical (CRNO) which further reacts with NO2yielding NTR.
The impact of the revised toluene mechanism on photochemistry and O3production 20
are best illustrated by the following reactions:
HO2+NO→OH+NO2 (1)
NO2+hv→NO+O(3P) (2)
O(3P)+O2→O3 (3)
HO2+O2→OH+O3 (net result of 1 to 3)
25
GMDD
3, 2291–2314, 2010Impact of a new toluene mechanism on model predictions
G. Sarwar et al.
Title Page
Abstract Introduction
Conclusions References
Tables Figures
◭ ◮
◭ ◮
Back Close
Full Screen / Esc
Printer-friendly Version Interactive Discussion
Discussion
P
a
per
|
Dis
cussion
P
a
per
|
Discussion
P
a
per
|
Discussio
n
P
a
per
|
where HO2=hydroperoxy radical , RO2=organic peroxy radical, and O( 3
P)=oxygen atom (triplet), O2=oxygen.
The reaction of NO with HO2 converts NO into NO2 and cause an increase in O3 when NO2 is photolyzed according to reactions (1)–(3) (Finlayson-Pitts and Pitts,
2000). The reaction of NO with RO2also converts NO into NO2and causes an increase
5
in O3when NO2is photolyzed (reaction 4) (Finlayson-Pitts and Pitts, 2000). CB05-TU enhances HO2 and RO2 directly as well as indirectly through increase in OH and its
subsequent reactions with volatile organic compounds (VOC). If sufficient toluene is present, the new condensed toluene mechanism can enhance HO2 and RO2, and subsequently O3. Since CB05-TU enhances OH, it can also affect other pollutants.
10
2.3 Emissions
Anthropogenic emissions are derived from the 2002 National Emissions Inventory (NEI) for the western US and the 2001 NEI for the eastern US. Biogenic emissions are estimated using the Biogenic Emissions Inventory System (version 3.13) (Schwede et al., 2005). Total toluene emissions in the western US are lower than those in the east-15
ern US. Typical summertime daily toluene emissions in the western US are about 30% of those in the eastern US. Mobile source sector is the major contributor to toluene emissions burden. On-road and non-road mobile sources collectively contribute 44% and 32% of the total toluene emissions in the western and eastern US, respectively. Toluene emissions in urban areas are higher than those in rural areas.
20
3 Results and discussion
3.1 Impact on O3and selected gaseous species
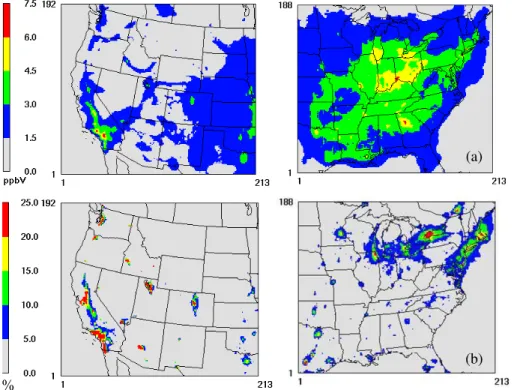
Predicted monthly mean O3 with CB05-Base and the percent increase in O3 between CB05-TU and CB05-Base are shown in Fig. 2. Mean O3 mixing ratios of greater
GMDD
3, 2291–2314, 2010Impact of a new toluene mechanism on model predictions
G. Sarwar et al.
Title Page
Abstract Introduction
Conclusions References
Tables Figures
◭ ◮
◭ ◮
Back Close
Full Screen / Esc
Printer-friendly Version Interactive Discussion
Discussion
P
a
per
|
Dis
cussion
P
a
per
|
Discussion
P
a
per
|
Discussio
n
P
a
per
|
increases mean O3in three large areas in the western US and three large areas in the eastern US by 2% or more: Los Angeles; Portland; Seattle; Chicago and the surround-ing area; the Lake Erie area includsurround-ing Detriot, Cleveland, Toronto; and the northeastern US coast. Additionally, it increases mean O3by more than 0.5% in some areas in the western US and over a large area in the eastern US. Mean toluene/VOC ratios are also 5
shown in the figure. Toluene/VOC ratios are greater in urban areas than in rural areas. Enhancements in O3levels coincided with greater toluene/VOC ratios.
Monthly mean OH, HO2, and RO2 with CB05-Base and the percent increases in
mean OH, HO2, and RO2 between the two mechanisms are shown in Fig. 3. Mean
OH mixing ratios over 0.1 pptv are predicted in many areas in both domains. CB05-10
TU increases mean OH by more than 1% in many areas in the eastern US as well as in isolated areas in the western US. Mean HO2 mixing ratios of over 10.0 pptv are
predicted in most areas in western as well as eastern US. CB05-TU increases mean HO2by more than 2% in Los Angeles, Portland, Seattle, Chicago and the surrounding area, the Lake Erie and the surrounding area, northeastern US coast, and some other 15
smaller areas. Mean RO2mixing ratios over 40 pptv are predicted in large part of the
western US as well as southeastern US. CB05-TU increases mean RO2by more than 2% in coastal states and some smaller areas in the western US and over large areas in northeastern US and smaller areas in eastern US. Generally, larger changes in mean OH, HO2, and RO2 occur in areas with larger O3 changes. Enhanced HO2 and RO2 20
increases O3via reactions (1)–(4).
Monthly mean NOx reaction products (NOz=NOy−NOx) with CB05-Base and the
percent increases in NOz between CB05-TU and CB05-Base are shown in Fig. 4. Relatively high NOz values (>3.0 ppbv) are predicted over a large area in the
east-ern US while such levels are predicted only over scattered areas in the westeast-ern US. 25
CB05-TU increases NOz both in the western and eastern US in the same areas that it increases O3. The primary reason for the increase in NOz is daytime nitric acid
(HNO3) production via the reaction: NO2+OH=HNO3. CB05-TU enhances OH, thus
GMDD
3, 2291–2314, 2010Impact of a new toluene mechanism on model predictions
G. Sarwar et al.
Title Page
Abstract Introduction
Conclusions References
Tables Figures
◭ ◮
◭ ◮
Back Close
Full Screen / Esc
Printer-friendly Version Interactive Discussion
Discussion
P
a
per
|
Dis
cussion
P
a
per
|
Discussion
P
a
per
|
Discussio
n
P
a
per
|
3.2 Impact on daily maximum 8-h O3
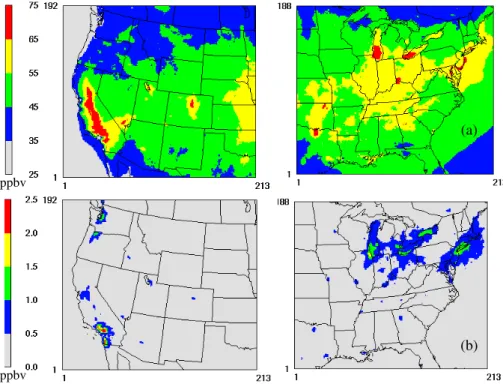
Monthly mean daily 8-h maximum O3 with CB05-Base and increases in mean 8-h O3
between CB05-TU and CB05-Base are shown in Fig. 5. Elevated levels of 8-h O3 (>55 ppbv) are predicted over only a small area in the western US while similar levels
are predicted over a large area in the eastern US. CB05-TU increases monthly mean 5
8-h O3 by a maximum of 2.8 ppbv in Los Angeles, 1.5 ppbv in Portland, 1.5 ppbv in Seattle, 2.0 ppbv in Chicago, 1.9 ppbv in Cleveland, 1.7 ppbv northeastern US, and 1.3 ppbv in Detroit compared to those obtained with the CB05-Base. CB05-TU also increases mean 8-h O3by 0.5 ppbv or more in several other areas.
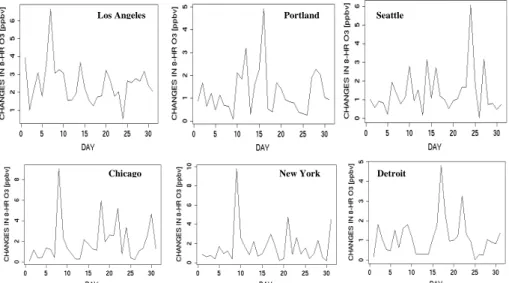
Day-to-day variation of the increases in daily 8-h maximum O3for Los Angeles, Port-10
land, Seattle, Chicago, New York, and Detroit is presented in Fig. 6. For each area, changes in daily 8-h maximum O3 between CB05-TU and CB05-Base vary from day
to day. While increases are relatively high (5–10 ppbv) on some days, increases are modest on many other days. In Los Angeles, O3increases occur on most days while
increases in O3in Portland and Seattle occur on fewer days. Increases in Chicago and
15
New York are comparable while increases in Detroit are lower than those in Chicago or New York.
3.3 Comparison with observed data
Ambient monitoring data from the United States Environmental Protection Agency’s Air Quality System are used to evaluate mean bias (MB) for O3. Variations in predicted 20
daily maximum 8-h O3 and MB (median and inter-quartile range) as a function of
ob-served O3 for CB05-TU and CB05-Base simulation is presented in Fig. 7. Predicted
daily maximum 8-h O3 levels with CB05-Base are lower than the observed data in Los Angeles and predictions with CB05-TU improves the MB at all observed concen-trations. In Portland, Seattle, Chicago, New York/New Jersey, and Detroit CB05-TU 25
GMDD
3, 2291–2314, 2010Impact of a new toluene mechanism on model predictions
G. Sarwar et al.
Title Page
Abstract Introduction
Conclusions References
Tables Figures
◭ ◮
◭ ◮
Back Close
Full Screen / Esc
Printer-friendly Version Interactive Discussion
Discussion
P
a
per
|
Dis
cussion
P
a
per
|
Discussion
P
a
per
|
Discussio
n
P
a
per
|
3.4 Impact on ozone production efficiency
Ozone production efficiency (OPE) is defined as the number of O3molecules formed
from each molecule of NOx oxidized to NOz and can be calculated from the slope of a
regression between O3and NOz. OPE are estimated using O3and NOzvalues during daytime (10:00–05:00 p.m.) and when O3/NOx are greater than 46 (aged air mass)
5
(Arnold et al., 2003). OPE obtained with CB05-TU is marginally lower than the value obtained with CB05-Base at Los Angeles (OPE=5.9 with CB05-TU and OPE=6.3 with CB05-Base). OPE obtained with CB05-TU is similar to the value obtained with CB05-Base at Chicago (OPE=4.1 with both CB05-TU and CB05-Base). Increases in O3 with the new mechanism are associated with increased NOz. Similar changes are 10
obtained for other areas in the western and eastern US. Thus, CB05-TU increases O3
by increasing NOzand without enhancing OPE.
3.5 Impact on air pollution control strategy
While predicted O3mixing ratios are important for model evaluation, relative reduction factors (RRF) are valuable for developing emissions control strategies. To evaluate 15
RRF, additional model simulations were performed with a 25% reduction in NOx
emis-sions using each mechanism. RRF are calculated using results obtained with normal and reduced NOx emissions for each mechanism. RRF calculated with CB05-Base
are identical to values obtained with CB05-TU for most areas. Only minor changes (0.01–0.02) occur in RRF for some isolated areas. CB05-TU does not change RRF 20
compared to those with CB05-Base; thus it is not expected to affect inferences on air pollution control strategies drawn from the model.
3.6 Sensitivity of predicted O3with toluene emissions
To evaluate the sensitivity of predicted O3 to toluene emissions, two additional sim-ulations were conducted with increased toluene emissions (2× toluene emissions
GMDD
3, 2291–2314, 2010Impact of a new toluene mechanism on model predictions
G. Sarwar et al.
Title Page
Abstract Introduction
Conclusions References
Tables Figures
◭ ◮
◭ ◮
Back Close
Full Screen / Esc
Printer-friendly Version Interactive Discussion
Discussion
P
a
per
|
Dis
cussion
P
a
per
|
Discussion
P
a
per
|
Discussio
n
P
a
per
|
obtained using NEI). One simulation was conducted using CB05-Base with enhanced toluene emissions and the other simulation was conducted using CB05-TU with en-hanced toluene emissions. Larger increases in O3occur between the two mechanisms
with enhanced toluene emissions than those with normal toluene emissions. For exam-ple, CB05-TU increases daily maximum 8-h O3by 9 ppbv in Los Angeles with enhanced
5
toluene emissions compared to an increase of 6 ppbv with normal toluene emissions on 6 July. Similarly, CB05-TU increases daily maximum 8-h O3by 17 ppbv in Chicago with enhanced toluene emissions compared to an increase of 10 ppbv with normal toluene emissions on 8 July. Thus, CB05-TU can produce additional O3 compared to those
with CB05-Base if greater toluene emissions are present which suggests that the new 10
mechanism can be important in areas with elevated toluene emissions.
3.7 Impact on selected aerosol species
Monthly mean anthropogenic SOA, biogenic SOA, and in-cloud SOA with CB05-Base and their percent increases between the two mechanisms are shown in Fig. 8. Pre-dicted anthropogenic SOA concentrations are greater in eastern US than those in west-15
ern US. Concentrations over 0.05 µg m−3are predicted over most areas in the eastern
US while such levels are predicted only over smaller areas in western US. CB05-TU increases anthropogenic SOA by more than 2% in northwestern US, Los Angeles, and northeastern US. Carlton et al. (2010) describes SOA formation mechanisms in CMAQv4.7. In CMAQ, benzene, toluene, and xylene (precursors to anthropogenic 20
SOA) react with OH to produce organic peroxy radicals. These organic peroxy radicals react with NO to produce semi-volatile organic compounds and HO2 to produce non-volatile SOA. Semi-non-volatile organic compounds produced via the NO reaction pathway can partition to form SOA. Semi-volatile organic compounds can also form non-volatile oligomers through particle phase-reactions. While the CB05-TU produces more or-25
ganic peroxy radicals via reactions of VOCs with enhanced OH, increases in SOA via the NO reaction pathway are small since NO also decrease with CB05-TU. Since HO2
increases with CB05-TU, SOA produced via the HO2reaction pathway becomes more
GMDD
3, 2291–2314, 2010Impact of a new toluene mechanism on model predictions
G. Sarwar et al.
Title Page
Abstract Introduction
Conclusions References
Tables Figures
◭ ◮
◭ ◮
Back Close
Full Screen / Esc
Printer-friendly Version Interactive Discussion
Discussion
P
a
per
|
Dis
cussion
P
a
per
|
Discussion
P
a
per
|
Discussio
n
P
a
per
|
Monthly mean biogenic SOA concentrations exceeding 0.4 µg m−3are predicted over
the southeastern US while such values are predicted only over a small area covering northern California and southern Oregon. CB05-TU increases biogenic SOA by more than 1.0% over a wide area in the southeastern US while increases in western US are generally lower than 1.0% and occurs only over small areas. In CMAQ, isoprene, 5
monoterpene, and sesquiterpene are precursors to biogenic SOA. For SOA production from isoprene, only reaction with OH is considered. For SOA production from monoter-pene, reactions with OH, O3, O(
3
P), and NO3are considered. For SOA production from
sesquiterpene, reactions with OH, O3, and NO3are considered. These reactions pro-duce semi-volatile organic compounds which partition to form SOA. The semi-volatile 10
organic compounds can also form oligomers through particle phase-reactions. Acid enhanced isoprene SOA is also accounted in the mechanism. Since oxidants increase with CB05-TU, biogenic SOA also increases. Although percent increases in biogenic SOA and anthropogenic SOA are similar, absolute increases of biogenic SOA are much larger.
15
Monthly mean in-cloud SOA concentrations of greater than 0.2 µg m−3are predicted
over a large portion of the eastern US while in-cloud SOA concentrations in the west-ern US are generally lower than 0.2 µg m−3and are predicted only over small isolated
areas. CB05-TU increases in-cloud SOA by more than 12% over much of the north-eastern US while it increases in-cloud SOA by more than 12% only over small isolated 20
areas in western US. Aqueous-phase oxidation of glyoxal and methylglyoxal by OH produce in-cloud SOA (Carlton et al., 2008, 2010). Glyoxal is not a chemical species in CB05; therefore only methylglyoxal is used for in-cloud SOA production (Carlton et al., 2010). CB05-TU enhances both methylglyoxal and OH; thus in-cloud SOA increases.
The relative contributions of anthropogenic, biogenic, and in-cloud SOA to total SOA 25
GMDD
3, 2291–2314, 2010Impact of a new toluene mechanism on model predictions
G. Sarwar et al.
Title Page
Abstract Introduction
Conclusions References
Tables Figures
◭ ◮
◭ ◮
Back Close
Full Screen / Esc
Printer-friendly Version Interactive Discussion
Discussion
P
a
per
|
Dis
cussion
P
a
per
|
Discussion
P
a
per
|
Discussio
n
P
a
per
|
4% in each domain). The relative contribution of biogenic SOA with each mechanism ranges up to 88% in the western US and 80% in the eastern US. The largest diff er-ence of the relative contribution of biogenic SOA was 7% in the western and 4% in the eastern US. The highest relative contribution of in-cloud SOA increased from 69% with CB05-Base to 75% with CB05-TU in the western US and from 46% with CB05-Base to 5
52% with CB05-TU in the eastern US. Thus, the relative contribution of anthropogenic, biogenic, and in-cloud SOA to total SOA did not substantially change between the two mechanisms.
Monthly mean aerosol sulfate, nitrate, ammonium, and total PM2.5with CB05-Base
and their percent increases with CB05-TU are shown in Fig. 9. CB05-Base predicts 10
relatively low aerosol sulfate (<1.5 µg m−3) over most of the western US compared
to relatively high predictions (>3.0 µg m−3) over most of the eastern US. It predicts
relatively high aerosol sulfate (>6.0 µg m−3) over the Ohio valley area in the eastern
US while similar concentrations are not predicted in the western US. Predicted values reach up to 1.5–4.5 µg m−3 only over a small area in the western US. CB05-TU
in-15
creases aerosol sulfate by 0.5–1.5% in small areas in the western US and 0.5–1.0% in small areas in the eastern US.
Predicted mean aerosol nitrate of greater than 0.8 µg m−3 are predicted only over
isolated areas in the western US while similar values are predicted over a much larger area in the eastern US. CB05-TU increases aerosol nitrate by more than 2.0% in some 20
isolated areas in the western and larger areas in the eastern US. CMAQ produces aerosol nitrate from the partitioning of HNO3, which is produced via nighttime
homoge-neous and heterogehomoge-neous hydrolysis of dinitrogen pentoxide as well as daytime pro-duction via NO2+OH=HNO3. The primary reason for the increase in aerosol nitrate
is the enhancement of the daytime production of HNO3.
25
Mean ammonium concentrations of greater than 1.2 µg m−3are predicted over most
GMDD
3, 2291–2314, 2010Impact of a new toluene mechanism on model predictions
G. Sarwar et al.
Title Page
Abstract Introduction
Conclusions References
Tables Figures
◭ ◮
◭ ◮
Back Close
Full Screen / Esc
Printer-friendly Version Interactive Discussion
Discussion
P
a
per
|
Dis
cussion
P
a
per
|
Discussion
P
a
per
|
Discussio
n
P
a
per
|
of PM2.5in most areas in the eastern US while concentrations are typically lower than
5.0 µg m−3for most of the western US. CB05-TU increases PM
2.5by 0.5–2.5% in some
areas in the western and 0.5–1.0% in the northeastern US. However, increases over 1.0% occur in only a few isolated areas in the western US where predicted mean PM2.5
concentrations are generally lower than 5.0 µg m−3.
5
4 Summary
CB05-TU enhances monthly mean daily 8-h maximum O3 by a maximum of 2.8 ppbv in the western US and 2.0 ppbv in the eastern US. These changes are largely confined to the vicinity of major urban areas. CB05-TU improves MB at higher observed O3
concentrations. CB05-TU enhances OH, HO2, RO2, and NOz levels compared to the 10
CB05-Base. While it enhances O3, it does not increase OPE. The use of CB05-TU
does not alter RRF; thus, relative to CB05-Base it is not expected to alter inferences on air pollution control strategy. Its impact on PM2.5is small. This study uses relatively
coarse horizontal grid spacings since it focuses over a large geographical area. The impact of the new toluene chemistry on air quality modeling results could be more 15
pronounced in areas with higher toluene emissions if finer horizontal grid spacings are used.
Disclaimer. Although this paper has been reviewed by EPA and approved for
publica-tion, it does not necessarily reflect EPA’s policies or views.
20
References
GMDD
3, 2291–2314, 2010Impact of a new toluene mechanism on model predictions
G. Sarwar et al.
Title Page
Abstract Introduction
Conclusions References
Tables Figures
◭ ◮
◭ ◮
Back Close
Full Screen / Esc
Printer-friendly Version Interactive Discussion
Discussion
P
a
per
|
Dis
cussion
P
a
per
|
Discussion
P
a
per
|
Discussio
n
P
a
per
|
Arnold, J. R., Dennis, R. L., and Tonnesen, G. S.: Diagnostic Evaluation of Numerical Air Quality Models with Specialized Ambient Observations: Testing the Community Multiscale Air Quality Modeling System (CMAQ) at Selected SOS 95 Ground Site, Atmos. Environ., 37, 1185–1198, 2003.
Binkowski, F. S. and Roselle, S. J.: Community Multiscale Air Quality (CMAQ)
5
model aerosol component, I: Model description, J. Geophys. Res., 108(D6), 4183, doi:10.1029/2001JD001409, 2003.
Byun, D. and Schere, K. L.: Review of the governing equations, computational algorithms, and other components of the Models-3 Community Multiscale Air Quality (CMAQ) modeling system, Appl. Mech. Rev., 59, 51–77, 2006.
10
Calvert, J. G., Atkinson, R., Becker, K. H., Kamens, R. M., Seinfeld, J. H., Wallington, T. J., and Yarwood, G.: The mechanisms of atmospheric oxidation of aromatic hydrocarbons, Oxford University Press, New York, 566 pp., 2002.
Carlton, A. G., Turpin, B. J., Altieri, K. E., Seitzinger, S. P., Mathur, R., Roselle, S. J., and Weber, R. J.: CMAQ model performance enhanced when in-cloud SOA is included: comparisons of
15
OC predictions with measurements, Environ. Sci. Technol., 42(23), 8798–8802, 2008. Carlton, A. G., Bhave, P. V., Napelenok, S. L., Edward, E. O., Sarwar, G., Pinder, R. W., Pouliot,
G. A., and Houyoux, M.: Model representation of secondary organic aerosol in CMAQv4.7, Environ. Sci. Technol., 44(22), 8553–8560, 2010.
Carter, W. P. L.: Implementation of the SAPRC-99 chemical mechanism into the Models-3
20
Framework, report to the United States Environmental Protection Agency, available at: http: //www.cert.ucr.edu/∼carter/absts.htm#s99mod3, 2000.
Eder, B. and Yu, S.: A performance evaluation of the 2004 release of Models-3 CMAQ, Atmos. Environ., 40, 4811–4824, 2006.
Faraji, M., Kimura, Y., McDonald-Buller, E., and Allen, D.: Comparison of the carbon bond and
25
SAPRC photochemical mechanisms under conditions relevant to southeast Texas, Atmos. Environ., 42, 5821–5836, 2008.
Finlayson-Pitts, B. J. and Pitts Jr., J. N.: Chemistry of the Upper Lower Atmosphere, Theory, Experiments and Applications, Academic Press, San Diego, 2000.
Foley, K. M., Roselle, S. J., Appel, K. W., Bhave, P. V., Pleim, J. E., Otte, T. L., Mathur, R.,
30
GMDD
3, 2291–2314, 2010Impact of a new toluene mechanism on model predictions
G. Sarwar et al.
Title Page
Abstract Introduction
Conclusions References
Tables Figures
◭ ◮
◭ ◮
Back Close
Full Screen / Esc
Printer-friendly Version Interactive Discussion
Discussion
P
a
per
|
Dis
cussion
P
a
per
|
Discussion
P
a
per
|
Discussio
n
P
a
per
|
Gery, M. W., Whitten, G. Z., Killus, J. P., and Dodge, M. C.: A photochemical kinetics mecha-nism for urban and regional scale computer modeling, J. Geophys. Res., 94(D10), 12925– 12956, 1989.
Grell, G., Dudhia, J., and Stauffer, D.: A description of the fifth-generation Penn State/NCAR Mesoscale model (MM5), NCAR Tech. Note NCAR/TN-398+STR, 1994.
5
Pleim, J. E.: A combined local and nonlocal closure model for the atmospheric boundary layer. Part I: Model description and testing, J. Appl. Meteor. Climatol., 46, 1383–1395, 2007. Sarwar, G., Luecken, D., Yarwood, G., Whitten, G., and Carter, B.: Impact of an updated
Carbon Bond mechanism on air quality using the Community Multiscale Air Quality modeling system: preliminary assessment, J. Appl. Meteorol. Climatol., 47, 3–14, 2008.
10
Schwede, D., Pouliot, G., and Pierce, T.: Changes to the biogenic emissions inventory system version 3 (BEIS3), 4th Annual CMAS Models-3 Users’ Conference, 26–28 September, 2005, UNC-Chapel Hill, NC, available at http://www.cmascenter.org/conference/2005/abstracts/2 7.pdf, 2005.
Whitten, G. Z., Heo, G., Kimura, Y., McDonald-Buller, E., Allen, D., Carter, W. P. L., and
15
Yarwood, G.: A new condensed toluene mechanism for Carbon Bond: CB05-TU, Atmos. Environ., 44, 5346–5355, 2010.
Yarwood, G., Rao, S., Yocke, M., and Whitten, G.: Updates to the carbon bond chemical mechanism: CB05, Final report to the US EPA, RT-0400675, available at www.camx.com, 2005.
GMDD
3, 2291–2314, 2010Impact of a new toluene mechanism on model predictions
G. Sarwar et al.
Title Page
Abstract Introduction
Conclusions References
Tables Figures
◭ ◮
◭ ◮
Back Close
Full Screen / Esc
Printer-friendly Version Interactive Discussion
Discussion
P
a
per
|
Dis
cussion
P
a
per
|
Discussion
P
a
per
|
Discussio
n
P
a
per
|
TOL
CRES
TO2
NTR
OHCRO
OPEN
OH
HO2 (benzaldehyde)
36% 56% 8%
NO
10% 90%
OH
NTR
NO2 HO2C2O3
PAN
NO2
TOL
CRES
TO2
NTR
OHCRO
OPEN
OH
HO2 (benzaldehyde)
36% 56% 8%
NO
10% 90%
OH
NTR
NO2 HO2C2O3
PAN
NO2
GMDD
3, 2291–2314, 2010Impact of a new toluene mechanism on model predictions
G. Sarwar et al.
Title Page
Abstract Introduction
Conclusions References
Tables Figures
◭ ◮
◭ ◮
Back Close
Full Screen / Esc
Printer-friendly Version Interactive Discussion
Discussion
P
a
per
|
Dis
cussion
P
a
per
|
Discussion
P
a
per
|
Discussio
n
P
a
per
|
(a)
(b)
%
%
(c)
GMDD
3, 2291–2314, 2010Impact of a new toluene mechanism on model predictions
G. Sarwar et al.
Title Page
Abstract Introduction
Conclusions References
Tables Figures
◭ ◮
◭ ◮
Back Close
Full Screen / Esc
Printer-friendly Version Interactive Discussion
Discussion
P
a
per
|
Dis
cussion
P
a
per
|
Discussion
P
a
per
|
Discussio
n
P
a
per
|
% %
%
(b) (a)
(c) OH
HO2
RO2 ppt
ppt
GMDD
3, 2291–2314, 2010Impact of a new toluene mechanism on model predictions
G. Sarwar et al.
Title Page
Abstract Introduction
Conclusions References
Tables Figures
◭ ◮
◭ ◮
Back Close
Full Screen / Esc
Printer-friendly Version Interactive Discussion
Discussion
P
a
per
|
Dis
cussion
P
a
per
|
Discussion
P
a
per
|
Discussio
n
P
a
per
|
(a)
(b)
%
GMDD
3, 2291–2314, 2010Impact of a new toluene mechanism on model predictions
G. Sarwar et al.
Title Page
Abstract Introduction
Conclusions References
Tables Figures
◭ ◮
◭ ◮
Back Close
Full Screen / Esc
Printer-friendly Version Interactive Discussion
Discussion
P
a
per
|
Dis
cussion
P
a
per
|
Discussion
P
a
per
|
Discussio
n
P
a
per
|
ppbv
ppbv
(b) (a)
GMDD
3, 2291–2314, 2010Impact of a new toluene mechanism on model predictions
G. Sarwar et al.
Title Page
Abstract Introduction
Conclusions References
Tables Figures
◭ ◮
◭ ◮
Back Close
Full Screen / Esc
Printer-friendly Version Interactive Discussion
Discussion
P
a
per
|
Dis
cussion
P
a
per
|
Discussion
P
a
per
|
Discussio
n
P
a
per
|
Los Angeles Portland Seattle
Chicago New York Detroit
GMDD
3, 2291–2314, 2010Impact of a new toluene mechanism on model predictions
G. Sarwar et al.
Title Page
Abstract Introduction
Conclusions References
Tables Figures
◭ ◮
◭ ◮
Back Close
Full Screen / Esc
Printer-friendly Version Interactive Discussion
Discussion
P
a
per
|
Dis
cussion
P
a
per
|
Discussion
P
a
per
|
Discussio
n
P
a
per
|
(a)
(b)
(c)
(d)
(e)
(f)
GMDD
3, 2291–2314, 2010Impact of a new toluene mechanism on model predictions
G. Sarwar et al.
Title Page
Abstract Introduction
Conclusions References
Tables Figures
◭ ◮
◭ ◮
Back Close
Full Screen / Esc
Printer-friendly Version Interactive Discussion
Discussion
P
a
per
|
Dis
cussion
P
a
per
|
Discussion
P
a
per
|
Discussio
n
P
a
per
|
%
%
%
(a)
(b)
(c)
Anthropogenic SOABiogenic SOA
In-cloud SOA
GMDD
3, 2291–2314, 2010Impact of a new toluene mechanism on model predictions
G. Sarwar et al.
Title Page
Abstract Introduction
Conclusions References
Tables Figures
◭ ◮
◭ ◮
Back Close
Full Screen / Esc
Printer-friendly Version Interactive Discussion
Discussion
P
a
per
|
Dis
cussion
P
a
per
|
Discussion
P
a
per
|
Discussio
n
P
a
per
|
(a )
(b )
(c )
(d )
%
%
%
%
sulfate
nitrate
ammonium
PM2.5
Fig. 9. (a) monthly mean aerosol sulfate with CB05-Base and percent increase in mean aerosol sulfate between CB05-TU and CB05-Base,(b)mean aerosol nitrate with CB05-Base and percent increases in mean aerosol nitrate between CB05-TU and CB05-Base,(c) mean ammonium with CB05-Base and percent increases in mean ammonium between CB05-TU and CB05-Base,(d)mean PM2.5 with CB05-Base and percent increases in mean PM2.5 between