ACPD
13, 21125–21157, 2013Air quality and RF impacts of VOC
emissions
M. M. Fry et al.
Title Page
Abstract Introduction
Conclusions References
Tables Figures
◭ ◮
◭ ◮
Back Close
Full Screen / Esc
Printer-friendly Version Interactive Discussion
Discussion
P
a
per
|
D
iscussion
P
a
per
|
Discussion
P
a
per
|
Discuss
ion
P
a
per
|
Atmos. Chem. Phys. Discuss., 13, 21125–21157, 2013 www.atmos-chem-phys-discuss.net/13/21125/2013/ doi:10.5194/acpd-13-21125-2013
© Author(s) 2013. CC Attribution 3.0 License.
Atmospheric Chemistry and Physics
Open Access
Discussions
Geoscientiic Geoscientiic
Geoscientiic Geoscientiic
This discussion paper is/has been under review for the journal Atmospheric Chemistry and Physics (ACP). Please refer to the corresponding final paper in ACP if available.
Air quality and radiative forcing impacts
of anthropogenic volatile organic
compound emissions from ten world
regions
M. M. Fry1, M. D. Schwarzkopf2, Z. Adelman1, and J. J. West1 1
Department of Environmental Sciences and Engineering, University of North Carolina at Chapel Hill, Chapel Hill, North Carolina, USA
2
NOAA Geophysical Fluid Dynamics Laboratory, Princeton, New Jersey, USA
Received: 21 May 2013 – Accepted: 31 July 2013 – Published: 13 August 2013
Correspondence to: J. J. West ([email protected])
ACPD
13, 21125–21157, 2013Air quality and RF impacts of VOC
emissions
M. M. Fry et al.
Title Page
Abstract Introduction
Conclusions References
Tables Figures
◭ ◮
◭ ◮
Back Close
Full Screen / Esc
Printer-friendly Version Interactive Discussion
Discussion
P
a
per
|
D
iscussion
P
a
per
|
Discussion
P
a
per
|
Discuss
ion
P
a
per
|
Abstract
Non-methane volatile organic compounds (NMVOCs) influence air quality and global climate change through their effects on secondary air pollutants and climate forcers. Here we simulate the air quality and radiative forcing (RF) impacts of changes in ozone, methane, and sulfate from halving anthropogenic NMVOC emissions globally and from
5
10 regions individually, using a global chemical transport model and a standalone ra-diative transfer model. Halving global NMVOC emissions decreases global annual av-erage tropospheric methane and ozone by 36.6 ppbv and 3.3 Tg, respectively, and sur-face ozone by 0.67 ppbv. All regional reductions slow the production of PAN, resulting in regional to intercontinental PAN decreases and regional NOxincreases. These NOx
10
increases drive tropospheric ozone increases nearby or downwind of source regions in the Southern Hemisphere (South America, Southeast Asia, Africa, and Australia). Some regions’ NMVOC emissions contribute importantly to air pollution in other re-gions, such as East Asia, Middle East, and Europe, whose impact on US surface ozone is 43 %, 34 %, and 34 % of North America’s impact. Global and regional NMVOC
reduc-15
tions produce widespread negative net RFs (cooling) across both hemispheres from tropospheric ozone and methane decreases, and regional warming and cooling from changes in tropospheric ozone and sulfate (via several oxidation pathways). The total global net RF for NMVOCs is estimated as 0.0277 W m−2 (∼1.8 % of CO2 RF since
the preindustrial). The 100 yr and 20 yr global warming potentials (GWP100, GWP20)
20
are 2.36 and 5.83 for the global reduction, and 0.079 to 6.05 and−1.13 to 18.9 among
the 10 regions. The NMVOC RF and GWP estimates are generally lower than previ-ously modeled estimates, due to differences among models in ozone, methane, and sulfate sensitivities, and the climate forcings included in each estimate. Accounting for a fuller set of RF contributions may change the relative magnitude of each region’s
im-25
ACPD
13, 21125–21157, 2013Air quality and RF impacts of VOC
emissions
M. M. Fry et al.
Title Page
Abstract Introduction
Conclusions References
Tables Figures
◭ ◮
◭ ◮
Back Close
Full Screen / Esc
Printer-friendly Version Interactive Discussion
Discussion
P
a
per
|
D
iscussion
P
a
per
|
Discussion
P
a
per
|
Discuss
ion
P
a
per
|
1 Introduction
Non-methane volatile organic compounds (NMVOCs) are chemically reactive gases emitted worldwide from natural and anthropogenic sources. NMVOCs impact air quality and climate by contributing to tropospheric photochemistry (e.g., ozone (O3) produc-tion) and aerosol formation. Because of their influence on short-lived climate forcers
5
(e.g., O3, methane (CH4), aerosols), NMVOC reductions could help slow the near-term
rate of climate change (Shindell et al., 2012). Here we evaluate the net climate and air quality effects of anthropogenic NMVOC emission reductions, to inform future policies that may address air quality and climate change.
Tropospheric CH4 and O3 are the largest greenhouse gas contributors to global
10
anthropogenic radiative climate forcing (RF) behind carbon dioxide (CO2) with
abundance-based RFs of 0.48±0.05 W m−2 and 0.35 (−0.1, +0.3) W m−2,
respec-tively (Forster et al., 2007). Tropospheric sulfate (SO24−) has produced a global net RF of−0.40±0.2 W m−2(direct effect only) (Forster et al., 2007). NMVOCs and carbon
monoxide (CO) emissions together have contributed an estimated global mean RF of
15
0.21±0.10 W m−2 due to O3 and CH4 (1750 to 1998) (Shindell et al., 2005; Forster
et al., 2007) and 0.25±0.04 W m−2(1750 to 2000) when SO24−, nitrate (NO
−
3), and CO2
impacts are included (Shindell et al., 2009). More recently, the anthropogenic RF of NMVOC emissions (for 1850–2000) was estimated as 0.090 W m−2(due to changes in O3, CH4, and CO2) as part of the Atmospheric Chemistry and Climate Model
Intercom-20
parison Project (ACCMIP) (Stevenson et al., 2013).
NMVOCs are mainly oxidized by the hydroxyl radical (OH) in the troposphere, pro-ducing peroxyl radicals (RO2) and hydroperoxy radicals (HO2) that then oxidize nitric oxide (NO) to yield O3. Because thousands of NMVOC species with varying lifetimes (from fractions of a day to months) and chemical reactivities have been documented,
25
ACPD
13, 21125–21157, 2013Air quality and RF impacts of VOC
emissions
M. M. Fry et al.
Title Page
Abstract Introduction
Conclusions References
Tables Figures
◭ ◮
◭ ◮
Back Close
Full Screen / Esc
Printer-friendly Version Interactive Discussion
Discussion
P
a
per
|
D
iscussion
P
a
per
|
Discussion
P
a
per
|
Discuss
ion
P
a
per
|
efficient cycling between OH and HO2and hence, O3production, while under low-NOx conditions OH depletes, resulting in NMVOC and CH4 accumulation (Collins et al.,
2002). CH4 is a longer-lived O3 precursor (perturbation lifetime of ∼12 yr) (Forster
et al., 2007) that decreases as tropospheric OH increases (from NMVOC reductions), resulting in long-term O3 decreases, in addition to direct, short-term O3 decreases
5
(Prather et al., 1996; Wild et al., 2001; Fiore et al., 2002; Naik et al., 2005). NMVOC emissions also affect O3 at local to intercontinental scales, given that the lifetimes of tropospheric O3(∼22 days) (Stevenson et al., 2006) and some NMVOCs (e.g., ethane,
benzene) can exceed typical intercontinental transport times (5 to 10 days) (Fiore et al., 2009; West et al., 2009a). NMVOC reductions indirectly influence sulfate aerosol
10
(SO2−
4 ) formation via gas-phase oxidation of sulfur dioxide (SO2) by OH, and
aqueous-phase oxidation of SO2by H2O2or O3(Unger et al., 2006; Leibensperger et al., 2011).
NMVOCs are also precursors to secondary organic aerosols (SOA), and influence NO−3 aerosol abundance via oxidant changes (Ehhalt et al., 2001; Bauer et al., 2007; Hoyle et al., 2009).
15
Previous studies have shown that the RF and global warming potential (GWP) of NMVOCs, like other short-lived O3 precursors, depend on emissions location given their short lifetime in the troposphere (Naik et al., 2005; Berntsen et al., 2006; Forster et al., 2007; and Fry et al., 2012), but few studies quantify the range among different source regions. Fry et al. (2012) calculated 100 yr and 20 yr GWPs (GWP100, GWP20)
20
of 4.8±2.4 to 8.3±1.9 and 15.5±6.8 to 26.5±5.3, respectively, for anthropogenic
NMVOCs from four regions (due to O3, CH4, and SO 2−
4 ) using an ensemble of models.
Collins et al. (2002) also presented GWP100 estimates of 1.8 to 5.5 (−50 to +100 % uncertainty) due to CH4and O3, but for individual anthropogenic NMVOCs globally.
Using global models of chemical transport and radiative transfer, we simulate the air
25
quality and net RF impacts, via changes in O3, CH4, and SO2−
4 , of halving all
ACPD
13, 21125–21157, 2013Air quality and RF impacts of VOC
emissions
M. M. Fry et al.
Title Page
Abstract Introduction
Conclusions References
Tables Figures
◭ ◮
◭ ◮
Back Close
Full Screen / Esc
Printer-friendly Version Interactive Discussion
Discussion
P
a
per
|
D
iscussion
P
a
per
|
Discussion
P
a
per
|
Discuss
ion
P
a
per
|
the inclusion of NMVOCs in multi-gas emission trading schemes for climate. We do not consider reductions in co-emitted species that would be affected by measures to reduce NMVOCs. Future studies could evaluate the impacts of measures on multiple species, or combine the results presented here with those for co-emitted species to determine the net effect of emission control measures (Shindell et al., 2012).
5
2 Methods
2.1 Global chemical transport model
We evaluate the impacts on surface air quality and tropospheric composition of halving anthropogenic NMVOC emissions globally and from 10 regions (North America (NA), South America (SA), Europe (EU), Former Soviet Union (FSU), Southern Africa (AF),
10
India (IN), East Asia (EA), Southeast Asia (SE), Australia and New Zealand (AU), and Middle East and Northern Africa (ME)) (Fig. S1) (Fry et al., 2013). We use the global chemical transport model (CTM), Model for OZone And Related chemical Tracers ver-sion 4 (MOZART-4) (Emmons et al., 2010).
The base and CH4control (where global CH4was reduced by 20 %) simulations are
15
documented in a previous study in which the base simulation was shown to generally agree with surface and tropospheric observations (Fry et al., 2013). Here we simulate new perturbation experiments that reduce regional and global anthropogenic NMVOC emissions by 50 % for 1 July 2004 through 31 December 2005 using MOZART-4 at a horizontal resolution of 1.9◦ latitude×2.5◦ longitude with 56 vertical levels. We use 20
the Coupled Model Intercomparison Project phase 5 (CMIP5) Representative Concen-tration Pathway 8.5 (RCP8.5) emissions inventory for the year 2005 (Riahi et al., 2007, 2011) and global meteorology from the Goddard Earth Observing System Model, ver-sion 5 (GEOS-5) (2004 to 2006) (Rienecker et al., 2008). Anthropogenic emisver-sions include all anthropogenic sectors except biomass burning emissions (Fig. S2), which
25
anthro-ACPD
13, 21125–21157, 2013Air quality and RF impacts of VOC
emissions
M. M. Fry et al.
Title Page
Abstract Introduction
Conclusions References
Tables Figures
◭ ◮
◭ ◮
Back Close
Full Screen / Esc
Printer-friendly Version Interactive Discussion
Discussion
P
a
per
|
D
iscussion
P
a
per
|
Discussion
P
a
per
|
Discuss
ion
P
a
per
|
pogenic sectors, and would likely reduce a suite of emissions simultaneously (Naik et al., 2007).
RCP8.5 NMVOC species are re-speciated to MOZART-4 NMVOC categories, and monthly temporal variation is added to all anthropogenic species and source cate-gories, except for shipping, aircraft, and biomass burning, which already have monthly
5
temporal variation (Fig. S2, Table S1). The Model of Emissions of Gases and Aerosols from Nature (MEGAN) (Guenther et al., 2006) within MOZART-4 calculates the bio-genic emissions of isoprene and monoterpenes (C10H16) (global annual totals of
738 Tg C yr−1 and 107 Tg C yr−1, respectively), while all other natural emissions are from Emmons et al. (2010) (Table S2). The global annual lightning NOx and soil NOx
10
emissions are also calculated by MOZART-4 as 2.4 Tg N yr−1
and 8.0 Tg N yr−1
(Fry et al., 2013).
Because the perturbation simulations are only 1.5 yr in length, we account for the influence of NMVOC emissions on CH4 (via OH), and thus long-term changes in O3 on the decadal timescale of the CH4 perturbation lifetime, using methods from
previ-15
ous studies (Prather et al., 2001; West et al., 2007; Fiore et al., 2009; and Fry et al., 2012). Global CH4 is set to a uniform mixing ratio of 1783 parts per billion by volume (ppbv) (WMO, 2006) in the base and perturbation simulations. The CH4control
simu-lation reduced global CH4to 1426.4 ppbv. The results from the base and CH4control
simulations were used by Fry et al. (2013) to estimate CH4lifetime against loss by
tro-20
pospheric OH (τOH, 11.24 yr), total CH4lifetime based onτOHand CH4loss to soils and
the stratosphere (τtotal, 9.66 yr), and methane’s feedback factor (F, 1.29) by the
meth-ods of Prather et al. (2001) and Stevenson et al. (2013). We use these parameters to estimate the steady-state tropospheric CH4change for each of the NMVOC
perturba-tions. Long-term O3 responses are then calculated offline by scaling O3changes from
25
the CH4 control simulation by the ratio of the global CH4 change from each perturba-tion to that of the CH4control. We add long-term O3 changes to direct short-term O3
ACPD
13, 21125–21157, 2013Air quality and RF impacts of VOC
emissions
M. M. Fry et al.
Title Page
Abstract Introduction
Conclusions References
Tables Figures
◭ ◮
◭ ◮
Back Close
Full Screen / Esc
Printer-friendly Version Interactive Discussion
Discussion
P
a
per
|
D
iscussion
P
a
per
|
Discussion
P
a
per
|
Discuss
ion
P
a
per
|
Since MOZART-4 does not have complete stratospheric chemistry (Emmons et al., 2010), we merge each simulation’s steady-state (short-term+long-term) tropospheric O3distributions (in three dimensions) with the monthly mean stratospheric O3
concen-trations from the AC&C/SPARC (Stratospheric Processes And their Role in Climate) O3 database prepared for CMIP5 (available: http://pcmdi-cmip.llnl.gov/cmip5/forcing.html)
5
(Cionni et al., 2011). By omitting lower stratospheric O3changes between each
pertur-bation and the base simulation, our RF estimates likely underestimate the full effect of NMVOC emissions (Søvde et al., 2011).
MOZART-4 accounts for the tropospheric aerosols SO24−, black carbon (BC), primary and secondary organics, NO−3, dust, and sea salt aerosols (Lamarque et al., 2005).
10
Here we focus on changes in SO24−, NO−3, and SOA, as these species are most directly influenced by anthropogenic NMVOCs, where NMVOCs are precursors to SOA, and changes in oxidants affect all three aerosol species (Barth et al., 2000; Metzger et al., 2002; and Chung and Seinfeld, 2002).
2.2 Radiative transfer model 15
We use the NOAA Geophysical Fluid Dynamics Laboratory (GFDL) standalone ra-diative transfer model (RTM) to perform stratospheric-adjusted net RF calculations (Schwarzkopf and Ramaswamy, 1999; GFDL GAMDT, 2004; and Naik et al., 2005, 2007) as in Fry et al. (2012), with the same updates to long-lived greenhouse gases (Meinshausen et al., 2011) and solar forcing from Fry et al. (2013). Net RF is calculated
20
as the difference between the perturbed and base cases’ simulated monthly mean net radiation fluxes (net shortwave minus net longwave), in each grid cell and month, at the tropopause after stratospheric temperatures have readjusted to radiative equilib-rium (Naik et al., 2007; Saikawa et al., 2009; and Fry et al., 2012). We quantify the net RF from changes in tropospheric steady-state O3, CH4, and SO2−
4 (direct effect only),
25
ACPD
13, 21125–21157, 2013Air quality and RF impacts of VOC
emissions
M. M. Fry et al.
Title Page
Abstract Introduction
Conclusions References
Tables Figures
◭ ◮
◭ ◮
Back Close
Full Screen / Esc
Printer-friendly Version Interactive Discussion
Discussion
P
a
per
|
D
iscussion
P
a
per
|
Discussion
P
a
per
|
Discuss
ion
P
a
per
|
for the year 2005, are also used as input to the RTM simulations, representing monthly mean conditions (Naik et al., 2005).
The RTM currently does not calculate the RF of SOA and NO−3 aerosols. We also do not account for the RF of changes in stratospheric O3, water vapor, the carbon cycle (via O3 and nitrogen deposition, affecting plants), and CO2 (via NMVOC oxidation,
5
which has a minor influence on the net RF of NMVOCs) (Shindell et al., 2009). We do not estimate CO2 forcing here, because this carbon is likely accounted for in CO2 inventories (Daniel and Solomon, 1998). Our RTM simulations also exclude the indirect effects of aerosols on clouds and the internal mixing of aerosols, where aerosol indirect effects are highly uncertain and may account for considerable RF beyond aerosol direct
10
effects (Forster et al., 2007; and Shindell et al., 2013).
3 Tropospheric composition and surface air quality
3.1 Methane and ozone
Global annual average changes in steady-state tropospheric CH4 abundance,
calcu-lated from the tropospheric CH4 loss flux diagnosed from the model (West et al.,
15
2007; Fiore et al., 2009; and Fry et al., 2013), are largest for ME (−7.37 ppbv) and
SA (−5.41 ppbv) reductions among the 10 regions (Table 1). Normalized global CH4
changes range from 0.40 to 1.61 ppbv CH4(Tg C yr− 1
)−1among the 10 regions, and are most sensitive to reductions from AU, SA, SE, and AF. These are regions of low NOx, as discussed below, where reducing NMVOCs lessens OH depletion creating greater
20
global CH4 changes per unit emission. CH4 decreases are least sensitive to NMVOC
reductions from high-NOx regions (EA, EU, FSU). Naik et al. (2005) also found greater global CH4 sensitivities for NOx emissions from low-NOx regions (SE, SA, and AU),
and lower sensitivities for high-NOxregions (EU, FSU).
Global short-term and steady-state surface O3 changes for the 10 regional
reduc-25
ACPD
13, 21125–21157, 2013Air quality and RF impacts of VOC
emissions
M. M. Fry et al.
Title Page
Abstract Introduction
Conclusions References
Tables Figures
◭ ◮
◭ ◮
Back Close
Full Screen / Esc
Printer-friendly Version Interactive Discussion
Discussion
P
a
per
|
D
iscussion
P
a
per
|
Discussion
P
a
per
|
Discuss
ion
P
a
per
|
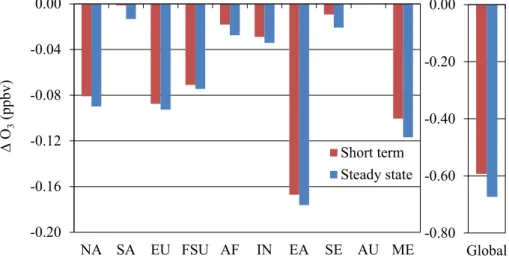
(Fig. S3), but not as strongly correlated as for regional CO reductions (Fry et al., 2013). NMVOC emissions produce long-term O3 decreases that augment short-term
decreases by 13 % for the global reduction, and by 5–18 % for the regional reductions (Fig. 1, Table 2), similar to Fiore et al. (2009) and West et al. (2007). SA, AF, and SE re-ductions provide more substantial long-term global surface O3changes, which account
5
for∼34 to 89 % of steady-state O3decreases.
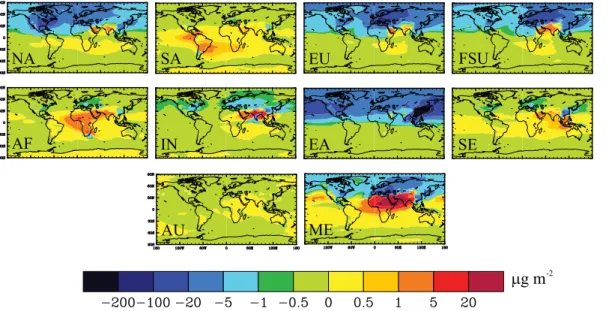
Several of the regional reductions (SA, AF, SE, and AU) in the tropics and South-ern Hemisphere (SH) produce regional to intercontinental tropospheric O3column
in-creases (Fig. 2), as the sensitivity of O3 to NMVOC emissions varies by world region.
All of the regional reductions slow the formation of peroxyacetyl nitrate (PAN), causing
10
PAN to decrease regionally to hemispherically and NOxto increase regionally (Figs. S5, S6, and S7). For SA, AF, SE, and AU, these NOxincreases cause O3column increases
near or downwind of the region. For the other regions, decreases in NMVOCs decrease O3, outweighing the influence of NOx increases via slowing PAN production. Whether NMVOC reductions cause O3to increase or decrease depends on the regional
chem-15
ical state. Here O3-NOx-VOC sensitivity is analyzed using the photochemical indicator
ratios: P(H2O2)/P(HNO3), where P() refers to production rate, (H2O2)/(HNO3), and (H2O2)/(NO2) (Sillman et al., 1997; and Liu et al., 2010). The modeled indicator ratios
show that NOx-sensitive conditions prevail in the tropics and southern midlatitudes,
supporting the finding of tropospheric O3 increases from SA, AF, SE, and AU
reduc-20
tions (Figs. S8, S9, and S10). The northern mid- to high latitudes more frequently exhibit VOC-sensitivity (weaker NOx-sensitivity), particularly from November to March,
resulting in O3decreases.
The global distributions of steady-state surface and tropospheric O3show the
great-est decreases within each reduction region, and smaller decreases intercontinentally
25
(Figs. 2 and S4, and Table S3). Although the largest changes in surface O3 occur within the hemisphere of reduction, given that inter-hemispheric transport takes∼1 yr
(Jacob, 1999), more widespread decreases reflect global long-term O3decreases (via
con-ACPD
13, 21125–21157, 2013Air quality and RF impacts of VOC
emissions
M. M. Fry et al.
Title Page
Abstract Introduction
Conclusions References
Tables Figures
◭ ◮
◭ ◮
Back Close
Full Screen / Esc
Printer-friendly Version Interactive Discussion
Discussion
P
a
per
|
D
iscussion
P
a
per
|
Discussion
P
a
per
|
Discuss
ion
P
a
per
|
centrations in other regions importantly (Tables S3 and S4). In fact, the EA, ME, and EU NMVOC reductions have an impact on US surface O3that is 43 %, 34 %, and 34 %,
respectively, of that from the NA reduction. Two of the low-NOx regions (SA and SE)
experience greater decreases in surface O3 from foreign regions’ NMVOCs than do-mestic NMVOCs.
5
The global annual average steady-state tropospheric O3 burden decreases
by 0.073 Tg O3 (Tg C yr−1)−1 for the global reduction and by
−0.008 to
0.101 Tg O3(Tg C yr− 1
)−1 for the 10 regions (Table 1). Changes in O3 production (∆P)
and export (∆X) are also calculated to determine the importance of long-range trans-port of O3 and its precursors. For most regions, changes in O3 production outside of
10
each reduction region exceed changes in O3export from each region, suggesting that
the influence of NMVOC emissions on the downwind production of O3 has a greater
impact on long-range O3 than the formation and export of O3 from each region (Ta-ble 1). In contrast, for the SA, AF, and SE reductions,∆X is positive due to regional O3 increases. O3 production outside the reduction region decreases for AF and SE,
15
yet increases for SA, as SA causes widespread increases in tropospheric O3 (Fig. 2). For AU, regional tropospheric O3export decreases, while tropospheric O3 production
increases outside AU (Table 1, Fig. 2).
3.2 Aerosols
NMVOC reductions affect the oxidation of SO2, NOx, monoterpenes, and toluene,
in-20
fluencing tropospheric SO24−, NO−3, and SOA concentrations. Reductions from regions near the equator and in drier areas (SA, AF, IN, SE, and ME) produce widespread SO24− increases (Fig. 3), related to increased gas-phase SO2oxidation by OH. In fact, most
of the regional reductions, except EA and AU, produce localized increases in SO2−
4
over drier areas (e.g., Middle East and India). Tropospheric O3 increases from the
25
ACPD
13, 21125–21157, 2013Air quality and RF impacts of VOC
emissions
M. M. Fry et al.
Title Page
Abstract Introduction
Conclusions References
Tables Figures
◭ ◮
◭ ◮
Back Close
Full Screen / Esc
Printer-friendly Version Interactive Discussion
Discussion
P
a
per
|
D
iscussion
P
a
per
|
Discussion
P
a
per
|
Discuss
ion
P
a
per
|
gas-phase oxidation (Unger et al., 2006). Regional reductions in the northern midlat-itudes (NA, EU, FSU, and EA) result in widespread decreases in SO24−, due to the prevalence of clouds and decreased aqueous-phase oxidation (in clouds) of SO2 by
O3 and H2O2 (Figs. 3, S11, and S12). NO−3 changes include both regional increases and decreases. As with SO2−
4 , NO
−
3 increases are expected due to OH increases that
5
are global in scale, yet largest over the source region (Figs. S13 and S14). SOA de-creases globally, influenced not only by oxidant changes, but also by NMVOCs directly, as NMVOCs are precursors to SOA. The largest SOA decreases occur over the re-duction region (Fig. S15). While MOZART-4 accounts for SOA formation through the oxidation of monoterpenes and toluene, more research is needed to more fully model
10
SOA. Current models greatly simplify the physical and chemical processes contributing to SOA burden, and underpredict SOA formation compared to observations (Carlton et al., 2009).
Global annual average SO2−
4 burden decreases for most regional reductions, yet
in-creases for SA, AF, and ME (Table 3). For all 10 regional reductions, global NO−
3 burden
15
increases and global SOA burden decreases. The sums of global burden changes for all 10 regional reductions, for SO24−, NO−3, and SOA, are 95 to 99 % of the burden changes for the global NMVOC reduction, suggesting some dependence on regional conditions and chemistry.
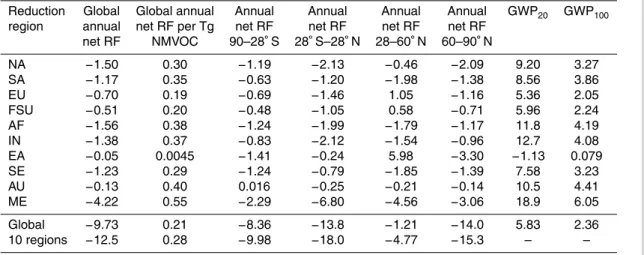
4 Radiative forcing and global warming potential 20
The global annual average net RF is estimated as−9.73 mW m−2 for the global 50 %
NMVOC reduction or 0.21 mW m−2(Tg C yr−1)−1 (Table 4). To compare with other es-timates of anthropogenic forcing, we double this net RF and scale for biomass burn-ing emissions (29.9 % of global anthropogenic NMVOC emissions), which were ex-cluded in the 50 % reductions, yielding a global net RF of −0.0277 W m−2. This ap-25
proach assumes that biomass burning emissions have the same locations and
ACPD
13, 21125–21157, 2013Air quality and RF impacts of VOC
emissions
M. M. Fry et al.
Title Page
Abstract Introduction
Conclusions References
Tables Figures
◭ ◮
◭ ◮
Back Close
Full Screen / Esc
Printer-friendly Version Interactive Discussion
Discussion
P
a
per
|
D
iscussion
P
a
per
|
Discussion
P
a
per
|
Discuss
ion
P
a
per
|
multimodel mean global net RF of NMVOC emissions for 1850–2000 due to O3 and CH4 changes alone (0.057 W m−
2
) (Stevenson et al., 2013). It is also 11 to 13 % of previous CO+NMVOC RF estimates: 0.25±0.04 W m−2 (Shindell et al., 2009) and
0.21±0.1 W m−2 (Shindell et al., 2005; and Forster et al., 2007). The RF of
anthro-pogenic NMVOCs is ∼1.8 % of global net RF of CO2 (1.56 W m− 2
), and among the
5
positive short-lived forcing agents (CO, CH4, NMVOCs, and BC),∼1.8 % of their total
RF (1.57 W m−2) (Forster et al., 2007). Potential reasons for our smaller RF (and GWP) estimates are discussed below.
Across the 10 regions, the global annual average net RF, normalized per unit change in NMVOC emissions, is 0.30±0.15 mW m−2 (Tg C yr−1)−1 (mean ±1 standard devia-10
tion), suggesting variability in the forcings due to different regions’ emissions. The nor-malized RF is most sensitive to NMVOC emissions from regions in the tropics and SH (ME, AU, AF, and IN). Monthly global net RF estimates vary from 0.03 to 3.5 times the annual mean (excluding EA, which has even greater variability), with the greatest negative RFs from June to August (Fig. S17).
15
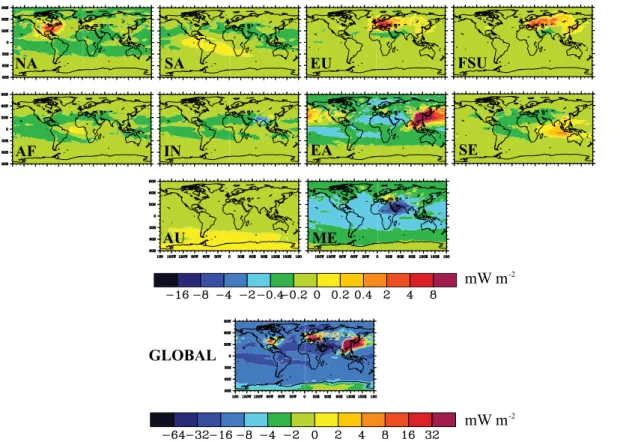
Regional changes in NMVOC emissions cause widespread negative net RFs (cool-ing) across both hemispheres from decreases in global CH4and long-term O3(Fig. 4). Negative RFs over several source regions (e.g., IN, ME) result from short-term O3
de-creases and regional SO24− increases (Fig. 3). Regional positive RFs (warming) arise from regional SO24− decreases (e.g., NA, EU, FSU, EA, and SE reductions) (Fig. 3),
20
which can oppose the negative RFs of O3 decreases, and tropospheric O3increases (e.g., SA, AF, SE, and AU reductions) (Fig. 2). These influences are supported by the distributions of changes in longwave radiation (Fig. S18), dominated by O3 and CH4
changes, and shortwave radiation (Fig. S19), dominated by SO2−
4 . If changes in SOA
and NO−3 were accounted for by the RTM, tropospheric SOA decreases (greater than
25
ACPD
13, 21125–21157, 2013Air quality and RF impacts of VOC
emissions
M. M. Fry et al.
Title Page
Abstract Introduction
Conclusions References
Tables Figures
◭ ◮
◭ ◮
Back Close
Full Screen / Esc
Printer-friendly Version Interactive Discussion
Discussion
P
a
per
|
D
iscussion
P
a
per
|
Discussion
P
a
per
|
Discuss
ion
P
a
per
|
slight regional cooling and warming effects. Globally, NO−3 and SOA would contribute small negative and positive RFs, respectively, to global net RF.
Using the methods of Collins et al. (2013) and Fry et al. (2012, 2013), we calculate GWPs for each reduction as the RF integrated to 20 and 100 yr, normalized by the emissions change, and divided by the equivalent for CO2(Table 4). These GWPs
rep-5
resent short-term contributions from SO2−
4 and O3 (assumed constant over one year
and zero thereafter), and long-term contributions of CH4 and O3(responding and
de-caying with the CH4 perturbation lifetime of 12.48 yr) (Fry et al., 2013). The long-term
O3RF component is calculated by scaling the O3RF from the CH4control simulation by the ratio of the long-term O3 burden change from each perturbation to that of the CH4
10
control. Short-term O3RF is the difference between steady-state O3RF (simulated by
the RTM) and long-term O3RF.
GWP20 and GWP100 are estimated as 5.83 and 2.36, respectively, for the global
re-duction, and−1.13 to 18.9 and 0.079 to 6.05 among the 10 regions, suggesting strong
dependence on emission location, consistent with the normalized net RFs (Fig. 5).
15
GWP20and GWP100are greatest for ME, which also had the largest net RF sensitivity,
and smallest for EA, because of the nearly equivalent (opposing) short- and long-term effects. SA, SE, and AU reductions yield the largest (negative) short-term components for GWP20 and GWP100 due to the combined effect of SO
2−
4 and tropospheric O3
in-creases, which act in the opposite direction to the long-term component. Uncertainty
20
in NMVOC GWPs is based on the spread across an ensemble of global CTMs from Fry et al. (2012) (±1 standard deviation, GWP20:±6.0 and GWP100:±2.1), but do not
account for the full uncertainty, as additional forcings could change net RF and GWP estimates.
Our GWPs (and RFs) do not include the forcing from CO2as NMVOCs oxidize, since
25
carbon emissions are often accounted for in CO2inventories (Fuglestvedt et al., 1996;
Daniel and Solomon, 1998; and Collins et al., 2002). Including CO2 forcing, however, may provide a more complete accounting of the effects of NMVOCs, increasing each GWP20 and GWP100 estimate by 3.67 (44 g CO2mol−
1
ACPD
13, 21125–21157, 2013Air quality and RF impacts of VOC
emissions
M. M. Fry et al.
Title Page
Abstract Introduction
Conclusions References
Tables Figures
◭ ◮
◭ ◮
Back Close
Full Screen / Esc
Printer-friendly Version Interactive Discussion
Discussion
P
a
per
|
D
iscussion
P
a
per
|
Discussion
P
a
per
|
Discuss
ion
P
a
per
|
NMVOC molecule), based on the global annual average molecular weight and num-ber of carbons per molecule for anthropogenic NMVOC emissions. This increases the global GWP20 and GWP100 by 63 % and 155 %, respectively, and makes all regional
GWP20and GWP100estimates positive.
The GWP20 and GWP100estimates for NA, EU, and IN (South Asia) reductions are
5
approximately 32 to 41 %, 61 to 69 %, and 50 to 52 % lower than the multimodel mean estimates of Fry et al. (2012) (Table S10). EA GWP20 and GWP100 estimates, being near zero, also greatly contrast with Fry et al. (2012). Here total NMVOC/NOx
emis-sions ratios are 57 % greater globally and in NA than the multimodel mean ratios, partly due to greater biogenic NMVOC emission sources (calculated online in MOZART-4).
10
In EU, EA, and IN, the total NMVOC/NOx emissions are closer to the multimodel mean ratios: 4 % and 9 % (EU and EA, respectively) less and 8 % (IN) greater than those of the multimodel mean (Table S11). Global O3 burden responses (in Tg O3
(Tg C yr−1)−1) are 27 % to 51 % less than those in Fry et al. (2012), likely due to the greater NMVOC/NOx emission ratios in this study, which would suggest less
sensi-15
tivity to NMVOC emissions, but differences in the representations of NMVOCs and oxidation chemistry among models may also contribute to these differences. Global SO24− responses (in Gg SO24− (Tg C yr−1)−1) also highly vary, more commonly causing increases in SO24− compared to the decreases in Fry et al. (2012) (Table S12). Collins et al. (2002) calculated GWP100 estimates for individual NMVOC species (due to CH4
20
and O3 only) ranging from 1.9 to 5.5 (−50 % to 100 % uncertainty), which are more
similar to the GWP100magnitudes estimated here. While our NMVOC GWP estimates
consider all anthropogenic NMVOCs together and are derived from only one CTM and RTM, they represent emissions from a greater number of regions, including the tropics and extra-tropics.
ACPD
13, 21125–21157, 2013Air quality and RF impacts of VOC
emissions
M. M. Fry et al.
Title Page
Abstract Introduction
Conclusions References
Tables Figures
◭ ◮
◭ ◮
Back Close
Full Screen / Esc
Printer-friendly Version Interactive Discussion
Discussion
P
a
per
|
D
iscussion
P
a
per
|
Discussion
P
a
per
|
Discuss
ion
P
a
per
|
5 Summary
Reducing NMVOC emissions provides regional to global benefits to air quality and climate. Halving anthropogenic NMVOCs from each region creates widespread small negative net RFs across both hemispheres from global CH4 and long-term O3 de-creases. RF is also negative near several source regions (e.g., IN, ME) due to regional
5
SO24−increases and short-term O3decreases. Regional small positive RFs correspond
to regional SO24− decreases (e.g., NA, EU, FSU, EA, and SE) and tropospheric O3
in-creases (e.g., SA, AF, SE, and AU).
The present-day NMVOC RF is estimated as 0.0277 W m−2, or ∼1.8 % of CO2
RF since the preindustrial. Our RF, GWP20, and GWP100 estimates for the NA, EA,
10
EU, and IN reductions are also lower than the multimodel mean estimates of Fry et al. (2012), due to differences in O3-NOx-VOC sensitivities and SO
2−
4 responses,
and in particular, because of regional O3 increases and SO 2−
4 decreases for some
regions that oppose the long-term cooling. Considerable variability in the global net RF, GWP20, and GWP100estimates among regions suggests a strong dependence on
15
emission location: 0.21 mW m−2 (Tg C yr−1)−1, 5.83, and 2.36 for the global reduction, and 0.30±0.15 mW m−2(Tg C yr−1)−1,−1.13 to 18.9, and 0.079 to 6.05 for the 10
re-gions. GWP20 and GWP100are greatest for regions in the tropics and SH (i.e., ME, IN, and AF) and less for regions in the northern midlatitudes (i.e., EU and FSU). The low-est GWP20 and GWP100 estimates are for EA, given the nearly equivalent (opposing)
20
short- and long-term effects. Including additional forcings beyond CH4, O3, and SO2−
4
would likely change RF and GWP estimates.
Variability in global annual average tropospheric CH4, O3, and SO 2−
4 responses
contribute to the RF and GWP differences seen among regions: 0.81 ppbv CH4 (Tg C yr−1)−1, 0.073 Tg O3 (Tg C yr−
1
)−1, and 0.33 Gg SO24− (Tg C yr−1)−1 for the
25
global reduction, and 0.40 to 1.61 ppbv CH4 (Tg C yr− 1
)−1, −0.008 to 0.101 Tg O3
(Tg C yr−1)−1, and −0.21 to 1.01 Gg SO24− (Tg C yr
−1
Sev-ACPD
13, 21125–21157, 2013Air quality and RF impacts of VOC
emissions
M. M. Fry et al.
Title Page
Abstract Introduction
Conclusions References
Tables Figures
◭ ◮
◭ ◮
Back Close
Full Screen / Esc
Printer-friendly Version Interactive Discussion
Discussion
P
a
per
|
D
iscussion
P
a
per
|
Discussion
P
a
per
|
Discuss
ion
P
a
per
|
eral regions with high GWPs are low-NOx regions (AF and AU), which have stronger CH4sensitivities to NMVOC reductions, and weak increases or decreases in SO2−
4 .
Anthropogenic NMVOC emissions overall contribute∼5.1 % (1.9 ppbv) to global
an-nual average steady-state surface O3, by doubling the change from the 50 % global
NMVOC reduction (−0.67 ppbv) and scaling for biomass burning emissions. Some re-5
gional reductions contribute importantly to surface O3 in other regions, such as EA,
ME, and EU, which impact US surface O3 by 43 %, 34 %, and 34 %, respectively, of
that from NA emissions. NMVOC emission reductions mostly have a greater impact on downwind O3production than the formation and export of O3from each source
re-gion. Long-term surface O3changes (via CH4) impact air quality globally, and for most
10
regions add 5–18 % to short-term changes.
In this study, the air quality and RF impacts are derived from one CTM and RTM, which limits our ability to capture a more complete range of CH4, O3, aerosols, and RF
responses, as a model ensemble would. Previous studies have shown a large model spread in CH4, O3, and SO
2−
4 responses to regional NMVOC emissions (Collins et al.,
15
2002; Fiore et al., 2009; and Fry et al., 2012). Future work could examine the emissions inventories of NMVOCs and other species, as they are fairly uncertain among models (Berntsen et al., 2005).
Other limitations include only accounting for CH4, O3, and SO 2−
4 (direct effect only)
in our net RF and GWP estimates, which may affect the magnitude of our estimates
20
and variability among regions. Forcing mechanisms not accounted for include NO−3, SOA, stratospheric O3, water vapor, the carbon cycle (via O3and nitrogen deposition),
the indirect effects of aerosols, and the internal mixing of aerosols. Future research could include these additional forcings and their uncertainty. The contribution of anthro-pogenic NMVOCs to SOA, in particular, is fairly uncertain, and often underpredicted by
25
ACPD
13, 21125–21157, 2013Air quality and RF impacts of VOC
emissions
M. M. Fry et al.
Title Page
Abstract Introduction
Conclusions References
Tables Figures
◭ ◮
◭ ◮
Back Close
Full Screen / Esc
Printer-friendly Version Interactive Discussion
Discussion
P
a
per
|
D
iscussion
P
a
per
|
Discussion
P
a
per
|
Discuss
ion
P
a
per
|
NMVOCs, emission control measures would likely affect co-emitted species. Our re-sults can be combined with those for co-emitted pollutants to evaluate the net effect of measures affecting multiple pollutants. Full climate responses also could be evaluated, as in Shindell and Faluvegi (2009).
These findings of high variability in GWPs among regions for NMVOCs contrast with
5
our earlier findings for CO, with little variability in GWPs among source regions (Fry et al., 2013). While it would be possible to include CO in multi-gas emissions trading schemes using a single GWP, with little error, using a single GWP for NMVOCs would cause significant error. Instead, international climate agreements could consider includ-ing NMVOCs in multi-gas emissions tradinclud-ing schemes usinclud-ing GWPs that are specific to
10
each region. Although NMVOCs are a small climate forcing agent, this study motivates reductions in NMVOC emissions as part of future coordinated policies addressing air quality and climate change (Rypdal et al., 2005, 2009; Jackson et al., 2009; Shindell et al., 2012; and Fry et al., 2013).
Supplementary material related to this article is available online at 15
http://www.atmos-chem-phys-discuss.net/13/21125/2013/ acpd-13-21125-2013-supplement.pdf.
Acknowledgements. This research has been funded by the US EPA under the Science to Achieve Results (STAR) Graduate Fellowship Program (M. Fry), and by the US EPA Office of Air Quality Planning and Standards. EPA has not officially endorsed this report, and the views
20
expressed herein may not reflect the views of EPA. We acknowledge contributions from V. Naik (UCAR/NOAA GFDL) to the methodology and development of the manuscript. We also thank L. Emmons (UCAR) for observation comparison tools, L. Emmons and S. Walters (UCAR) for MOZART-4 guidance, and W. J. Collins (University of Reading) for GWP calculation methodol-ogy.
ACPD
13, 21125–21157, 2013Air quality and RF impacts of VOC
emissions
M. M. Fry et al.
Title Page
Abstract Introduction
Conclusions References
Tables Figures
◭ ◮
◭ ◮
Back Close
Full Screen / Esc
Printer-friendly Version Interactive Discussion
Discussion
P
a
per
|
D
iscussion
P
a
per
|
Discussion
P
a
per
|
Discuss
ion
P
a
per
|
References
Barth, M. C., Rasch, P. J., Kiehl, J. T., Benkovitz, C. M., and Schwartz, S. E.: Sulfur chemistry in the national center for atmospheric research community climate model: description, eval-uation, features, and sensitivity to aqueous chemistry, J. Geophys. Res., 105, 1387–1415, 2000.
5
Bauer, S. E., Koch, D., Unger, N., Metzger, S. M., Shindell, D. T., and Streets, D. G.: Nitrate aerosols today and in 2030: a global simulation including aerosols and tropospheric ozone, Atmos. Chem. Phys., 7, 5043–5059, doi:10.5194/acp-7-5043-2007, 2007.
Berntsen, T. K., Fuglestvedt, J. S., Joshi, M. M., Shine, K. P., Stuber, N., Ponater, M., Sausen, R., Hauglustaine, D. A., and Li, L.: Response of climate to regional
emis-10
sions of ozone precursors: sensitivities and warming potentials, Tellus B, 57, 283–304, doi:10.1111/j.1600-0889.2005.00152.x, 2005.
Berntsen, T. K., Fuglestvedt, J., Myhre, G., Stordal, F., and Bergle, T. F.: Abatement of green-house gases: does location matter?, Climatic Change, 74, 377–411, doi:10.1007/s10584-006-0433-4, 2006.
15
Carlton, A. G., Wiedinmyer, C., and Kroll, J. H.: A review of Secondary Organic Aerosol (SOA) formation from isoprene, Atmos. Chem. Phys., 9, 4987–5005, doi:10.5194/acp-9-4987-2009, 2009.
Chung, S. and Seinfeld, J.: Global distribution and climate forcing of carbonaceous aerosols, J. Geophys. Res., 107, 4407, doi:10.1029/2001JD001397, 2002.
20
Cionni, I., Eyring, V., Lamarque, J. F., Randel, W. J., Stevenson, D. S., Wu, F., Bodeker, G. E., Shepherd, T. G., Shindell, D. T., and Waugh, D. W.: Ozone database in support of CMIP5 simulations: results and corresponding radiative forcing, Atmos. Chem. Phys., 11, 11267– 11292, doi:10.5194/acp-11-11267-2011, 2011.
Collins, W. J., Derwent, R. G., Johnson, C. E., and Stevenson, D. S.: The oxidation of organic
25
compounds in the troposphere and their global warming potentials, Climatic Change, 52, 453–479, doi:10.1023/A:1014221225434, 2002.
Collins, W. J., Fry, M. M., Yu, H., Fuglestvedt, J. S., Shindell, D. T., and West, J. J.: Global and regional temperature-change potentials for near-term climate forcers, Atmos. Chem. Phys., 13, 2471–2485, doi:10.5194/acp-13-2471-2013, 2013.
30
ACPD
13, 21125–21157, 2013Air quality and RF impacts of VOC
emissions
M. M. Fry et al.
Title Page
Abstract Introduction
Conclusions References
Tables Figures
◭ ◮
◭ ◮
Back Close
Full Screen / Esc
Printer-friendly Version Interactive Discussion
Discussion
P
a
per
|
D
iscussion
P
a
per
|
Discussion
P
a
per
|
Discuss
ion
P
a
per
|
Ehhalt, D., Prather, M., Dentener, F., Derwent, R., Dlugokencky, E., Holland, E., Isaksen, I., Katima, J., Kirchhoff, V., Matson, P., Midgley, P., and Wang, M.: Atmospheric chemistry and greenhouse gases, in: Climate Change 2001: The Scientific Basis, Contribution of Working Group I to the Third Assessment Report of the Intergovernmental Panel on Climate Change, edited by: Houghton, J. T., Ding, Y., Griggs, D. J., Noguer, M., van der Linden, P. J., Dai, X.,
5
Maskell, K., and Johnson, C. A., Cambridge University Press, Cambridge, UK, 2001. Emmons, L. K., Walters, S., Hess, P. G., Lamarque, J.-F., Pfister, G. G., Fillmore, D., Granier, C.,
Guenther, A., Kinnison, D., Laepple, T., Orlando, J., Tie, X., Tyndall, G., Wiedinmyer, C., Baughcum, S. L., and Kloster, S.: Description and evaluation of the Model for Ozone and Related chemical Tracers, version 4 (MOZART-4), Geosci. Model Dev., 3, 43–67,
10
doi:10.5194/gmd-3-43-2010, 2010.
Fiore, A. M., Jacob, D. J., Field, B. D., Streets, D. G., Fernandes, S. D., and Jang, C.: Linking ozone pollution and climate change: the case for controlling methane, Geophys. Res. Lett., 29, 1919, doi:10.1029/2002GL015601, 2002.
Fiore, A. M., Dentener, F. J., Wild, O., Cuvelier, C., Schultz, M. G., Hess, P., Textor, C., Schulz,
15
M., Doherty, R. M., Horowitz, L. W., MacKenzie, I. A., Sanderson, M. G., Shindell, D. T., Stevenson, D. S., Szopa, S., Van Dingenen, R., Zeng, G., Atherton, C., Bergmann, D., Bey, I., Carmichael, G., Collins, W. J., Duncan, B. N., Faluvegi, G., Folberth, G., Gauss, M., Gong, S., Hauglustaine, D., Holloway, T., Isaksen, I. S. A., Jacob, D. J., Jonson, J. E., Kaminski, J. W., Keating, T. J., Lupu, A., Marmer, E., Montanaro, V., Park, R. J., Pitari, G., Pringle,
20
K. J., Pyle, J. A., Schroeder, S., Vivanco, M. G., Wind, P., Wojcik, G., Wu, S., and Zuber, A.: Multimodel estimates of intercontinental source–receptor relationships for ozone pollution, J. Geophys. Res., 114, D04301, doi:10.1029/2008JD010816, 2009.
Forster, P., Ramaswamy, V., Artaxo, P., Berntsen, T., Betts, R., Fahey, D. W., Haywood, J., Lean, J., Lowe, D. C., Myhre, G., Nganga, J., Prinn, R., Raga, G., Schulz, M., and Van
Dor-25
land, R.: Changes in atmospheric constituents and in radiative forcing, in: Climate Change 2007: the Physical Science Basis, Contribution of Working Group I to the Fourth Assessment Report of the Intergovernmental Panel on Climate Change, edited by: Solomon, S., Qin, D., Manning, M., Chen, Z., Marquis, M., Averyt, K. B., Tignor, M., and Miller, H. L., Cambridge Univ. Press, Cambridge, UK, 129–234, 2007.
30
pre-ACPD
13, 21125–21157, 2013Air quality and RF impacts of VOC
emissions
M. M. Fry et al.
Title Page
Abstract Introduction
Conclusions References
Tables Figures
◭ ◮
◭ ◮
Back Close
Full Screen / Esc
Printer-friendly Version Interactive Discussion
Discussion
P
a
per
|
D
iscussion
P
a
per
|
Discussion
P
a
per
|
Discuss
ion
P
a
per
|
cursor emissions from four world regions on tropospheric composition and radiative climate forcing, J. Geophys. Res., 117, D07306, doi:10.1029/2011JD017134, 2012.
Fry, M. M., Schwarzkopf, M. D., Adelman, Z., Naik, V., Collins, W. J., and West, J. J.: Net radiative forcing and air quality responses to regional CO emission reductions, Atmos. Chem. Phys., 13, 5381–5399, doi:10.5194/acp-13-5381-2013, 2013.
5
Fuglestvedt, J. S., Isaksen, I. S. A., and Wang, W.-C.: Estimates of indirect global warming potentials for CH4, CO, and NOx, Climatic Change, 34, 405–437, 1996.
GFDL Global Atmospheric Model Development Team (GAMDT): The new GFDL global atmo-sphere and land model AM2-LM2: evaluation with prescribed SST simulations, J. Climate, 17, 4641–4673, 2004.
10
Guenther, A., Karl, T., Harley, P., Wiedinmyer, C., Palmer, P. I., and Geron, C.: Estimates of global terrestrial isoprene emissions using MEGAN (Model of Emissions of Gases and Aerosols from Nature), Atmos. Chem. Phys., 6, 3181–3210, doi:10.5194/acp-6-3181-2006, 2006.
Hoyle, C. R., Myhre, G., Berntsen, T. K., and Isaksen, I. S. A.: Anthropogenic influence on SOA
15
and the resulting radiative forcing, Atmos. Chem. Phys., 9, 2715–2728, doi:10.5194/acp-9-2715-2009, 2009.
Ito, A., Sillman, S., and Penner, J. E.: Effects of additional nonmethane volatile organic com-pounds, organic nitrates, and direct emissions of oxygenated organic species on global tro-pospheric chemistry, J. Geophys. Res., 112, D06309, doi:10.1029/2005JD006556, 2007.
20
Jackson, S. C.: Parallel pursuit of near-term and long-term climate mitigation, Science, 326, 5952, 526–527, doi:10.1126/science.1177042, 2009.
Jacob, D. J.: Introduction to Atmospheric Chemistry, Princeton University Press, Princeton, NJ, USA, 52–53, 1999.
Lamarque, J.-F., Kiehl, J. T., Hess, P. G., Collins, W. D., Emmons, L. K., Ginoux, P., Luo, C., and
25
Tie, X. X.: Response of a coupled chemistry-climate model to changes in aerosol emissions: global impact on the hydrological cycle and the tropospheric burdens of OH, ozone, and NOx, Geophys. Res. Lett., 32, L16809, doi:10.1029/2005GL023419, 2005.
Leibensperger, E. M., Mickley, L. J., Jacob, D. J., and Barrett, S. R. H.: Intercontinental influence of NOxand CO emissions on particulate matter air quality, Atmos. Environ., 45, 3318–3324,
30
doi:10.1016/j.atmosenv.2011.02.023, 2011.
ACPD
13, 21125–21157, 2013Air quality and RF impacts of VOC
emissions
M. M. Fry et al.
Title Page
Abstract Introduction
Conclusions References
Tables Figures
◭ ◮
◭ ◮
Back Close
Full Screen / Esc
Printer-friendly Version Interactive Discussion
Discussion
P
a
per
|
D
iscussion
P
a
per
|
Discussion
P
a
per
|
Discuss
ion
P
a
per
|
Process analysis and sensitivity of ozone and particulate matter to precursor emissions, Atmos. Environ., 44, 3719–3727, 2010.
Meinshausen, M., Smith, S. J., Calvin, K. V., Daniel, J. S., Kainuma, M. L. T., Lamarque, J.-F., Matsumoto, K., Montzka, S. A., Raper, S. C. B., Riahi, K., Thomson, A. M., Velders, G. J. M., and van Vuuren, D.: The RCP greenhouse gas concentrations and their extension from 1765
5
to 2300, Climatic Change (Special Issue), 109, 213–241, doi:10.1007/s10584-011-0156-z, 2011.
Metzger, S., Dentener, F., Pandis, S., and Lelieveld, J.: Gas/aerosol partitioning: 1. A computa-tionally efficient model, J. Geophys. Res., 107, 4312, doi:10.1029/2001JD001102, 2002. Naik, V., Mauzerall, D., Horowitz, L., Schwarzkopf, M. D., Ramaswamy, V., and
Oppen-10
heimer, M.: Net radiative forcing due to changes in regional emissions of tropospheric ozone precursors, J. Geophys. Res., 110, D24306, doi:10.1029/2005JD005908, 2005.
Naik, V., Mauzerall, D. L., Horowitz, L. W., Schwarzkopf, M. D., Ramaswamy, V., and Oppen-heimer, M.: On the sensitivity of radiative forcing from biomass burning aerosols and ozone to emission location, Geophys. Res. Lett., 34, L03818, doi:10.1029/2006GL028149, 2007.
15
Prather, M. J.: Time scales in atmospheric chemistry: theory, GWPs for CH4 and CO, and runaway growth, Geophys. Res. Lett., 23, 2597–2600, doi:10.1029/96GL02371, 1996. Prather, M., Ehhalt, D., Dentener, F., Derwent, R. G., Dlugokencky, E., Holland, E.,
Isak-sen, I. S. A., Katima, J., Kirchhoff, V., Matson, P., Midgley, P. M., and Wang, M.: Climate Change 2001: The Scientific Basis, Atmospheric Chemistry and Greenhouse Gases, Chap.
20
4, Cambridge Univ. Press, New York, USA, 239–287, 2001.
Riahi, K., Gruebler, A., and Nakicenovic, N.: Scenarios of long-term socio-economic and en-vironmental development under climate stabilization, Technol. Forecast. Soc., 74, 887–935, 2007.
Riahi, K., Rao, S., Krey, V., Cho, C., Chirkov, V., Fischer, G., Kindermann, G., Nakicenovic, N.,
25
and Rafaj, P.: RCP 8.5 – a scenario of comparatively high greenhouse gas emissions, Cli-matic Change, 109, 33–57, doi:10.1007/s10584-011-0149-y, 2011.
Rienecker, M. M., Suarez, M. J., Todling, R., Bacmeister, J., Takacs, L., Liu, H.-C., Gu, W., Sienkiewicz, M., Koster, R. D., Gelaro, R., Stajner, I., and Nielsen, J. E.: The GEOS-5 Data Assimilation System – Documentation of versions 5.0.1, 5.1.0, and 5.2.0, NASA Tech.
30
ACPD
13, 21125–21157, 2013Air quality and RF impacts of VOC
emissions
M. M. Fry et al.
Title Page
Abstract Introduction
Conclusions References
Tables Figures
◭ ◮
◭ ◮
Back Close
Full Screen / Esc
Printer-friendly Version Interactive Discussion
Discussion
P
a
per
|
D
iscussion
P
a
per
|
Discussion
P
a
per
|
Discuss
ion
P
a
per
|
Rypdal, K., Berntsen, T., Fuglestvedt, J. S., Aunan, K., Torvanger, A., Stordal, F., Pacyna, J. M., and Nygaard, L. P.: Tropospheric ozone and aerosols in climate agreements: scientific and political challenges, Environ. Sci. Policy, 8, 29–43, doi:10.1016/j.envsci.2004.09.003, 2005. Rypdal, K., Rive, N., Berntsen, T., Fagerli, H., Klimont, Z., Mideksa, T. K., and Fuglestvedt, J. S.:
Climate and air quality-driven scenarios of ozone and aerosol precursor abatement, Environ.
5
Sci. Policy, 12, 855–869, doi:10.1016/j.envsci.2009.08.002, 2009.
Saikawa, E., Naik, V., Horowitz, L. W., Liu, J. F., and Mauzerall, D. L.: Present and po-tential future contributions of sulfate, black and organic carbon aerosols from China to global air quality, premature mortality and radiative forcing, Atmos. Environ., 43, 2814–2822, doi:10.1016/j.atmosenv.2009.02.017, 2009.
10
Schwarzkopf, M. D. and Ramaswamy, V.: Radiative effects of CH4, N2O, halocarbons and the foreign-broadened H2O continuum: a GCM experiment, J. Geophys. Res., 104, 9467–9488, doi:10.1029/1999JD900003, 1999.
Shindell, D. T., Faluvegi, G., Bell, N., and Schmidt, G. A.: An emissions-based view of climate forcing by methane and tropospheric ozone, Geophys. Res. Lett., 32, L04803,
15
doi:10.1029/2004GL021900, 2005.
Shindell, D. and Faluvegi, G.: Climate response to regional radiative forcing during the twentieth century, Nat. Geosci., 2, 294–300, doi:10.1038/NGEO473, 2009.
Shindell, D. T., Faluvegi, G., Koch, D. M., Schmidt, G. A., Unger, N., and Bauer, S. E.: Improved attribution of climate forcing to emissions, Science, 326, 716–718,
20
doi:10.1126/science.1174760, 2009.
Shindell, D., Kuylenstierna, J. C. I., Vignati, E., van Dingenen, R., Amann, M., Klimont, Z., Anenberg, S. C., Muller, N., Janssens-Maenhout, G., Raes, F., Schwartz, J., Faluvegi, G., Pozzoli, L., Kupiainen, K., Höglund-Isaksson, L., Emberson, L., Streets, D., Ramanathan, V., Hicks, K., Oanh, N. T. K., Milly, G., Williams, M., Demkine, V., and Fowler, D.: Simultaneously
25
mitigating near-term climate change and improving human health and food security, Science, 335, 183–189, doi:10.1126/science.1210026, 2012.
Shindell, D. T., Lamarque, J.-F., Schulz, M., Flanner, M., Jiao, C., Chin, M., Young, P. J., Lee, Y. H., Rotstayn, L., Mahowald, N., Milly, G., Faluvegi, G., Balkanski, Y., Collins, W. J., Conley, A. J., Dalsoren, S., Easter, R., Ghan, S., Horowitz, L., Liu, X., Myhre, G.,
Na-30
ACPD
13, 21125–21157, 2013Air quality and RF impacts of VOC
emissions
M. M. Fry et al.
Title Page
Abstract Introduction
Conclusions References
Tables Figures
◭ ◮
◭ ◮
Back Close
Full Screen / Esc
Printer-friendly Version Interactive Discussion
Discussion
P
a
per
|
D
iscussion
P
a
per
|
Discussion
P
a
per
|
Discuss
ion
P
a
per
|
climate simulations, Atmos. Chem. Phys., 13, 2939–2974, doi:10.5194/acp-13-2939-2013, 2013.
Sillman, S., He, D., Cardelino, C., and Imhoff, R. E.: The use of photochemical indicators to evaluate ozone-NOx-hydrocarbon sensitivity: case studies from Atlanta, New York, and Los Angeles, J. Air Waste Manage., 47, 1030–1040, 1997.
5
Søvde, O. A., Hoyle, C. R., Myhre, G., and Isaksen, I. S. A.: The HNO3 forming branch of the HO2 +NO reaction: pre-industrial-to-present trends in atmospheric species and radiative forcings, Atmos. Chem. Phys., 11, 8929–8943, doi:10.5194/acp-11-8929-2011, 2011. Stevenson, D. S., Dentener, F. J., Schultz, M. G., Ellingsen, K., van Noije, T. P. C., Wild, O.,
Zeng, G., Amann, M., Atherton, C. S., Bell, N., Bergmann, D. J., Bey, I., Butler, T.,
Co-10
fala, J., Collins, W. J., Derwent, R. G., Doherty, R. M., Drevet, J., Eskes, H. J., Fiore, A. M., Gauss, M., Hauglustaine, D. A., Horowitz, L. W., Isaksen, I. S. A., Krol, M. C., Lamarque, J.-F., Lawrence, M. G., Montanaro, V., Müller, J.-J.-F., Pitari, G., Prather, M. J., Pyle, J. A., Rast, S., Rodriguez, J. M., Sanderson, M. G., Savage, N. H., Shindell, D. T., Strahan, S. E., Sudo, K., and Szopa, S.: Multimodel ensemble simulations of present-day and near-future tropospheric
15
ozone, J. Geophys. Res., 111, D08301, doi:10.1029/2005JD006338, 2006.
Stevenson, D. S., Young, P. J., Naik, V., Lamarque, J.-F., Shindell, D. T., Voulgarakis, A., Skeie, R. B., Dalsoren, S. B., Myhre, G., Berntsen, T. K., Folberth, G. A., Rumbold, S. T., Collins, W. J., MacKenzie, I. A., Doherty, R. M., Zeng, G., van Noije, T. P. C., Strunk, A., Bergmann, D., Cameron-Smith, P., Plummer, D. A., Strode, S. A., Horowitz, L., Lee, Y. H.,
20
Szopa, S., Sudo, K., Nagashima, T., Josse, B., Cionni, I., Righi, M., Eyring, V., Conley, A., Bowman, K. W., Wild, O., and Archibald, A.: Tropospheric ozone changes, radiative forcing and attribution to emissions in the Atmospheric Chemistry and Climate Model Intercom-parison Project (ACCMIP), Atmos. Chem. Phys., 13, 3063–3085, doi:10.5194/acp-13-3063-2013, 2013.
25
Unger, N., Shindell, D. T., Koch, D. M., and Streets, D. G.: Cross influences of ozone and sulfate precursor emissions changes on air quality and climate, P. Natl. Acad. Sci. USA, 103, 4377– 4380, doi:10.1073/pnas.0508769103, 2006.
Volkamer, R., Jimenez, J. L., San Martini, F., Dzepina, K., Zhang, Q., Salcedo, D., Molina, L. T., Worsnop, D. R., and Molina, M. J.: Secondary organic aerosol formation from
anthro-30
ACPD
13, 21125–21157, 2013Air quality and RF impacts of VOC
emissions
M. M. Fry et al.
Title Page
Abstract Introduction
Conclusions References
Tables Figures
◭ ◮
◭ ◮
Back Close
Full Screen / Esc
Printer-friendly Version Interactive Discussion
Discussion
P
a
per
|
D
iscussion
P
a
per
|
Discussion
P
a
per
|
Discuss
ion
P
a
per
|
West, J. J., Fiore, A. M., Naik, V., Horowitz, L. W., Schwarzkopf, M. D., and Mauzerall, D. L.: Ozone air quality and radiative forcing consequences of changes in ozone precursor emis-sions, Geophys. Res. Lett., 34, L06806, doi:10.1029/2006GL029173, 2007.
West, J. J., Naik, V., Horowitz, L. W., and Fiore, A. M.: Effect of regional precursor emission controls on long-range ozone transport – Part 1: Short-term changes in ozone air quality,
5
Atmos. Chem. Phys., 9, 6077–6093, doi:10.5194/acp-9-6077-2009, 2009a.
West, J. J., Naik, V., Horowitz, L. W., and Fiore, A. M.: Effect of regional precursor emission controls on long-range ozone transport – Part 2: Steady-state changes in ozone air quality and impacts on human mortality, Atmos. Chem. Phys., 9, 6095–6107, doi:10.5194/acp-9-6095-2009, 2009b.
10
Wild, O., Prather, M. J., and Akimoto, H.: Indirect long-term global radiative cooling from NOx emissions, Geophys. Res. Lett., 28, 1719–1722, doi:10.1029/2000GL012573, 2001.
World Meteorological Organization (WMO): WMO Greenhouse Gas Bulletin: The State of Greenhouse Gases in the Atmosphere using Global Observations through 2005, Bulletin No. 1: March 2006, 2006.
ACPD
13, 21125–21157, 2013Air quality and RF impacts of VOC
emissions
M. M. Fry et al.
Title Page
Abstract Introduction
Conclusions References
Tables Figures
◭ ◮
◭ ◮
Back Close
Full Screen / Esc
Printer-friendly Version Interactive Discussion
Discussion
P
a
per
|
D
iscussion
P
a
per
|
Discussion
P
a
per
|
Discuss
ion
P
a
per
|
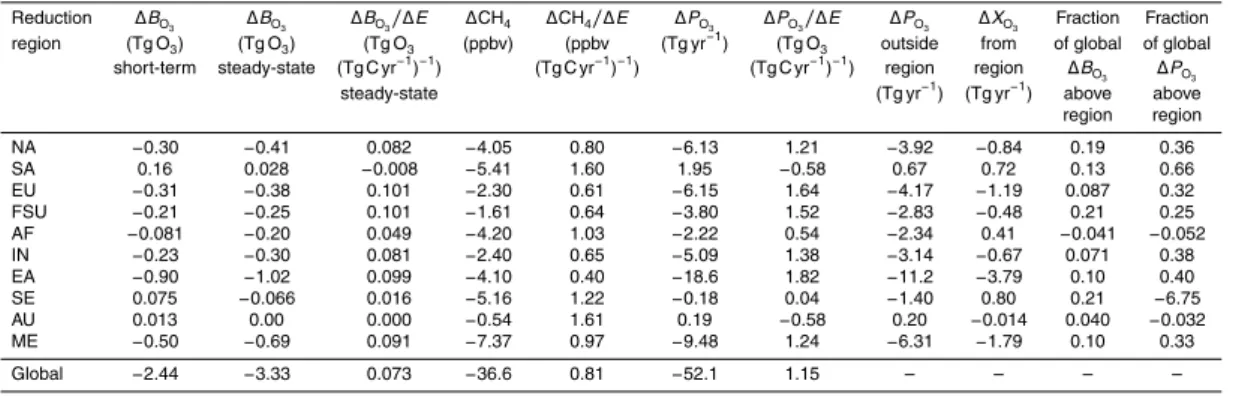
Table 1.Changes in global annual average short-term and steady-state tropospheric O3burden (BO
3) and tropospheric CH4for the global and regional reductions. Changes in O3 production (PO
3),PO3 normalized per unit change in NMVOC emissions (E), andPO3 outside each reduc-tion region are shown for each regional reducreduc-tion. Changes in net O3 export (XO
3) from each reduction region, and the fractions ofBO
3 and PO3 changes above each reduction region are also estimated.
Reduction ∆BO3 ∆BO3 ∆BO3/∆E ∆CH4 ∆CH4/∆E ∆PO3 ∆PO3/∆E ∆PO3 ∆XO3 Fraction Fraction region (Tg O3) (Tg O3) (Tg O3 (ppbv) (ppbv (Tg yr−
1
) (Tg O3 outside from of global of global short-term steady-state (Tg C yr−1
)−1
) (Tg C yr−1 )−1
) (Tg C yr−1 )−1
) region region ∆BO3 ∆PO3 steady-state (Tg yr−1
) (Tg yr−1
ACPD
13, 21125–21157, 2013Air quality and RF impacts of VOC
emissions
M. M. Fry et al.
Title Page
Abstract Introduction
Conclusions References
Tables Figures
◭ ◮
◭ ◮
Back Close
Full Screen / Esc
Printer-friendly Version Interactive Discussion
Discussion
P
a
per
|
D
iscussion
P
a
per
|
Discussion
P
a
per
|
Discuss
ion
P
a
per
|
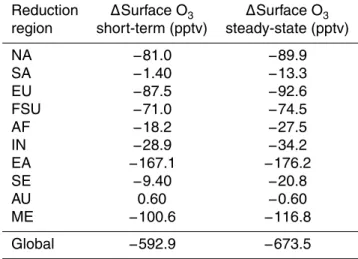
Table 2.For the global and regional reduction simulations relative to the base, global annual average changes in short-term and steady-state surface O3.
Reduction ∆Surface O3 ∆Surface O3 region short-term (pptv) steady-state (pptv)
NA −81.0 −89.9
SA −1.40 −13.3
EU −87.5 −92.6
FSU −71.0 −74.5
AF −18.2 −27.5
IN −28.9 −34.2
EA −167.1 −176.2
SE −9.40 −20.8
AU 0.60 −0.60
ME −100.6 −116.8
ACPD
13, 21125–21157, 2013Air quality and RF impacts of VOC
emissions
M. M. Fry et al.
Title Page
Abstract Introduction
Conclusions References
Tables Figures
◭ ◮
◭ ◮
Back Close
Full Screen / Esc
Printer-friendly Version Interactive Discussion
Discussion
P
a
per
|
D
iscussion
P
a
per
|
Discussion
P
a
per
|
Discuss
ion
P
a
per
|
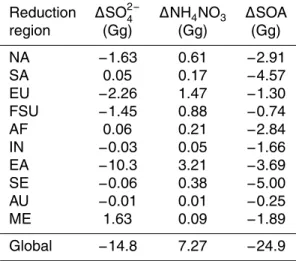
Table 3.For the global and regional reduction simulations relative to the base, global annual average tropospheric burden changes in SO2−
4 , NO
−
3 (expressed as NH4NO3), and SOA. The
global annual average tropospheric SO2−
4 , NH4NO3, and SOA burdens in the base simulation
are 1785 Gg SO24−, 416 Gg NH4NO3, and 227 Gg SOA.
Reduction ∆SO2−
4 ∆NH4NO3 ∆SOA
region (Gg) (Gg) (Gg)
NA −1.63 0.61 −2.91
SA 0.05 0.17 −4.57
EU −2.26 1.47 −1.30
FSU −1.45 0.88 −0.74
AF 0.06 0.21 −2.84
IN −0.03 0.05 −1.66
EA −10.3 3.21 −3.69
SE −0.06 0.38 −5.00
AU −0.01 0.01 −0.25
ME 1.63 0.09 −1.89