and education index of the municipalities of the state of Minas
Gerais
Cleyde Cristina Rodrigues Caetano
Universidade Federal de Uberlândia / Programa de Pós-Graduação em Ciências Contábeis Uberlândia / MG — Brazil
Lucimar Antônio Cabral de Ávila
Universidade Federal de Uberlândia / Programa de Pós-Graduação em Ciências Contábeis Uberlândia / MG — Brazil
Marcelo Tavares
Universidade Federal de Uberlândia / Programa de Pós-Graduação em Ciências Contábeis Uberlândia / MG — Brazil
Considering the changes in Brazilian municipalities since the Federal Constitution of 1988, this study sought to verify the relationship between government transfers, own tax collection and the education index of municipalities of the state of Minas Gerais (2009 to 2013). he hypothesis adopted was that a greater inancial resources availability would have a positive impact on the municipal education’s quality. he study variables were tested using randomized block variance analysis, Spearman’s correlation, k-rates clusters’ analysis and multiple linear regression. Among the results obtained, the study highlights the lack of connection between the degree of inancial autonomy and the investments in education, as well as it inds that the amount of revenues from taxes and the extra percentage of investment do not afect the education index.
Keywords: government transfers; own tax collection; investments in education; municipal education index; mu-nicipalities of the state of Minas Gerais.
A relação entre as transferências governamentais, a arrecadação tributária própria e o índice de educação dos municípios do estado de Minas Gerais
Considerando as mudanças proporcionadas aos municípios brasileiros, desde a promulgação da Constituição Federal de 1988, objetivou-se veriicar a relação entre as transferências governamentais, a arrecadação tributária própria e o índice de educação dos municípios do estado de Minas Gerais (2009 a 2013), partindo da hipótese de que uma maior disponibilidade de recursos inanceiros impactaria positivamente a qualidade da educação municipal. As variáveis do estudo foram testadas por meio da análise de variância em blocos casualizados, corre-lação de Spearman, análise de clusters de k-médias e regressão linear múltipla. Entre as inferências deste estudo, destaca-se a falta de associação entre o grau de autonomia inanceira e os investimentos em educação, e o achado de que o quantitativo de receitas tributárias e o percentual adicional de investimento em educação não impactam o índice de educação.
Palavras-chave: transferências governamentais; arrecadação tributária própria; investimentos em educação; índice de educação municipal; municípios do estado de Minas Gerais.
DOI: http://dx.doi.org/10.1590/0034-7612174433
Article received on January 4, 2017 and accepted on June 29, 2017.
La relación entre las transferencias gubernamentales, la recaudación de impuestos y el índice de educa-ción de los municipios del estado de Minas Gerais
Considerando que las modiicaciones son proporcionadas a los municipios brasileños, desde la promulgación de la Constitución Federal de 1988, que alteró la asignación de recursos públicos a la educación, los municipios brasileños pasaron a recibir más recursos del gobierno, así como aumentar el porcentaje de la asignación munici-pal invertida en el área de educación. Así, en este estudio se objetivó veriicar la relación entre las transferencias gubernamentales, la recaudación de impuestos propia y el índice de educación de los municipios del estado de Minas Gerais (2009 a 2013), partiendo de la hipótesis de que una mayor disponibilidad de recursos inancieros impactaría positivamente la calidad de la educación municipal. Las variables del estudio se probaron por medio del análisis de varianza en bloques casualizados, correlación de Spearman, análisis de clusters de k-medias y regresión lineal múltiple. Entre las inferencias de este estudio, se destaca la falta de asociación entre el grado de autonomía inanciera y las inversiones en educación, y el hallazgo de que el cuantitativo del aumento de impuestos y el porcentaje adicional de inversión en educación no impactan el índice de educación.
Palabras clave: transferencias gubernamentales; recaudación tributaria propia; inversiones en educación; índice de educación municipal; municipios del estado de Minas Gerais.
1. INTRODUCTION
he enactment of the 1988 Constitution was a landmark for great changes in Brazilian municipalities, which underwent a signiicant increase in the revenues originated from iscal transfers from state and federal governments, along with resources earned through municipal tax collection. However, municipalities had to bear the burden of the responsibility to manage those resources and ofer basic public services to local population. In the mid-1990’s, legislative changes imposed on municipal governments the compulsory requirement to act mainly in elementary and children education, de-termining the minimum destination of 25% of tax revenues to the provision of educational services. he political reforms stimulated the decentralization of policies and actions, igniting a strong discussion over their inancing (Cruz, 2006). he insuiciency of municipal revenue to meet local problems is a drawback for most Brazilian municipalities, entailing a rise on regional gaps, usually worsened by the diversity of demographic and environmental issues (Galvarro et al., 2009).
he present study aimed at verifying the relationship between iscal transfers, municipal tax collection and the education index of cities in the state of Minas Gerais, within the period ranging between 2009 and 2013, considering the hypothesis that a greater availability of inancial resources would favorably impact the quality of municipal education. Speciically, the study meant to establish a comparison between the municipalities of the state of Minas Gerais, by studying the degree of municipal inancial autonomy, investigating possible empirical relations between the main variables covered by this study, and grouping the cities of the state of Minas Gerais into clusters according to their percentage of municipal tax collection.
linear regression. In order to compare the educational situation of the cities in the Southeastern area, the Firjan Index for Municipal Development was used — education as an indicator of the quality of public municipal schooling.
2. THEORETICAL REFERENCES
Brazilian federalism emerged as an attempt to decentralize the power, centered around a unitary State (Palotti, 2009), marked by a broad decentralization process and by the creation of a model for intergovernmental relationships (Abrucio, 2005), enabling subnational entities to execute national public policies through transfers of public funds, in order to attend to the basic needs of local popu-lation (Cruz, 2006). his distribution of competences throughout the subnational levels is a result of the adoption of iscal federalism (Silva, 2005).
Brazilian cities were the entities that most beneited from the decentralization ideals introduced by the 1998 constitution, as they became more independent to allocate municipal resources, to fund and manage their revenues (Souza, 2002) and witnessed the broadening of municipal capac-ity, asserting them greater inancial autonomy (Santos, 2003). However, not every city is capable of inancially supporting local population, therefore demanding resources from upper entities (Souza and Blumm, 1999).
hose municipal units are provided with revenues arising from three sources: their own tax collection, legal and constitutional transfers, and voluntary or negotiated transfers (Mello, 1993; Postali and Rocha, 2003). Municipal own tax collection is basically derived from municipal taxation, stemming from triggering events such as the rendering of services, urban property ownership and
inter vivos transfer of property (Santos, 2008), and the charging of special assessment taxes for urban
improvement, fares and pension contributions (Mello, 1993). he intergovernmental constitutional or iscal transfers are directly related to the Brazilian iscal system, while the voluntary or negotiated transfers derive mostly from agreements settled between the Federal Government and the munici-palities (Mello, 1993; Postali and Rocha, 2003).
he intergovernmental iscal transfers in Brazil represent resources that are relevant to the balance of the municipal public inances (Gonçalves, 2013) and constitute an important political instrument within the scope of iscal federalism, presenting three potential roles: internalization of indirect beneits into other jurisdictions, iscal equalization between the jurisdictions, and improvement of the overall iscal system (Oates, 1999). Massardi and Abrantes (2015) further state that in countries where subnational entities hold greater autonomy, it becomes necessary to harmonize the level of resources of those units in order to ofer public services to the local population, thereby disassembling local inequalities. In this sense, smaller countries or regions should be more successful in meeting the social needs of their population (Breuss and Eller, 2004).
Brazilian public education has undergone a series of transformations since the 1998 Federal Con-stitution, especially regarding municipal and state capacities: the municipalities should preferably ofer primary education and both municipal and state governments were obligated to invest 25% of tax revenues and iscal transfers into Education (Arretche, 2002). In September 1996, the constitutional text was altered by enactment of constitutional amendment number 14, circumscribing municipal action mainly within early childhood and primary education (Brazil, 1996). Subsequently, Law num-ber 9.394/1996 determined that municipal and state governments were fully responsible for early childhood, primary and secondary schooling, a landmark for the decentralization of the education system in Brazil (Durham, 2010).
Along with the debate over capacity, funding is another key aspect to assure the fulillment of social rights. Regarding education, the debate becomes even more important, considering that both international and national scenarios report serious budgetary deicits, taking into account that the future of education, especially in developing countries, such as Brazil, needs a wise input of inancial and human resources (Fortunati, 2007).
Menezes-Filho and Nuñez (2012) assert that Brazil presents a high level of investment in edu-cation, both public and private, despite not holding a favorable position in the worldwide ranking. In a work developed by Greenwald, Hedges and Laine (1996), educational expenditure was proven signiicantly related to the performance of the students, and the perceived relationship is extremely important to the educational process, not only the amount of investments, but also the management of those resources and the incentives created for both teachers and students are equally relevant.
Hanushek (1986) warns that an increase in education spending alone does not necessarily imply a direct improvement of the quality of education, because the resources destined to public schools are ineiciently managed. Davies (2006) mentions that, in Brazil, it is pointless to create funds or to increase the resources destined for education when there are no assurance that those resources will be properly applied.
Menezes-Filho and Amaral (2009) tested if Brazilian municipalities with greater educational expenditure would present better quality in education, measuring according to the average results of the student in Math and Portuguese language exams in the Prova Brasil (Brazil Test). he conclusion was that, despite the fact that the impact of the expenses with education was statistically signiicant on educational performance, it did not present signiicant practical relevance (Menezes-Filho and Amaral, 2009).
Meyer (2010) adds that a series of factors demands an increase in educational expenses, but pre-vious research have shown that the volume of resources applied may not be the main issue, excelling the paradigm that more money would necessarily mean a better education. Gouveia and Souza (2012) support that investments in education do not automatically convert into quality education conditions. Menezes-Filho and Nuñez (2012) note that there is no clear tendency between the total amount spent on education and educational performance.
In Brazil, subnational governments rely on programs that fund public studies, allocated by the National Fund for the Development of Education (FNDE), an autarchy linked to the Education Ministry, in order to assure a minimum standard for the quality of education and the adjustment of educational opportunities (Cruz, 2012). he same author also considers funding policies for public education relevant in facing the existing socio-economical diferences within the Brazilian territory, which result foremost from the gap in the taxation capabilities of diferent subnational entities.
Finally, considering the extensive theoretical construction presented and despite the series of studies that showed conlicting results, a possible positive relationship between education spending and the quality of the education ofered may be envisioned because of the possibility of improvements in the educational infrastructure through investments (Greenwald, Hedges and Laine, 1996; Fortu-nati, 2007; Cruz, 2012). For that purpose, the hypothesis that guides the present work refers to the assumption that municipalities in the state of Minas Gerais with greater municipal tax collection tend to invest more resources in education and, consequently, have better municipal education indexes.
3. METHODOLOGY
3.1 DELIMITATION AND COLLECTION OF THE SAMPLE AND OPERATIONALIZATION OF THE VARIABLES
he state of Minas Gerais was adopted as the focus of analysis, considering its subdivision into munic-ipal units and its 12 mesoregions. Minas Gerais represents the second most populous state in Brazil, the largest in the Southeastern region, the fourth in territorial extension and the third economy of the country (Silva et al., 2012).
he following data were extracted from the sample in order to perform empirical tests: 2011 (Barão do Monte Alto/MG; Nanuque/MG), 2012 (Coronel Murta/MG; Pedrinópolis/MG), 2013 (Esmeral-das/MG), because of the lack of inancial data available, and the city of Naque-2012, for presenting negative municipal tax collection, due to superior deductions held in the period.
he inancial information of each municipal unit was obtained through the Information System on Public Budget for Education (Siope), run by the National Fund for the Development of Education (FNDE), where can be found the Revenue and Expenses Information with the Maintenance and Development of Education — MDE — Municipal Units (DRDMDE). he inancial values were ex-tracted from the column “Bimonthly EXECUTED REVENUE” of each demonstrative (Siope, 2016). A formalized education index was chosen for the development of this work: the Firjan Index for Municipal Development (IFDM), created by the Industry Federation of the State of Rio de Janeiro (Firjan, 2015). he IFDM is an index that results from the simple average of the results obtained by three important areas of human development: Employment and Income, Education and Health (Firjan, 2015). he study only used the IFDM — Education Index, which ranges from 0 to 1, with higher values meaning a greater development of the municipal unit (Firjan, 2015)
he analysis period proposed for the research was between 2009 and 2013, taking into consider-ation the data available, limited to 2013, due to discrepancies in the publicconsider-ation of the Firjan Index. he indexes regarding the year of 2013 were only released by the end of the year 2015 (Firjan, 2015).
he variables used in the study are represented in chart 1.
CHART 1 VARIABLE BUILT FOR THE STUDY
Variable/Equation/Additional Information
Percentage of Municipal Tax Collection (Prect): expresses the degree of inancial autonomy of each municipal unit (Silva, 1992).
PRECT = Own tax collection × 100 Total tax revenue
Municipal Tax Revenue:value presented in the ield 1 of the DRDMDE.
Total Tax Revenue: value presented in the ield 3 of the DRDMDE (comprising the sum of Tax Revenue and the Revenue from Legal and Constitutional Transfer).
Number of Inhabitants of the Municipal Units (Habit)
Based on the demographic census of 2010 (IBGE, 2010), and on the municipal population estimates sent to the Federal Accountability Ofice (TCU) (IBGE, 2016a).
Municipal Tax Collection Per Capita (RECTp)
RECTp = Own tax collection INHABITANTS
Fiscal Transfers Per Capita (TRFp)
TRFp = Revenue from constitutional and legal transfers INHABITANTS
Percentage of Municipal GDP (RGDP)
RGDP = Total municipal GDP × 100 Total state GDP
Percentage of Additional Investment in Municipal Education (Pade)
PADE = Percentage of municipal budget spent on education – 25
Percentage of the municipal budget spent on education: presented on field 39 of the DRDMDE. 25%: annual minimum to be met by the end of the iscal year (Brazil, 1988).
Municipal Education Index (Iedu)
Municipal index released by Firjan, ranging from 0 to 1, the closest to 1, the grater the education development level of the municipal unit (Firjan, 2015).
he values regarding municipal tax collection and legal and constitutional transfers, from 2009 to 2012, were updated to December/2013, using the General Index for Market Values (IGP-M/FGV), provided by the Brazilian Central Bank (BCB, 2016). he indexes applied, by the multiplicative meth-od, were the following: data from 2009 (1,3276045); data from 2010 (1,2039394); data from 2011 (1,1363272); and data from 2012 (1,0624323).
he use of per capita variables aimed at minimizing the possible impact of the absolute amount in the empirical analyses and to eliminate the distance of the values raised by municipal units of various sizes, reducing the incidence of outliers.
3.2 SENSITIVITY ANALYSIS
In order to compare the level of autonomy of the diferent municipalities that form the mesoregions of the state of Minas Gerais, a randomized block variance analysis was performed (Banzato and Kronka, 1989) through the observation of the percentage of municipal tax collection, which demonstrates the level of autonomy of the municipal unit. he years of 2009, 2010, 2011, 2012 and 2013 were considered blocks. he statistical signiicance of the variance factors that result from the analysis of the repre-sentative percentages of the Prect variable of the mesoregions led to the use of the Scott-Knott test to compare the average estimates found (Scott and Knott, 1974). To perform those two empirical tests, the Sisvar® statistical sotware, version 5.6 was used (Build 86).
Furthering the empirical development, the study investigated the possible relation between the percentage of own tax collection, the percentage of the municipal GDP, the additional percentage of investment in education and the municipal index of education with data represented by ordered pairs (Prect and RGDP; Prect and Pade; Prect and Iedu; RGDP and Pade; RGDP and Iedu; Pade and Iedu). In order to determine the existence of a linear correlation between the variables, the coeicients of the Spearman correlation (γs) were calculated and their respective statistical signiicances, using IBM SPSS Statistics® 17 sotware.
Attempting to reduce the discrepancies of the features of Minas Gerais’ municipalities, groupings based on the estimate average of own tax collection, between 2009 and 2013, were formed through the method of k-rates clusters analysis (Maroco, 2007), due to the large amounts of information in the sample. he clusters were formed using the IBM SPSS Statistics® 17 sotware and, aterwards, the cartographic representation was operationalized with the QGIS® 2.18.0 sotware.
Finally, in order to verify the relationship between own tax collection per capita, iscal transfers
per capita, the additional percentage of investment in education and the Firjan index for municipal
education, multiple linear regression was chosen, because it enables the study of the relations between two or more variables (independent), that are presented in a linear form, and a metric dependent variable (Fávero et al., 2009), according to the following equation (1):
IEDUit = β0 + β1RECTpij + β2TRFpij + β3PADEij + ∈ij (1)
Where:
IEDUit: Education index of the i municipal unitin the j year;
β1: Linear coeicient corresponding to the RECTp variable;
RECTpij: Per capita own tax collectionof the i municipal unit in the j year;
β2: Linear coeicient corresponding to the TRFp variable;
TRFpij: Per capita do iscal transfers of the i municipal unit in the j year;
β3: Linear coeicient corresponding to the Pade variable;
PADEij: Additional percentage of investment in municipal education in the i municipal unit in the j year;
∈ij: Random error.
he multiple linear regression models were conducted for each cluster using the IBM SPSS Sta-tistics® 17 sotware.
Some constraints should be taken into account in the analysis of the results and conclusions: the Revenue Data and the Expenses with Education Maintenance and Development are self declared by the municipal units and the sources of the revenue applied to each stage of the education process are not discriminated; the most recent informative released by the Firjan Index of Municipal Development (IFDM) dates from 2015 and is based on information collected in 2013.
4. ANALYSIS AND DISCUSSION OF THE RESULTS
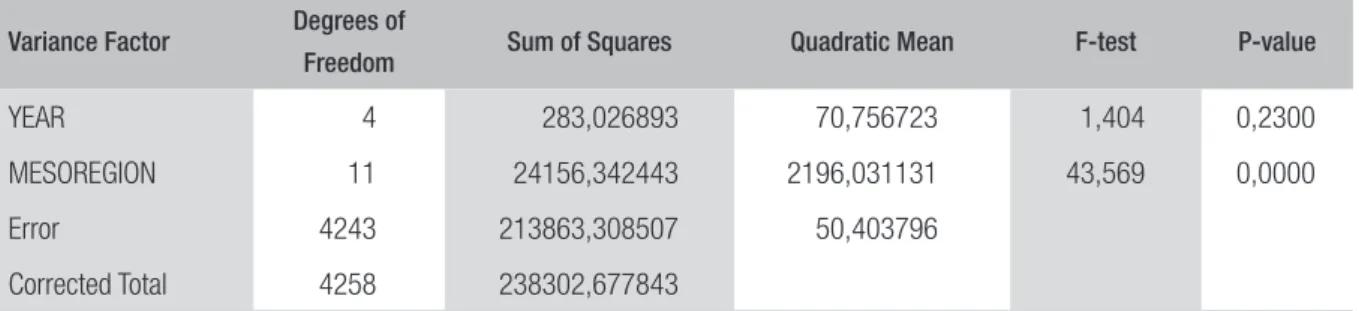
he degree of inancial autonomy of the governmental institutions may be veriied by the ratio between their own tax revenue and the total revenue available (Silva, 1992); an increase in this ratio indicates an increase in the autonomy of the public entity. Inside this context, the degree of inancial auton-omy is directly related to the municipal government’s capability of collecting taxes (Santos, 2004), represented in this survey by the own tax collection percentage variable. In order to compare the estimates of that variable, a randomized block variance analysis was performed, presented in table 1.
TABLE 1 VARIANCE ANALYSIS OF THE OWN TAX COLLECTION PERCENTAGES (PRECT) OF THE MUNICIPALITIES IN THE STATE OF MINAS GERAIS (2009 TO 2013)
Variance Factor Degrees of
Freedom Sum of Squares Quadratic Mean F-test P-value
YEAR 4 283,026893 70,756723 1,404 0,2300
MESOREGION 11 24156,342443 2196,031131 43,569 0,0000
Error 4243 213863,308507 50,403796
Corrected Total 4258 238302,677843
Source: Elaborated by the authors.
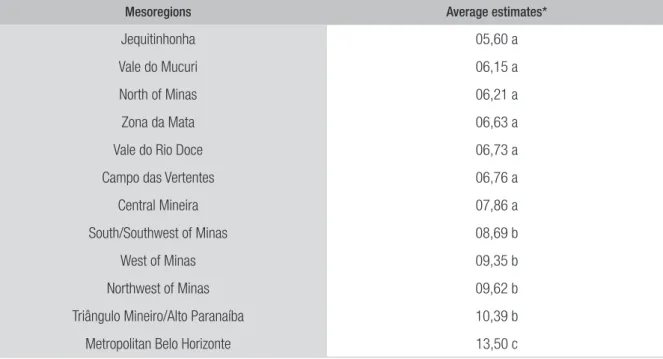
he results of the Scott-Knott test performed to compare the average estimates of the own tax collection between the mesoregions of the state of Minas Gerais are shown in table 2.
TABLE 2 SCOTT-KNOTT TEST REGARDING THE AVERAGE ESTIMATE OF THE OWN TAX COLLECTION PERCENTAGE OF THE MUNICIPALITIES IN THE STATE OF MINAS GERAIS (2009 TO 2013)
Mesoregions Average estimates*
Jequitinhonha 05,60 a
Vale do Mucuri 06,15 a
North of Minas 06,21 a
Zona da Mata 06,63 a
Vale do Rio Doce 06,73 a
Campo das Vertentes 06,76 a
Central Mineira 07,86 a
South/Southwest of Minas 08,69 b
West of Minas 09,35 b
Northwest of Minas 09,62 b
Triângulo Mineiro/Alto Paranaíba 10,39 b
Metropolitan Belo Horizonte 13,50 c
* Averages followed by the same letter are not statistically diferentiable through the Scott-Knott test at a nominal signiicance level of 0,05.
Source: Elaborated by the authors.
he state was divided into three blocks of mesoregions, statistically diferent at a signiicance level of 95%. he irst block is formed by the municipalities in the mesoregions of Jequitinhonha, Vale do Mucuri, Norte de Minas, Zona da Mata, Vale do Rio Doce, Campo das Vertentes and Central Mineira.
he South/Southeast, West and Northwest of Minas and Triângulo Mineiro/Alto Paranaíba mesoregions form the second block. Each group of municipal units has estimate averages that are statistically similar and they are at the same level of signiicance. he Metropolitan Belo Horizonte mesoregion presented the highest average estimate, statistically diferent from the others.
he mesoregions of the state of Minas Gerais exhibited behavior that leads to the possible rela-tionship between the degree of municipal inancial autonomy and the average estimate of the GDP (IBGE, 2016b) over the period analyzed.
he mesoregions with lower degree of inancial autonomy, Jequitinhonha, Vale do Mucuri and North of Minas, presented lower average estimates of the GDP (IBGE, 2016b), showing that less economically developed mesoregions would likely be related to municipalities with less inancial autonomy. Silva and colleagues (2012) underscore that the Jequitinhonha and North of Minas me-soregions present high socioeconomic vulnerability.
he municipal units in the mesoregions of South/Southwest, West, Northwest, Triângulo Mineiro/ Alto Paranaíba and Metropolitan Belo Horizonte, besides presenting more autonomy, present higher GDP average estimates (IBGE, 2016b), also revealing that mesoregions formed by municipalities with more inancial autonomy may be related to more economically developed mesoregions, with expressive collection of Municipal Service Tax (ISS). Santos (2004) highlights that the ISS is the main source of municipal own tax collection in Brazil.
he possible empirical relationships between the variables, Prect, RGDP, Pade and IEDU, were also investigated through a correlation analysis, in order to predict possible explanations for the ensuing diagnosis.
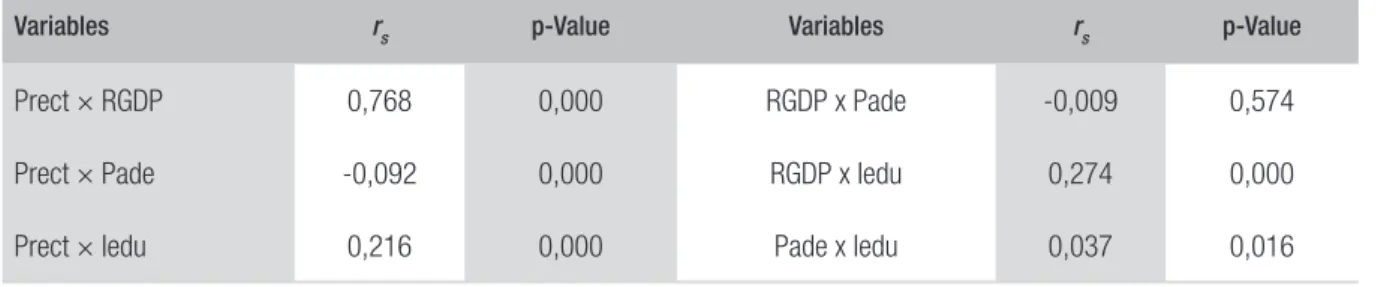
Table 3 presents the results from the Spearman correlation test between the variables mentioned above. here is a positive and considerable relation, statistically signiicant at a 1% level, between the percentages of own tax collection (Prect) and the percentage of representativeness of the municipal-ities regarding total GDP (RGDP).
TABLE 3 SPEARMAN CORRELATION COEFFICIENTS (r
s) AND THEIR RESPECTIVE SIGNIFICANCE (P-VALUE) FOR THE MUNICIPALITIES OF THE STATE OF MINAS GERAIS (2009 TO 2013)
Variables r
s p-Value Variables rs p-Value
Prect × RGDP 0,768 0,000 RGDP x Pade -0,009 0,574
Prect × Pade -0,092 0,000 RGDP x Iedu 0,274 0,000
Prect × Iedu 0,216 0,000 Pade x Iedu 0,037 0,016
Source: Elaborated by the authors.
A positive relation between the level of inancial autonomy and local economic development is evidenced. Namely, municipalities with greater autonomy present higher economic development and municipalities with lesser autonomy present lower economic development, when considering their individual participation in the GDP of the state of Minas Gerais.
he analysis of the relation between the Prect e Iedu variables revealed that the municipalities show a coeicient that is statistically signiicant, but lower. In this case, the empirical indings show that there is little relation between the inancial autonomy and the municipal education index. For that matter, the hypothesis that the municipal units with greater tax collection would tend to invest more resources into education and, consequently, present better municipal education indexes was not empirically veriiable, meaning that the Spearman correlation test proved there is no relation between inancial autonomy, investments and municipal education indexes in the state of Minas Gerais.
Examining the correlation between the RGDP and Pade variables the correlation coeicient as-certained is not statistically signiicant, indicating that the municipal level of economic development may not have any relationship with additional investments in education. Similar behavior is observed between the RGDP and Iedu variables, where the correlation coeicient is statistically signiicant but shows a low expression, demonstrating that the levels of economic development in these municipalities has little inluence over the evaluations obtained in the education index.
Finally, the assessment of the behavior between the Pade and Iedu variables refers to a statistically signiicant correlation coeicient, but with no signiicant representation, revealing that additional investments in education may not imply better indexes, strengthening the statement of Diniz and Corrar (2011), who claim there is no consensus regarding a positive efect in the quality of education due to increased investments in education.
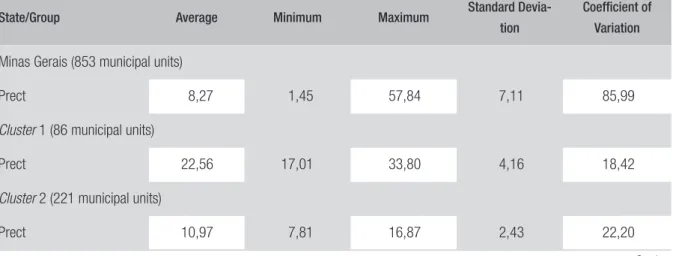
In order to reduce the variation of the data, the municipalities of Minas Gerais were gathered into groups, considering the average estimate percentage of own tax collection of each municipal unit, through a k-rates clusters’ analysis, with signiicance rate of 1%, according to the descriptive analysis presented in table 4.
TABLE 4 DESCRIPTIVE ANALYSIS OF THE ESTIMATED AVERAGE PERCENTAGE OF MUNICIPAL OWN TAX COLLECTION IN THE STATE OF MINAS GERAIS, GLOBAL AND BY CLUSTERS
(2009 TO 2013)
State/Group Average Minimum Maximum Standard
Devia-tion
Coeficient of
Variation
Minas Gerais (853 municipal units)
Prect 8,27 1,45 57,84 7,11 85,99
Cluster 1 (86 municipal units)
Prect 22,56 17,01 33,80 4,16 18,42
Cluster 2 (221 municipal units)
Prect 10,97 7,81 16,87 2,43 22,20
State/Group Average Minimum Maximum Standard Devia-tion
Coeficient of
Variation
Cluster 3 (8 municipal units)
Prect 45,13 35,35 57,84 8,79 19,47
Cluster 4 (538 municipal units)
Prect 4,33 1,45 7,70 1,63 37,68
Source: Elaborated by the authors.
he subdivision of the municipalities of Minas Gerais into groups rendered a notable reduction in the variation of the data. Cluster 1, formed by approximately 10% of all the municipalities, presents an estimate average percentage of own tax collection higher than the estimated average of the state, but lower than the estimated average of the municipalities in cluster 3. Cluster 2 is the second largest group of municipalities, with almost 26% of the municipal units, presenting an estimated average percentage of own tax collection lower than cluster 1, but higher than the state average and the average
of cluster 4. he third group (cluster 3) comprises only eight municipal units which hold the highest
estimated average percentage of own tax collection. Finally, cluster 4 constitutes the largest agglom-eration of municipalities and holds the smallest estimated average percentage of own tax collection, lower than the estimated average of the state. It conigures the greatest data variability, what could be explained by the large amount of municipal units.
he representation of the groups of municipalities of the state of Minas Gerais is illustrated in igure 1.
Cluster 1 holds the second largest estimated average percentage of own tax collection and the
largest estimated average of representation in the state’s GDP (45% of the total average of the state) (IBGE, 2016b). hose municipalities are well spread in terms of population size. Around 63% of the municipal units that form the afore-mentioned group are located in the mesoregions of Metropolitan Belo Horizonte, South/Southeast and Zona da Mata. his cluster includes municipalities with good utilization of their own tax base, supported by the high degree of inancial autonomy and, due to the high representation on the total GDP, those municipalities hold the second best estimated average of the GDP by municipality. hose municipalities stand out on the estimated average of participation of the Urban Property Tax (IPTU) in the total own tax revenue (Siope, 2016).
Cluster 2 comprises the second largest group of municipalities. With estimated percentage average
of own tax collection higher than the state’s average, those municipalities are responsible for 23,88% of the state’s GDP (IBGE, 2016b). he great majority of those municipal units are described as small-sized, with representation in all mesoregions of the state.
Cluster 3 presents the highest estimated average percentage of own tax collection in the state and
eco-nomic development and a respective high degree of inancial autonomy, standing out on the estimated average participation of the Municipal Service Tax (ISS) in their own tax collection (Siope, 2016).
FIGURE 1 MAP OF THE MUNICIPALITIES OF THE STATE OF MINAS GERAIS ORGANIZED INTO K-RATE CLUSTERS (A) AND INTO GEOGRAPHIC MESOREGIONS (B)
Source: Elaborated by the authors.
Completing the analysis, cluster 4 presents the highest agglomeration of municipalities, but the smallest estimated average percentage of own tax collection, lower than the state’s estimated average. Responsible for only 9,45% of the estimated average of the state’s GDP over the period analyzed (IBGE, 2016b), those municipalities can be considered the less economically developed. hey are all considered small-sized, with representatives in all mesoregions, and marked by the lowest estimated average of participation of the Municipal Service Tax (ISS) in the total composition of local taxes (Siope, 2016).
In this context it is possible to verify that population size is likely related to the economic devel-opment of the municipality and, consequently, with the degree of local inancial autonomy.
in education was presented as an independent variable, in order to ascertain a possible association between the investments in education and the index published. Finally, a regression study was made for each of the clusters, in order to see the behavior of the variables within more homogeneous groups.
Table 5 presents a descriptive analysis of the explanatory and dependent variables, for the mu-nicipalities of Minas Gerais, considering the groups formed.
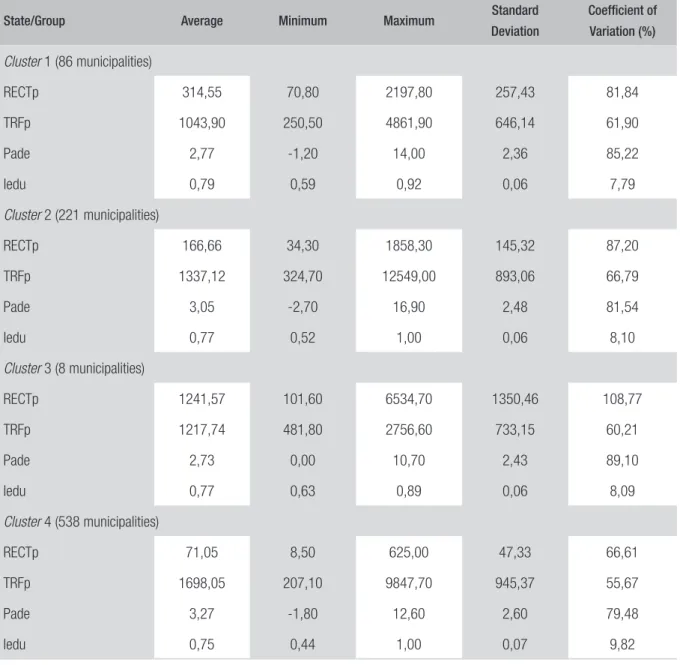
TABLE 5 DESCRIPTIVE ANALYSIS OF THE ESTIMATED AVERAGE TAX REVENUE PER CAPITA, FISCAL TRANSFERS PER CAPITA, PERCENTAGE OF ADDITIONAL INVESTMENTS IN EDUCATION AND MUNICIPAL EDUCATION INDEXES OF THE MUNICIPALITIES OF MINAS GERAIS GROUPED INTO CLUSTERS
State/Group Average Minimum Maximum Standard
Deviation
Coeficient of
Variation (%)
Cluster 1 (86 municipalities)
RECTp 314,55 70,80 2197,80 257,43 81,84
TRFp 1043,90 250,50 4861,90 646,14 61,90
Pade 2,77 -1,20 14,00 2,36 85,22
Iedu 0,79 0,59 0,92 0,06 7,79
Cluster 2 (221 municipalities)
RECTp 166,66 34,30 1858,30 145,32 87,20
TRFp 1337,12 324,70 12549,00 893,06 66,79
Pade 3,05 -2,70 16,90 2,48 81,54
Iedu 0,77 0,52 1,00 0,06 8,10
Cluster 3 (8 municipalities)
RECTp 1241,57 101,60 6534,70 1350,46 108,77
TRFp 1217,74 481,80 2756,60 733,15 60,21
Pade 2,73 0,00 10,70 2,43 89,10
Iedu 0,77 0,63 0,89 0,06 8,09
Cluster 4 (538 municipalities)
RECTp 71,05 8,50 625,00 47,33 66,61
TRFp 1698,05 207,10 9847,70 945,37 55,67
Pade 3,27 -1,80 12,60 2,60 79,48
Iedu 0,75 0,44 1,00 0,07 9,82
he municipalities of Minas Gerais enhance the diferences regarding own tax collection per capita
and iscal transfers per capita, highlighting the current discrepancies, which may also be related to the high number of municipalities that form the state. he small sized municipalities (cluster 4) show a higher dependency on iscal transfers and, consequently, a lower degree of inancial autonomy, espe-cially for the estimated average of own tax collection per capita with less variation. he municipalities grouped into cluster 3 exhibit a higher degree of inancial autonomy, with an estimated average of own tax collection per capita higher than the estimated average of iscal transfers per capita. Despite the group being formed by only three municipalities, the estimated average tax collection per capita
shows the highest data variation.
he inverse relation between the degree of inancial autonomy and the additional percentage of investment in education is also inferred. Speciically, municipalities with more autonomy (cluster 3) present the lowest estimated average of additional investment in education, while the municipalities with the smallest estimated average regarding inancial autonomy are marked by the highest estimated average additional percentage of investment in education (cluster 4). Small municipalities, despite a low degree of municipal autonomy, tend to invest more resources into education. Dal Magro and Silva (2016) add that smaller sized municipalities tend to present better educational levels.
Within this segment, the eight municipalities distinguished as more autonomous, that is, those that show a good harnessing of their own tax collection, direct less additional resources to education. his inding might be explained by the high demand for enrollment in bigger municipalities and also by the complexity of other services demanded in more populous cities. Silva and colleagues (2012) and Souza and colleagues (2012) add that one of the greatest challenges for the public systems is the eicient allocation of resources in order to maximize social beneits.
he Firjan education index showed low variation within and between the groups, presenting very close values. he following step deals with the multiple linear regression tests using the variables pertaining to the municipalities of Minas Gerais, according to table 6.
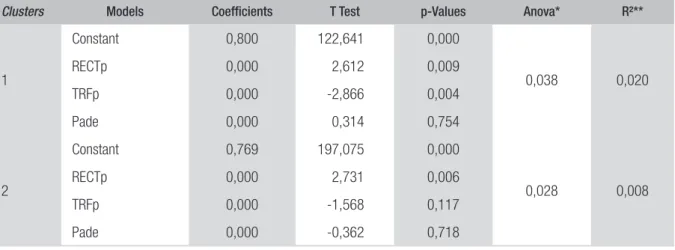
TABLE 6 RESULTS OF THE VARIANCE ANALYSIS AND MULTIPLE LINEAR REGRESSIONS CONSIDERING THE MUNICIPALITIES IN THE STATE OF MINAS GERAIS GROUPED INTO CLUSTERS
Clusters Models Coeficients T Test p-Values Anova* R²**
1
Constant 0,800 122,641 0,000
0,038 0,020
RECTp 0,000 2,612 0,009
TRFp 0,000 -2,866 0,004
Pade 0,000 0,314 0,754
2
Constant 0,769 197,075 0,000
0,028 0,008
RECTp 0,000 2,731 0,006
TRFp 0,000 -1,568 0,117
Pade 0,000 -0,362 0,718
Clusters Models Coeficients T Test p-Values Anova* R²**
3
Constant 0,774 37,620 0,000
0,507 0,062
RECTp 0,000 0,328 0,745
TRFp 0,000 -1,010 0,319
Pade 0,006 1,364 0,181
4
Constant 0,708 210,144 0,000
0,000 0,064
RECTp 0,000 3,594 0,000
TRFp 0,000 9,507 0,000
Pade 0,001 1,506 0,132
Notes: *Signiicance of the Regression Model according to the Variance Analysis; **Coeicient of Determination.
Source: Elaborated by the authors.
In the study of the multiple linear regression models, only the results of cluster 3 did not show statistical signiicance. However, even in the other groups, which presented statistical signiicance regarding the structure of the regression model, the low coeicients of determination show the re-duced predictive capability of the regression model and the coeicients presented for the independent variables are irrelevant.
he lack of signiicance of the linear regression models for the groups formed for the municipalities of Minas Gerais may be related to the great amount of municipal divisions that the state has, as well as for the high heterogeneity of the municipalities (Silva et al., 2012), with regard to the explanatory variables, granted the precarious data variability that represent the Firjan education index, taken as the dependent variable of the study.
Consequently, the multiple linear regression models showed poor predictive power, even ater the organization of the municipal units into more homogeneous groups, according to their inancial autonomy. hose indings support the work of Menezes-Filho and Amaral (2009), Meyer (2012), Gouveia and Souza (2012), Menezes-Filho and Nuñez (2012) and Monteiro (2015) in the sense of not showing a clear relation between education spending and the education index.
5. FINAL CONSIDERATIONS
Initially, observing the agglomerates of municipal units, the heterogeneity of the municipalities of Minas Gerais regarding inancial autonomy was noticed, reinforced by the recognition of greater discrepancies when compared to the estimated averages of the mesoregions. In search for possible relations between the variables, it was possible to ascertain that the local economic development might be linked to the inancial autonomy of the municipalities of the state of Minas Gerais.
Another relevant issue regards the statistical evidence that there is no relation between the degree of inancial autonomy and the investments in education. he grouping that gathered small-sized municipalities, considered less autonomous, on average, performed more investments in education. his inding could be explained by the lower demands of students and by the fact that smaller cities are not afected by some of the current problems of large-sized municipalities, such as security, trans-portation, basic sanitation, housing, etc. In addition, municipalities with greater inancial autonomy show the importance of the Urban Property Tax (IPTU) and the Municipal Service Tax (ISS) in the composition of their own tax collection, showing that municipal government should improve veri-ication, collection and control over those taxes.
Finally, in search for an answer to the main hypothesis of this study, the multiple linear regression models for the clusters were presented, marked by the lack of statistical signiicance of one model
(cluster 3) or by very low coeicients of determination, which granted very little predictive capability
to the analysis. herefore, it demonstrated that the quantitative of own tax collection per capita and the iscal transfers per capita, as well as the additional percentage of investment in education, did not impact the education index used on the research. he proximity of the values of the municipal education indexes may be pointed as one of the causes for the impossibility of building empirical models with substantial predictive capability.
he fact that no empirical relation between the investments in education and the quality of edu-cation was found does not dismiss the importance of inancing municipal eduedu-cational services. he resources might be poorly managed due to a possible ineiciency of the public sector. Should that be the case, public management should be more attentive to the management of the available funds and concerned with the return and the eiciency of the services ofered.
REFERÊNCIAS
ABRUCIO, Fernando L. A coordenação federativa no Brasil: a experiência do período FHC e os desa-ios do governo Lula. Revista de Sociologia e Política, n. 24, p. 41-67, 2005.
AFONSO, José R. R.; ARAUJO, Erika A. A capacida-de capacida-de gastos dos municípios brasileiros: arrecadação própria e receita disponível. In: NEVES, Gleisi H. et al. Os municípios e as eleições de 2000. São Paulo: Fundação Konrad Adenauer, 2000. p. 35-55 (Cader-nos Adenauer, 4).
ARÉVALO, Jorge L.; MENDOZA, Baltazar M. Fe-deralismo iscal. Chiapas y Nuevo León: un análisis
comparativo. Economía Unam, v. 12, n. 34, p.
106-123, 2015.
ARRETCHE, Marta. Relações federativas nas po-líticas sociais. Educação & Sociedade, v. 23, n. 80, p. 25-48, 2002.
BCB. Banco Central do Brasil. Calculadora do
ci-dadão. Correção de Valores. Available at: <ttps:// www3.bcb.gov.br/CALCIDADAO/publico/exibir- FormCorrecaoValores.do?method=exibirFormCor-recaoValores&aba=1>. Accessed on: 20 Apr. 2016.
BANZATO, David A.; KRONKA, Sérgio do N.
Experimentação agrícola. Jaboticabal: Funep, 1989.
BRASIL. Constituição da República Federativa do
Brasil de 1988. Brasília, 1988.
BRASIL. Emenda Constitucional no 14, de 12 de
setembro de 1996. Modiica os arts. 34, 208, 211 e 212 da Constituição Federal e dá nova redação ao art. 60 das Disposições Constitucionais Transitórias. Brasília, 1996.
BREUSS, Fritz; ELLER, Markus. he optimal de-centralization of government activity: normative recommendations for the European Constitu-tion. Constitutional Political Economy, v. 15, n. 1, p. 27-76, 2004.
CRUZ, Rosana E. Os recursos federais para o
inan-ciamento da educação. Revista de Financiamento da
Educação, v. 2, n. 7, p. 1-14, 2012.
CRUZ, Rosana E. Relações federativas e o inancia-mento da educação. EccoS — Revista Cientíica, v. 8, n. 1, p. 47-64, Jan./Jun. 2006.
DAL MAGRO, Cristian B.; SILVA, Tarcísio P. da. Desempenho dos gastos públicos em educação e a Lei de Responsabilidade Fiscal das capitais brasilei-ras. Contabilidade, Gestão e Governança, v. 19, n. 3, p. 504-528, 2016.
DAVIES, Nicholas. Fundeb: a redenção da educação básica? Educação & Sociedade, v. 27, n. 96 — esp., p. 753-774, 2006.
DINIZ, Josedilton A.; CORRAR, Luiz J. Análise da relação entre a eiciência e as fontes de recursos dos gastos municipais no ensino fundamental. Sociedade, Contabilidade e Gestão, v. 6, n. 1, p. 135-149, 2011.
DURHAM, Eunice R. A política educacional do governo Fernando Henrique Cardoso: uma visão comparada. Novos Estudos, v. 88, p. 153-159, 2010.
FÁVERO, Luiz P. et al. Análise de dados:
mode-lagem multivariada para tomada de decisões. Rio de Janeiro: Elsevier, 2009.
FIRJAN. Federação das Indústrias do Estado do Rio
de Janeiro. Evolução do IFDM Educação — 2005 a
2013. 2015. Available at: <www.irjan.com.br/ifdm/ downloads/>. Accessed on: 10 Apr. 2016.
FORTUNATI, José. Gestão da educação pública:
caminhos e desaios. Porto Alegre: Artmed, 2007.
GALVARRO, Maria del P. S. Q. S. et al. O. Dispari-dades regionais na capacidade de arrecadação dos
municípios do estado de Minas Gerais. Revista de
Economia e Administração, v. 8, n. 1, p. 17-48, Jan./ Mar. 2009.
GONÇALVES, André L. Os efeitos das transferên-cias iscais sobre as despesas públicas e arrecadação tributária dos municípios brasileiros. Revista de De-senvolvimento Econômico, v. 15, n. 28, p. 17-27, 2013.
GOUVEIA, Andréa B.; SOUZA, Ângelo R. de. Os desaios atuais referentes ao inanciamento de uma educação de qualidade. Revista de Financiamento da Educação, v. 2, n. 3, p. 1-16, 2012.
GREENWALD, Rob; HEDGES, Larry V.; LAINE, Richard D. he efect of school resources on student achievement. Review of Education Research, v. 66, n. 3, p. 361-396, 1996.
HANUSHEK, Eric A. he economics of schooling:
production and eiciency in public schools. Journal
IBGE. Instituto Brasileiro de Geograia e Estatísti-ca. Cidades@. 2010. Available at: <http://ibge.gov. br/home/estatistica/populacao/censo2010/default. shtm>. Accessed on: 18 Apr. 2016.
IBGE. Instituto Brasileiro de Geograia e Estatística.
Estimativas de população enviadas ao TCU. 2016a. Available at: <www.ibge.gov.br/home/estatistica/ populacao/estimativa2009/default.shtm>. Accessed on: 8 May 2016.
IBGE. Instituto Brasileiro de Geograia e Estatística.
Produto Interno Bruto dos municípios. 2016b. Availa-ble at: <www.cidades.ibge.gov.br/xtras/home.php>. Accessed on: 2 Oct. 2016.
MAROCO, João. Análise estatística com utilização
do SPSS. 3. ed. Lisbon: Sílabo, 2007.
MASSARDI, Wellington de O.; ABRANTES, Luiz A. Esforço iscal, dependência do FPM e desen-volvimento socioeconômico: um estudo aplicado aos municípios de Minas Gerais. Revista de Gestão, v. 22, n. 3, p. 295-313, Jul./Sept. 2015.
MELLO, Diogo L. O governo municipal brasileiro: uma visão comparativa com outros países. Rev. Adm. Pública, v. 27, n. 4, p. 36-53, 1993.
MENEZES-FILHO, Naércio A.; AMARAL, Luiz F. L. E. A relação entre gastos educacionais e desempenho escolar. São Paulo: IBMEC, 1009. (Insper Working Paper, n. 164).
MENEZES-FILHO, Naércio A.; NUÑEZ, Diana F. Estimando os gastos privados com educação no Brasil. Policy Paper, n. 3, 2012.
MEYER, Jerome J. Eiciency of iscal allocations
in site-based empowered schools. Las Vegas United States, hesis (PhD — Education in Educational Le-adership) — University of Nevada, Las Vegas, 2010.
MONTEIRO, Joana. Gasto público em educação e desempenho escolar. Revista Brasileira de Economia, v. 69, n. 4, p. 467-488, 2015.
OATES, Wallace E. An essay on fiscal federa-lism. Journal of Economic Literature, v. 37, n. 3, p. 1120-1149, 1999.
OZAKI, Marcos T.; BIDERMAN, Ciro. A im-portância do regime de estimativa de ISS para a arrecadação tributária dos municípios brasileiros.
Revista de Administração Contemporânea, v. 8, n. 4, p. 99-114, 2004.
PALOTTI, Pedro L. M. Descentralização de polí-ticas sociais no federalismo brasileiro: revisitando
problemas de coordenação e autonomia. Revista
do Centro Acadêmico Afonso Pena, v. 1, n. 1, p. 89-117, 2009.
POSTALI, Fernando; ROCHA, Fabiana. Federalismo iscal enquanto esquema de seguro regional: uma avaliação do caso brasileiro. Pesquisa e Planejamento Econômico, v. 33, n. 3, p. 573-595, 2003.
SANTOS, Angela M. S. P. Descentralização e autono-mia inanceira municipal: a perspectiva das cidades
médias. Indicadores Econômicos FEE, v. 32, n. 3,
p. 101-126, 2004.
SANTOS, Angela M. S. P. Município, descentralização e território. Rio de Janeiro: Forense, 2008.
SANTOS, Angela M. S. P. Reforma do Estado, descentralização e autonomia inanceira dos mu-nicípios. Revista de Administração Mackenzie, v. 2, p. 155-176, 2003.
SCOTT, Alastair J.; KNOTT, Martin A. A clus-ter analysis method for grouping means in the analysis of variance. Biometrics, Raleigh, v. 30, n. 3, p. 507-512. 1974.
SILVA, Ambrozina de A. P. et al. Eiciência na alo-cação de recursos públicos destinados à edualo-cação,
saúde e habitação em municípios mineiros.
Conta-bilidade, Gestão e Governança, v. 15, n. 1, p. 96-114, 2012.
SILVA, Mauro S. Teoria do federalismo fiscal: notas sobre as contribuições de Oates, Musgrave, Shah e Ter-Minassian. Nova Economia, v. 15, n. 1, p. 117-137, 2005.
SILVA, Vitorino A. Constituição de 1988 e federalis-mo tributário: impactos sobre as inanças municipais. Dissertation (Master in Economy) — Universidade Estadual de Campinas, Campinas, 1992.
SIOPE. Sistema de Informações sobre Orçamentos Públicos em Educação. Demonstrativos das receitas e despesas com Manutenção e Desenvolvimento do En-sino — MDE — municípios — 2009 a 2013. Available at: <www.fnde.gov.br/siope/relatorioRREOMunici-pal2006.do>. Accessed on: 18 Apr. 2016.
SOUZA, Celina. Governos e sociedades locais em contextos de desigualdade e de descentralização.
SOUZA, Celina; BLUMM, Márcia. Autonomia polí-tica local: uma revisão da literatura. Revista Brasileira de Informação Bibliográica em Ciências Sociais, v. 17, n. 48, p. 51-67, 1999.
SOUZA, Fábia J. V. de et al. Alocação de recursos públicos em educação nos estados brasileiros: uma análise das relações de eiciência dos gastos públicos com educação e o desempenho do Ideb no ano de 2009. Uniabeu, v. 5, n. 11, p. 155-170, 2012.
Cleyde Cristina Rodrigues Caetano
MSc in Accounting Sciences and Administrative Assistant at the Universidade Federal de Viçosa — Campus
Rio Paranaíba. E-mail: [email protected].
Lucimar Antônio Cabral de Ávila
PhD in Business Administration and adjunct professor of the Faculty of Accounting Sciences and the Post--Graduate program in Accounting Sciences of the Universidade Federal de Uberlândia. E-mail: [email protected].
Marcelo Tavares