Manohar M. Shroff, MD, FRCPC • João P. Soares-Fernandes, MD
Hilary Whyte, MD • Charles Raybaud, MD
Magnetic resonance (MR) imaging is used with increasing frequency
to evaluate the neonatal brain because it can provide important
diag-nostic and progdiag-nostic information that is needed for optimal treatment
and appropriate counseling. Special care must be taken in preparing
encephalopathic neonates for an MR study, transporting them from the
intensive care unit, monitoring their vital signs, and optimizing MR
se-quences and protocols. Moreover, to accurately interpret the findings,
specific knowledge is needed about the normal MR imaging
appear-ances of the physiologic processes of myelination, cell migration, and
sulcation, as well as patterns of injury, in the neonatal brain at various
stages of gestational development. Hypoxic-ischemic injury, the most
common cause of neonatal encephalopathy, has characteristic
appear-ances that depend on the severity and duration of the insult as well as
the stage of brain development. Diffusion-weighted MR imaging and
MR spectroscopy depict abnormalities earlier than do conventional MR
imaging sequences. However, diffusion-weighted imaging, if performed
in the first 24 hours after the insult, might lead to underestimation of
the extent of injury. When the MR findings are atypical, the differential
diagnosis of neonatal encephalopathy also should include congenital
and metabolic disorders and infectious diseases. Despite recent
advanc-es in the MR imaging–based characterization of thadvanc-ese conditions, the
clinical history must be borne in mind to achieve an accurate diagnosis.
©RSNA, 2010 • radiographics.rsna.org
MR Imaging for
Diag-nostic Evaluation of
Encephalopathy in
the Newborn
1
ONlINE-ONly CME See www.rsna .org/education /rg_cme.html lEARNING OBJECTIVES After reading this article and taking the test, the readerwill be able to:
List the possible
■
causes of encepha-lopathy in the new-born. Describe optimal ■ neonatal transport, monitoring, and MR technique. Identify normal ■
and abnormal ap-pearances of the neonatal brain on MR images and re-late them to clinical manifestations.
Abbreviations: ADC = apparent diffusion coefficient, ETL = echo train length, FLAIR = fluid-attenuated inversion recovery, ICU = intensive care
unit, SNR = signal-to-noise ratio, TE = echo time, TR = repetition time
RadioGraphics 2010; 30:763–780 • Published online 10.1148/rg.303095126 • Content Codes:
1From the Department of Diagnostic Imaging (M.M.S., J.P.S.F., C.R.) and Division of Neonatology (H.W.), Hospital for Sick Children and University
of Toronto, 555 University Ave, Toronto, ON, Canada M5G 1X8. Recipient of a Certificate of Merit award for an education exhibit at the 2008 RSNA Annual Meeting. Received June 4, 2009; revision requested August 27 and received November 3; accepted November 17. For this CME activity, the authors, editors, and reviewers have no relevant relationships to disclose. Address correspondence to M.M.S. (e-mail: [email protected]).
©RSNA, 2010
See last page
TEACHING POINTS
it is increasingly used in clinical practice as the main imaging method for detecting neonatal brain injury. The article reviews the use of MR techniques to determine the cause of encephalop-athy in the newborn. Particular attention is given to the optimization of MR imaging and spectros-copy protocols for the evaluation of the preterm and full-term neonatal brain. Normal findings (in particular, myelination and cortical infolding) at various stages of development are reviewed to provide a baseline for recognition of hypoxic-ischemic brain injury and other, less common causes of encephalopathy in neonates.
Causes of
Encephalopathy in the Newborn
Neonatal encephalopathy may result from hypoxic-ischemic injury (by far the most common cause), infectious diseases, metabolic disorders, trauma, and congenital disorders. We use the term
hypoxic-ischemic injury to designate any brain impairment
caused by insufficient oxygenation and blood flow. This term should not be confused with
hypoxic-isch-emic encephalopathy, a condition that is diagnosed
on the basis of specific clinical findings of profound acidosis, a poor Apgar score (0–3) at birth, seizure, coma, hypotonia, and multiorgan dysfunction.
It is crucial to consider the clinical history when interpreting MR studies of encephalopathic neonates: The gestational age at birth is predictive of the pattern of hypoxic-ischemic injury, with the pattern in preterm infants (those with a gestational age of less than 36 weeks) differing from that in full-term neonates (those with a gestational age of 36 weeks or more) (Fig 1). The time lag between the hypoxic-ischemic insult (eg, asphyxia at birth, fetal distress before delivery) and the MR study also affects the findings, especially those at diffu-sion-weighted imaging, with the appearance of the brain returning to normal or near normal within 5–7 days after an insult; thus, knowing the time of onset of encephalopathy is helpful.
Encephalopathy due to hypoxic-ischemic injury usually manifests within the first few hours after birth. If encephalopathy occurs later (eg, a few days after birth) and without an obvious reason, meta-bolic and infectious causes must be considered (1).
A clinical history that includes a low Apgar score, need for resuscitation, decreased cord arterial
parietal and occipital lobe changes in a full-term neonate (Fig 2). In addition, an elevated level of unconjugated bilirubin may cross the blood-brain barrier and cause acute kernicterus with resultant increased signal intensity in the globus pallidus on T1-weighted images, although such occurrences are uncommon because of the widespread use of phototherapy (Fig 3). Medical treatment adminis-tered to neonates also may affect the MR findings: Propylene glycol (1,2-propanediol), a preservative used in oral phenobarbital and dilantin formula-tions, causes an inverted doublet at 1.1 ppm in MR spectra obtained with an intermediate echo time (TE) of 135–144 msec, a finding that may mimic the lactate resonance peak (2). Total parenteral nutrition, which contains manganese, produces increased signal intensity similar to that caused by kernicterus in the globus pallidus on T1-weighted images. A history of hypothermia therapy, which is frequently used to manage hypoxic-ischemic injury, also is important because such therapy is associ-ated with a reduction in the extent and severity of lesions in the basal ganglia and thalamus (3).
Preparation and Transport of
Neonates to the MR Imaging Suite
Successful MR imaging in infants starts well before the MR data acquisition. Communica-tion with staff in the neonatal intensive care unit (ICU) is critical to ensure that the neonate does not wait in the MR imaging suite. The use of dedicated MR-compatible incubators with built-in coils can save considerable time built-in transport and improve patient safety. At our institution, highly trained personnel move the infant to the MR imaging suite and are responsible for arranging the multiple tubes and for monitor-ing. At bedside in the ICU, trained nursing personnel replace the standard-length tubes with extension tubes to allow the administra-tion of supportive medicaadministra-tions and fluids to be continued from outside the MR imaging suite. The exchange of tubes and connection of moni-tors while the patient is still in the neonatal ICU helps minimize commotion around the patient in the MR imaging suite. Neonates’ vital signs are prone to fluctuate, and several parameters must be closely monitored. These may be most easily recalled by using the acronym STABLE, for sugar, temperature, artificial breathing, blood pressure, and laboratory test results. Strategies
Figure 3. Neonatal acute kernicterus. Axial
T1-weighted MR image shows bilateral abnor-mal increased signal intensity in the globus pal-lidus (arrows).
Figure 2. Neonatal
hypoglyce-mia. Axial diffusion-weighted MR image demonstrates restricted water diffusion in both occipital lobes (arrows) and in the sple-nium of the corpus callosum.
for preventing movement of the infant dur-ing MR acquisitions include swaddldur-ing (which also helps keep the child warm) and use of a vacuum cushion. If needed, oral chloral hydrate sedation also may be used. Noise attenuation is particularly important and generally is achieved with two layers of protective apparatus (sponge ear plugs and commercially available dedicated neonatal earmuffs). Cardiac monitoring is performed with a pulse oximeter and electro-cardiographic system that are MR compatible. An MR-compatible infusion pump, ventilator, and resuscitation equipment with small-bore laryngoscope and endotracheal tubes should be kept in readiness. If an MR-compatible infusion
pump is unavailable, long extension tubes may be used with the infusion pump located just outside the door of the MR suite.
MR Techniques and Protocols
The acquisition of brain MR images of diagnos-tic quality requires a high signal-to-noise ratio (SNR) and thus the use of a head coil of the appropriate size. Because the field of view at MR imaging of the neonatal brain is small, the SNR is relatively poor if a conventional adult head coil is used; the smaller the diameter of the coil, the higher the SNR (Fig 4). If a dedicated neonatal
Figure 4. Photograph shows a neonatal head coil
with a diameter of approximately 17 cm, which is posi-tioned near the middle of the table, and an adult head coil, which is positioned closer to the magnet bore. A higher SNR is obtained when the smaller coil is used for MR imaging of the neonatal brain.
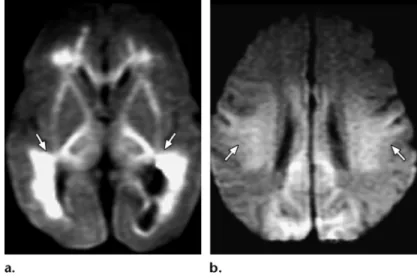
Figure 1. Hypoxic-ischemic injury. (a) Axial diffusion-weighted MR
image obtained in a preterm neonate shows a predominantly periven-tricular pattern of hypoxic-ischemic injury (arrows). (b) Axial diffusion-weighted MR image obtained in a full-term neonate shows a perirolandic and posterior parasagittal pattern of hypoxic-ischemic injury (arrows).
and magnetic susceptibility) is increasing. The standard MR sequences used in adults must be adapted for use in neonates; the neonatal brain has longer T1 and T2 relaxation times because of its higher water content and lower protein and lipid contents. To optimize both the SNR and the contrast between white matter and gray matter in neonates, the repetition time (TR) in T1- and T2-weighted imaging sequences must be increased.
For T1-weighted sequences, the standard TR of 400–500 msec should be increased to 800–850 msec; for T2-weighted sequences, the standard TR of 3500–5000 msec should be increased to 9000–10,000 msec (Fig 5). The use of fast spin-echo sequences with an increased ETL allows these changes to be made without increasing the head coil is not available, a knee coil may be
substituted with similar results. The relationship between the diameter of the head coil and the SNR is described by the following equation:
SNR ∝ Sid
[
(B0•VV)√T
]
, CR5/2
where Sid is the ideal signal, VV is the voxel volume, T is the acquisition time, and CR is the coil radius.
Most neonatal MR studies are performed by using 1.5-T systems, although the availability of 3.0-T systems (with inherently higher SNR
Figure 5. (a, b) Axial T1-weighted MR images of the neonatal brain.
Im-age obtained with an optimized sequence (TR msec/TE msec = 800/20) (a) provides better contrast resolution than an image obtained with a standard sequence (400/14) (b). (c, d) Axial T2-weighted MR images of the neonatal brain. Image obtained with an optimized sequence (9000/250; echo train length [ETL] = 27) (c) provides higher SNR than an image obtained with a standard sequence (3742/105) (d).
Protocol for MR Evaluation of Neonatal Encephalopathy
Priority of Sequence Type of Sequence Acquisition Time Image Showing Normal Features Image Showing Abnormal Features
1 Diffusion-weighted imaging 45 sec Fig 7a Fig 7b
2 T1-weighted imaging 4 min 35 sec Fig 8a Fig 8b
3 T2-weighted imaging 3 min 17 sec Fig 9a Fig 9b
4 T2*-weighted imaging 3 min 47 sec Fig 10a Fig 10b
reduced SNR (6). However, the use of a decreased
b value results in decreased diffusion weighting. In
our experience (obtained while performing four or five brain MR studies per week in newborn children), b values of 800 and 1000 sec/mm2 work well for preterm and full-term infants, respectively.
It is important to apply many different se-quences so as to collect as much information as possible. At our institution, MR sequences are ap-plied in order of their priority, in case the status of the patient deteriorates or patient motion becomes intrusive before all the planned sequences have been completed. In neonates with encephalopathy of unknown cause, diffusion-weighted imaging sequences are potentially the most informative and therefore are applied first (Table). Diffusion-weighted imaging is performed in the axial plane (Fig 7). If desired, high-quality coronal diffusion-weighted images also can be obtained, because time needed for each sequence application. The
resolution lost because of the increased ETL is re-gained with the longer T1 and T2 relaxation times in the neonatal brain (4). The high water content in the extracellular space and rapid water molecu-lar diffusion affect the appearance of the neonatal brain on diffusion-weighted images. The apparent diffusion coefficient (ADC) values in white matter reach their maximum at approximately 28 weeks of gestational age (Fig 6a). At that developmental stage, diffusion in the cortex is more restricted because of the higher ratio of cells to extracellular space. With maturation and myelination, a decline in ADC values and an increase in relative anisot-ropy of white matter occur because of extracellular water exclusion (Fig 6b) (5). A maximum b value of 750–800 sec/mm2, which is lower than the value typically used in adults, has been proposed for use in neonatal studies because, with the relatively high ADC values of the neonatal brain, the use of a b value higher than 800 sec/mm2 results in a
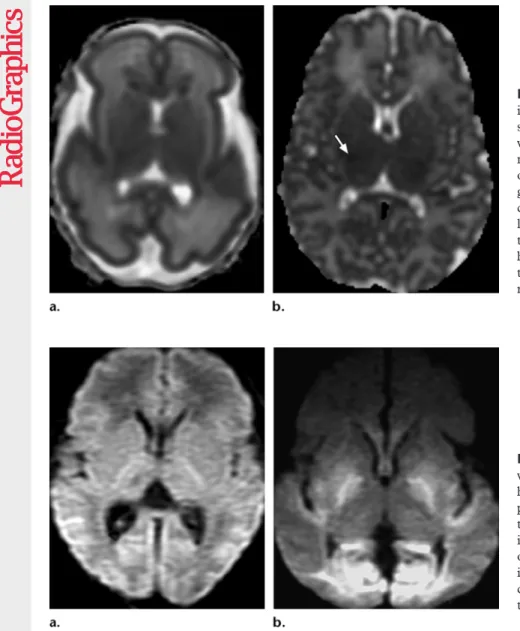
Figure 6. (a) ADC map obtained
in a neonate at 26 weeks of gestation shows moderately decreased cortical water diffusion and increased white matter water diffusion. (b) ADC map obtained in a neonate at 38 weeks of gestation shows more limited water diffusion than in a, with resultant lower signal intensity in white mat-ter. Note the region of slight signal hypointensity in the lateral aspect of the thalamus (arrow), a finding that represents myelination.
Figure 7. (a) Axial
diffusion-weighted MR image obtained in a healthy neonate shows a normal ap-pearance of the basal ganglia and temporal and occipital lobes. (b) Ax- ial diffusion-weighted MR image obtained in a neonate with hypoxic-ischemic injury shows restricted diffusion in the basal ganglia and temporal and occipital lobes.
Figure 9. (a) Axial T2-weighted MR image obtained in a healthy neonate
shows a normal appearance of the thalamus and basal ganglia. (b) Axial T2-weighted MR image obtained in a neonate with hypoxic-ischemic injury shows increased signal intensity in the thalamus and basal ganglia.
Figure 8. (a) Axial T1-weighted MR image obtained in a healthy neonate
shows a linear area of high signal intensity (arrow), the normal appearance of the posterior limb of the internal capsule. (b) Axial T1-weighted MR image obtained in a neonate with severe hypoxic-ischemic injury 5 days after birth shows high-signal-intensity lesions in the posterior aspect of the putamen and ventral and lateral aspects of the thalamus, with attenuation of the physiologic bright stripe in the internal capsule.
foci (which also may have hyperintense signal on T1-weighted sequences) and for depicting cer-ebral sinovenous, cortical venous, and medullary venous thrombosis (Figs 9, 10).
MR spectroscopy performed with an interme-diate echo time (TE) of 135–144 msec within a region of interest positioned in the basal ganglia is useful for detecting a significant amount of lac-tate, which appears as an inverted doublet at 1.3 ppm in spectra obtained immediately after acute hypoxic-ischemic insults and in the presence of metabolic (mitochondrial) disorders. Increased lactate-to-creatine peak-area ratios (7) and reduced absolute concentrations of N-acetylas-partate and choline measured in the basal ganglia at MR spectroscopy were found to be predictive of poor neurologic outcome in full-term neonates with asphyxia (8). However, two potential pitfalls in the interpretation of such findings must be considered: First, the N-acetylaspartate peak is neonates lack pneumatized paranasal sinuses,
which cause susceptibility artifact.
Next, we typically apply an axial T1-weighted sequence, which is ideal for depicting myelina-tion, ischemia, and subacute hemorrhage in the putamen, thalamus, and posterior limb of the internal capsule—features that may have impor-tant prognostic implications (Fig 8).
Axial T2-weighted sequences provide good contrast between gray and white matter, allow-ing accurate characterization of the cortex and deep gray matter in the premature brain and identification of any white matter signal intensity abnormalities (eg, diffuse excessive high signal intensity in a preterm neonate at term-equivalent age). Gradient-echo T2*- and susceptibility-weighted sequences are ideal for demonstrating hemorrhage and distinguishing it from ischemic
Figure 10. (a) Axial T2*-weighted MR image obtained in a healthy
neo-nate shows a normal appearance of the brain, with no evidence of hem-orrhage. (b) Axial T2*-weighted MR image obtained in a neonate with asphyxia shows multiple low-signal-intensity foci adjacent to the superior margin of the left lateral ventricle, findings indicative of small hemorrhages.
Figure 11. (a) Normal MR spectrum obtained in a healthy full-term neonate shows that choline
is the most prominent metabolite and the N-acetylaspartate concentration is relatively low. (b) MR spectrum obtained with an intermediate TE (144 msec) in a full-term neonate after the administra-tion of phenobarbital for seizures shows an inverted peak centered at 1.1 ppm (open arrow), a feature that represents propylene glycol. This feature should not be confused with the inverted doublet of lac-tate at 1.33 ppm (solid arrow).
normally low in newborns (Fig 11a); it does not reach adult levels until the age of approximately 2½ years. Second, a small amount of lactate is normal in the brain tissue of preterm newborns. A further spectroscopic sequence with a short TE (30–35 msec) should be included in the protocol if a metabolic disorder is suspected; this sequence allows the identification of the metabolite peaks that typify maple syrup urine disease (branched-chain amino acids, at 0.9 ppm) and nonketotic hyperglycemia (glycine, at 3.56 ppm).
Additional sequences may be applied if spe-cific clinical indications are present. Gradient-echo three-dimensional T1- and T2-weighted sequences provide thin-section image data that
are suitable for multiplanar reformatting. If signal intensity within the venous sinuses on images obtained with the initial sequences is suggestive of sinovenous thrombosis, MR venography may be performed with phase-contrast imaging or a time-of-flight technique.
Neonatal brain MR images should be reviewed by the radiologist immediately after their acquisi-tion so that if addiacquisi-tional imaging with other se-quences is necessary, it can be performed during the same evaluation. Transporting the neonate a second time from the ICU to the MR imaging suite for a repeat evaluation or additional acquisi-tions incurs new risks and should be avoided.
Normal Myelination
Normal myelination in the brain is well depicted on T1-weighted MR images. Myelination causes shortening of T1 relaxation time in white mat-ter structures because of the increased amount of glycolipids (eg, galactocerebroside) and decreased number of free water molecules, with the latter change occurring because of hydrogen binding to glycolipids and cholesterol. As a general rule, myelination in the brain proceeds from the caudal to the rostral aspect, from the posterior to the anterior aspect, and from the center to the periph-ery. Thus, the dorsal brainstem, which contains the medial longitudinal fasciculus and medial lemnis-cus, undergoes myelination at 24–28 weeks of ges-tation, before the ventral brainstem (Fig 12). The subthalamic nucleus and the ventrolateral nucleus of the thalamus also have undergone myelination by 28 weeks of gestation. The posterior portion of the posterior limb of the internal capsule should show signal hyperintensity on T1-weighted images obtained at 36–37 weeks of gestation. Myelination of the corticospinal tract progresses in the cranial direction and is seen in the central corona radiata and perirolandic white matter at 38–40 weeks. In the preterm brain, T2-weighted imaging may show myelin in gray matter structures (vestibular nuclei, medial geniculate bodies, lateral geniculate bodies, inferior olivary nucleus, and inferior colliculi) before T1-weighted imaging does, whereas T1-weighted imaging is better at depicting myelin in white matter tracts of the medial longitudinal fasciculus, medial lemniscus, and lateral lemniscus (9).
Migrational Milestones
Until 28–30 weeks of gestational age, the germi-nal matrix is depicted on T2-weighted images as a low-signal-intensity band that extends along the ventricular wall. The band is most prominent at the caudothalamic groove (ganglionic eminence) (Fig 13a). Before 33 weeks of gestational age, the white matter has a laminated appearance, with three alternating bands of different signal inten-sity on T2-weighted images (Fig 13b). Frontal horn “caps” (Fig 13b) and posterior periventricu-lar “arrowheads” represent white matter “cross-roads” containing dense extracellular matrix. Association, commissural, and projection fibers at these crossroads are modified by axonal guidance molecules and microglia (10).
Normal Sulcal Development
Brain sulcation in preterm neonates proceeds through the same stages as in fetuses of the same gestational age but is delayed. Specific reported findings have varied, depending on whether the
Figure 12. Progression of myelination. (a, b) Axial T1-weighted MR
images obtained in a neonate at 28 weeks of gestation show myelination in the dorsal brainstem (arrow in a) and subthalamic nuclei (arrow in b).
(c, d) Axial T1-weighted MR images obtained in a neonate at 38 weeks of
gestation show areas of hyperintense signal in the posterior limb of the in-ternal capsule (arrow in c) and the perirolandic cortex (arrow in d).
sulci were evaluated at ultrasonography (US), fetal MR imaging, or pathologic analysis and be-cause of differences in spatial resolution, methods of study, and, possibly, errors in estimating ges-tational age. The ages specified here are approxi-mations based on the only controlled study of sulcation, which was performed by Chi et al (11).
The interhemispheric fissure provides distinct longitudinal cleavage between the cerebral hemi-spheres by the 10th gestational week. The sylvian fissure is the earliest fetal sulcus to develop along the lateral surface of the brain; it initially appears as a shallow depression at the 14th gestational week and is well formed by the 19th gestational week. The next sulci to appear are the calcarine, parieto-occipital, and cingulate sulci, which are shallow depressions at 16–18 weeks of
gesta-tion and are better formed at 20–22 weeks. The rolandic sulcus appears as a shallow depression at 20 weeks of gestation and is better formed at 24–25 weeks (Fig 14). The superior temporal and intraparietal sulci are visible at 23–26 weeks, and the superior frontal, pre- and postcentral, and middle temporal sulci are seen at 26–28 weeks of gestational age. With increasing age, the sulci become deeper, broader, and more tortu-ous. By 34 weeks, all primary and most second-ary sulci are present. Gyri and sulci in periro-landic and medial occipital areas develop before those in frontobasal and frontopolar areas and the anterior temporal lobe.
Figure 14. Progression of
sulcation. Top: Parasagittal (left), midline sagittal (middle), and axial (right) T2-weighted MR images obtained in a neo-nate at 25 weeks of gestation depict the parieto-occipital sulcus (white arrow) and a ru-dimentary central sulcus (black arrow), but no superior tempo-ral sulcus. Bottom: Parasagittal (left), midline sagittal (middle), and axial (right) T2-weighted MR images obtained in a neo-nate at 29 weeks of gestation show the superior temporal sulcus (arrowhead) and deep-ening of the parieto-occipital (white arrow) and central (black arrows) sulci.
Figure 13. Progression of cell
migra-tion. (a) Axial T2-weighted MR image obtained in a neonate at 29 weeks of gestation shows the germinal matrix as a hypointense linear structure that is thicker at the level of the ganglionic eminence (ar-row). (b) Axial T2-weighted MR image obtained in a neonate at 33 weeks of gesta-tion shows alternating hyperintense and hypointense bands representing layered white matter structures in the parieto-occipital region (white arrows) and frontal caps adjacent to the frontal horns (black arrows).
Figure 15. Axial T2-weighted MR
im-age obtained in a neonate at 29 gestational weeks shows extensive right periventricular hemorrhagic infarction.
cent of those who survive demonstrate significant deficits in subsequent development. In preterm infants, hypoxic-ischemic injury is even more common; it occurs in 5% of infants born before 32 weeks of gestational age. Up to 19% of infants born before 28 weeks of gestation develop cere-bral palsy. Approximately 50% of cases of cerecere-bral palsy occur in infants born prematurely (12).
The common pathophysiologic processes that result in hypoxic-ischemic injury are diminished cerebral blood flow (ischemia) and reduced blood oxygenation (hypoxemia). Brain ischemia leads to a shift in metabolism from oxidative phosphorylation to anaerobic oxidation, which is highly inefficient. This change causes rapid energy depletion, acidosis, release of inflamma-tory mediators and excitainflamma-tory neurotransmitters (particularly glutamate), free radical formation, calcium accumulation, and lipid peroxidation (13). Severe energy depletion results in cell death due to necrosis; with lesser degrees of energy depletion, neurons may undergo programmed death (apoptosis). In the premature neonatal brain, hypoperfusion results in a periventricular border zone of white matter injury (14). In the full-term neonate, hypoperfusion results in injury to the subcortical white matter and the parasag-ittal cortex. Periventricular leukomalacia in the preterm neonate is believed to result from injury to oligodendrocyte precursors or premyelinating oligodendrocytes. The degree of maturation also influences the state of regional metabolism and susceptibility to injury in the neonatal brain. In the event of severe hypoperfusion, the vulner-able regions of the brain are those with increased metabolic activity and a greater degree of myeli-nation, particularly the thalamus and brainstem in premature neonates (born before 36 weeks of gestation) and the lateral aspects of the thalamus, globus pallidus, posterior aspect of the puta-men, hippocampus, brainstem, and sensorimotor cortex in full-term infants (born at 36 gestational weeks or later). Mild to moderate hypoperfusion causes a redistribution of cerebral blood flow to these metabolically more active structures, an oc-currence that results in injury predominantly to the watershed areas. In summary, different pat-terns of brain injury may be observed, depending
on three primary factors: brain maturity at the time of the insult and the severity and duration of hypoperfusion.
Findings in Preterm Neonates
Severe hypoxic-ischemic insults to the premature brain typically injure the thalamus, anterior part of the vermis, and dorsal brainstem. Involvement of the basal ganglia, hippocampus, cerebellum, and corticospinal tracts also may be seen. Injury to the basal ganglia (which undergo myelination at 35–36 weeks of gestation) is usually less exten-sive than that to the thalamus, which undergoes myelination at 24–25 weeks of gestation.
Mild to moderate hypoxic-ischemic injury may result in a germinal matrix hemorrhage, periven-tricular leukomalacia, or both. The germinal matrix is highly vascularized and especially active until the end of the second trimester, gradually involuting during the third trimester. Germinal matrix capillaries consist only of endothelium (ie, a tissue layer one cell thick), are highly sensitive to vascular pressure changes, and may rupture, giving rise to hemorrhages of variable severity. Germinal matrix hemorrhages usually occur during the first 24 hours of life (15). Cranial US is suitable for germinal matrix hemorrhage evaluation because it can be performed in the ICU and involves only minimal disturbance to the infant. MR imaging with gradient-echo or susceptibility-weighted se-quences has higher sensitivity than US for detect-ing small germinal matrix hemorrhages and is useful for depicting periventricular venous infarc-tion in grade 4 germinal matrix hemorrhages (16).
Periventricular venous infarction is a unilateral, hemorrhagic, triangular lesion caused by thrombo-sis of medullary veins that drain the periventricular brain parenchyma (Fig 15). This condition is seen in 5%–8% of infants with very low birth weight. Neuroimaging predictors of congenital hemiple-gia in periventricular venous infarction include involvement of the peritrigonal region and absence of normal myelination of the internal capsule at term-equivalent age (17).
A germinal matrix hemorrhage with posthem-orrhagic ventricular dilatation (grade 3 germinal matrix hemorrhage) was also associated with poorer neurodevelopmental outcome and lower developmental quotients. In addition, an intra-ventricular hemorrhage may cause iron-induced white matter injury (18).
Cerebellar hemorrhages occur in approxi-mately 25% of preterm infants with very low birth weight. They are assumed to arise from the germinal matrix zones in the external granule cell layer and the subependymal layer of the roof of the fourth ventricle (Fig 16). Cerebellar hemor-rhages that are small and are viewed through the anterior fontanelle are easily missed at US. Cerebellar hemorrhagic injury in preterm infants is associated with a high prevalence of long-term disabilities and may play a role in cognitive, learning, and behavioral dysfunction, which is more common and profound if the vermis is involved (19).
Periventricular leukomalacia, or white matter injury of prematurity, is characterized primar-ily by areas of focal necrosis in the deep white matter (cystic variant) or more diffuse injury to premyelinating oligodendrocytes (noncystic vari- ant). Periventricular leukomalacia is most com-monly seen adjacent to the trigones of the lateral ventricles and to the Monro foramen, areas that correspond to the watershed zones in periven-tricular white matter in the premature brain. The condition probably represents toxic injury to premyelinating oligodendrocytes because of cerebral ischemia, reperfusion, or both. The toxic injury may be mediated by glutamate (20). Recent data indicate that infection or inflamma-tion in a setting of postnatal sepsis or necrotiz-ing enterocolitis can potentiate hypoxic-ischemic insults to the brain and convert a minor insult to a seriously damaging event by inducing the release of proinflammatory cytokines, which in turn cause a disturbance in cerebrovascular autoregulation (21). At MR imaging in the first 2–5 days after injury, shortening of T1 relax-ation time produces multiple foci of high signal intensity in the periventricular white matter on T1-weighted images (Fig 17a). These foci initially have high signal intensity also on T2-weighted images; after 6–7 days, T2 shortening can be seen (22). Unlike hemorrhagic lesions, the lesions in periventricular leukomalacia do not produce a blooming artifact on T2*- or suscep-tibility-weighted images. Diffusion-weighted images show early restriction of diffusion with ischemia and coagulative necrosis, findings that normalize within 5–7 days (Fig 17b). End-stage periventricular leukomalacia manifests as a reduction in volume of the periventricular white matter and the centrum semiovale, with passive dilatation and irregularity of the ventricular wall.
Figure 16. Axial T2-weighted
MR images obtained in a neo-nate (25 gestational weeks) with severe asphyxia show abnor-mally high signal intensity in the thalamus and putamen (a) and hemorrhagic foci in the cerebellum (arrows in b). The infant did not survive.
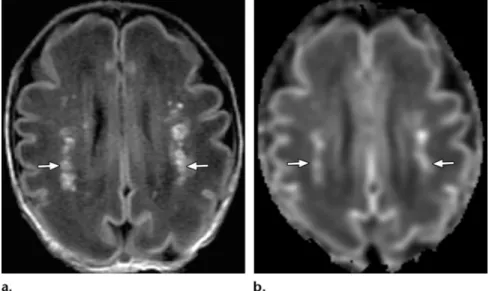
Figure 17. MR imaging appearance of acute periventricular leukomalacia. Axial
T1-weighted (a) and diffusion-weighted (b) images obtained in a neonate at ap-proximately 30 gestational weeks show multiple bilateral foci of high signal inten-sity due to T1 shortening (arrows in a) and restricted diffusion (arrows in b) in the periventricular white matter. This multifocal pattern of injury is markedly different from that depicted in Figure 1a, in which confluent areas of restricted diffusion are seen.
T2-weighted and fluid-attenuated inversion re-covery (FLAIR) images may demonstrate abnor-mal signal hyperintensity in periventricular white matter if the insult occurred after 28–30 weeks of gestational age; before that stage, the immature brain cannot mount a gliotic response (Fig 18). Thinning of the corpus callosum, particularly in the posterior body and splenium, is a character-istic late feature of periventricular leukomalacia. Spastic diplegia and visual impairment are the most common long-term neurologic sequelae.
Scattered punctate white matter abnormali-ties are relatively common findings in preterm brains. Although they probably have the same pathophysiologic origin as periventricular leu-komalacia, they are not predictive of an adverse developmental outcome (23). Diffuse excessive high signal intensity on T2-weighted images (Fig 19) is found in white matter in 65%–75% of preterm infants at term-equivalent age and correlates with a reduced developmental quotient at 18 months of age. ADC values obtained in neonatal brains in which diffuse excessive high signal intensity is observed in white matter on T2-weighted MR images are significantly higher than ADC values in neonatal brains with a nor-mal appearance of white matter on T2-weighted MR images. The abnormal high signal intensity may represent a delay in maturation or may be secondary to injury (23). The exact significance
of the finding is controversial because whether the high signal intensity in cerebral white matter on T2-weighted images is within normal limits or is abnormal is subject to individual interpreta-tion. In our opinion, a perceived diffuse increase in signal intensity at T2-weighted imaging has greater clinical significance when it is associated with other abnormalities and with a clinical his-tory suggestive of significant injury.
Findings in Full-Term Neonates
Hypoxic-ischemic brain injury in full-term neo-nates is caused by cerebral blood flow impairment, which may result from various intrauterine condi-tions specific to the fetus (eg, fetomaternal hemor-rhage, fetal thrombosis, or fetal bradycardia) or the mother (eg, hypotension, preeclampsia, chronic vascular disease, abruptio placentae, asthma, pul-monary embolism, pneumonia, or severe anemia).
Postnatal asphyxia may be the result of severe hyaline membrane disease, pneumonia, meco-nium aspiration, or a congenital heart anomaly.
Mild to moderate hypoxic-ischemic injury in a full-term neonate causes lesions in the watershed areas, the parasagittal cortex, and subcortical white matter, while sparing the brainstem, cer-ebellum, and deep gray matter structures. Severe hypoxic-ischemic injury involves the ventral and lateral aspects of the thalamus, posterior aspect of the putamen, perirolandic regions, and corti-cospinal tracts. MR imaging is the most accurate modality for evaluating hypoxic-ischemic brain
pearance of chronic periven-tricular leukomalacia. (a) Cor-onal FLAIR image obtained in a 4-year-old patient shows an irregular contour and enlarge-ment of the atria with adjacent gliosis (arrows) due to an insult that occurred after 28 weeks of gestational age. (b) Axial T2-weighted image obtained in a 5-year-old patient shows a vol-ume loss in peritrigonal white matter because of periventricu-lar leukomalacia.
injury in the full-term neonate. Conventional sequences may show lesions with long T1 and T2 relaxation times in the acute phase (1–2 days after injury). These findings gradually become more conspicuous, with marked signal hyper-intensity on T1-weighted images obtained 3 days after injury and on T2-weighted images obtained 6–10 days after injury (24) (Fig 9b). Abnormal signal intensity of the posterior limb of the internal capsule with loss of physiologic high signal intensity on T1-weighted images is an excellent predictor of abnormal outcome in full-term infants with hypoxic-ischemic enceph-alopathy (25) (Fig 8b). The addition of FLAIR and contrast-enhanced imaging sequences to the combination of T1-, T2-, and diffusion-weighted imaging sequences does not contribute to the detection of hypoxic-ischemic brain damage (26). A finding of restricted water diffusion at
diffu-sion-weighted imaging has the highest sensitivity for early detection of injury. However, diffusion-weighted imaging performed during the first 24 hours often leads to underestimation of the extent of injury (Fig 20). Abnormalities seen at diffusion-weighted imaging generally peak at 3–5 days after the insult and subsequently normalize. It is important to note that 15% of lesions in the basal ganglia and thalamus demonstrate normal ADC values because the insult occurred some time before delivery or because of delayed cell death (apoptosis) (27). Therefore, in the absence of abnormalities at diffusion-weighted imaging performed during the first 24 hours, evaluation with proton MR spectroscopy or a follow-up MR study 2–4 days later may be useful. Visual analysis of diffusion-weighted images obtained in infants
Figure 19. Axial
T2-weighted MR image obtained in a preterm neonate (28 ges-tational weeks) at a corrected age of 40 weeks (a) shows a diffuse increase in signal intensity in white matter in comparison with that in a full-term neonate (b).
Figure 21. MR imaging
appear-ances of chronic hypoxic-ischemic injury. (a) Axial FLAIR image ob-tained 1 month after a severe brain insult shows multicystic encephalo-malacia in the frontal and parieto-occipital regions (arrows). (b) Axial T2-weighted image obtained in another neonate 3 months after a brain insult depicts bilateral mush-room-shaped gyri (arrows), findings indicative of ulegyria.
with an extensive supratentorial abnormality (“white cerebrum”) may be difficult; however, the appearance of the cerebellum, which is usu-ally spared from ischemic injury in full-term neonates, may be used as a reference standard (Fig 20). Quantitative evaluation also may be helpful: White matter ADC values of less than 1.1 × 10⁻³ mm2/sec and thalamic ADC values of less than 0.8 × 10⁻³ mm2/sec are invariably associated with true ischemic lesions, even when the ap-pearance in those areas on standard MR images
is not definitively abnormal (27). In infants with moderate or severe central gray matter lesions but an initially normal MR imaging appearance of white matter, a delayed increase in ADC values and T1 and T2 relaxation times may occur, with subsequent atrophy of the affected white matter. This increase in ADC values could be related to the apoptotic death of oligodendrocytes; by con-trast, a decrease in ADC values is expected in the presence of cell necrosis. In the chronic stage, ex-tensive injury leads to multicystic encephalomala-cia and generalized atrophy (Fig 21a), whereas localized injury gives rise to ulegyria (mainly in emic encephalopathy in a neonate.
Top: Axial diffusion-weighted im-ages obtained within 24 hours after birth show relatively subtle increases in signal intensity in the perirolandic regions, posterior aspect of the puta-men, lateral aspects of the thalamus, and corpus callosum. Bottom: Axial diffusion-weighted images obtained 4 days after birth show diffuse ab-normally high signal intensity in the supratentorial parenchyma in comparison with the superior aspect of the cerebellum, which has normal signal intensity.
Figure 22. Coronal
diffusion-weighted MR image obtained in a neonate with seizures 2 days after birth shows recent infarction of the left cerebral hemisphere with prewallerian degeneration of the left corticospinal tract (arrows), findings predictive of congenital hemiparesis.
perirolandic areas) (Fig 21b) and high-signal-in-tensity lesions in the posterior aspects of both the putamen and thalamus on T2-weighted images.
Imaging-based Differential Diag-
nosis of Neonatal Encephalopathy
The differential diagnosis of neonatal encepha-lopathy includes metabolic encephaencepha-lopathy from inborn errors of metabolism, congenital and neonatal central nervous system infections, con-genital malformations, and severe birth trauma. Perinatal stroke due to either focal infarction or cerebral venous thrombosis most commonly manifests with isolated seizures within 1 week
Figure 23. Axial diffusion-weighted MR images of a neonate with onset of
enceph-alopathy on the 5th day of life show restricted diffusion in the internal capsules (a), dorsal brainstem, corticospinal tracts (white arrows in b), and cerebellum (black ar-rows in b). Maple syrup urine disease was diagnosed at urinalysis.
after birth. Diffusion-weighted MR imaging has high sensitivity for the depiction of acute brain infarction and prewallerian degeneration of the corticospinal tracts, findings that are predictive of congenital hemiparesis (28) (Fig 22).
The main metabolic causes of neonatal enceph-alopathy are congenital lactic acidosis (the com-monest of these is pyruvate dehydrogenase defi-ciency), urea cycle disorders, and amino acidurias. Maple syrup urine disease is related to a deficiency in the metabolism of branched-chain amino acids. The most severe, classic neonatal form of this disease is characterized by early postnatal onset and rapidly progressive neurologic deterioration. The MR imaging appearance is highly characteris-tic, with restricted water diffusion in the cerebellar white matter, dorsal brainstem, cerebral pedun-cles, posterior limb of the internal capsule, and posterior centrum semiovale (29) (Fig 23). Recog-nition of this imaging pattern is important to allow
Figure 24. Nonketotic hyperglycinemia. (a) Coronal diffusion-weighted MR image shows restricted diffusion
through the corticospinal tracts (arrows). (b) MR spectrum obtained with a short TE shows an abnormal peak at 3.55 ppm (arrow), a finding indicative of an abnormally high concentration of glycine. The peak also was seen in a spectrum obtained with an intermediate TE.
early treatment. Nonketotic hyperglycinemia is an autosomal recessive inborn error of metabolism caused by a defect in the glycine cleavage system. Resultant elevated levels of glycine in the brain and cerebrospinal fluid cause neurologic impair-ment, which usually manifests soon after delivery. MR imaging findings include ventriculomegaly; absent corpus callosum; restricted water diffusion in the pyramidal tracts, middle cerebellar pedun-cles, and dentate nuclei; and an abnormal glycine peak at 3.55 ppm in MR spectra (Fig 24).
Human parechovirus infection causes enceph-alitis with fever, rash, irritability, and seizures. MR imaging features of human parechovirus include punctate high-signal-intensity white mat-ter lesions on T1-weighted images and symmet-ric foci of restsymmet-ricted diffusion in the subcortical white matter, corpus callosum, optic radiation, internal capsule, and cerebral peduncles on diffusion-weighted images (30) (Fig 25). In the presence of a parechovirus infection, inflamma-tory cytokines that are toxic to premyelinating oligodendrocytes and developing axons may be secreted by microglia (31).
Neonatal encephalitis caused by human herpesvirus 2 is a rare but devastating disease that is associated with high mortality and severe neurologic complications. The disease process is typically much more diffuse than that in adult encephalitis caused by human herpesvirus 1.
Diffusion-weighted imaging usually depicts more extensive disease than standard MR imaging sequences. Lesions may be multifocal or limited to the temporal lobes, cerebellum, or brainstem. Involvement of the deep gray matter nuclei and hemorrhage are common features (32).
Hypotonia and joint contractures that manifest soon after birth may signal the presence of con-genital muscular dystrophy. This condition may be caused by a number of syndromes that involve the central nervous system and may be associated with epilepsy and various other brain and eye abnormalities (33). The best characterized of this group of syndromes are Fukuyama-type congeni-tal muscular dystrophy, Walker-Warburg syn-drome (Fig 26), and muscle-eye-brain synsyn-drome.
Conclusions
MR imaging is a powerful technique for diagnos-tic evaluation of the encephalopathic neonate. However, performing an MR study in a neonate demands particular care with regard to patient transport, monitoring of vital signs, and optimiza-tion of acquisioptimiza-tion techniques (use of appropri-ate coils, sequences, and protocols). Accurappropri-ate interpretation of the findings depends on famil-iarity with the normal appearances of myelina-tion, cell migramyelina-tion, and sulcation at various ges-tational ages. Hypoxic-ischemic injury, the most common cause of encephalopathy in newborns, has characteristic MR imaging patterns that vary according to the degree of brain maturity and the
Figure 25. Axial diffusion-weighted
MR image obtained in an infant with parechovirus-induced encephalitis dem-onstrates symmetric areas of restricted diffusion in the splenium of the corpus callosum and smaller foci in the periven-tricular and subcortical white matter.
Figure 26. (a) Midline sagittal T1-weighted MR image obtained in
a neonate with Walker-Warburg syndrome shows hydrocephalus, a Z-shaped brainstem, a dysplastic cerebellum, hypomyelination, and lis-sencephaly. (b) Magnified view from an axial T2-weighted MR image more clearly shows the cobblestoned appearance of lissencephaly.
severity of the insult. MR findings of hypoxic-ischemic injury have great prognostic value, but the clinical history must be reviewed carefully for information that may help identify the cause of injury. When the clinical history and imaging findings are unusual, metabolic conditions and infectious diseases should be considered among the possible causes. Accurate diagnosis allows the most appropriate therapeutic options to be iden-tified and adequate counseling to be provided.
Acknowledgments.—We thank Margot Taylor, PhD,
and her research team at the Hospital for Sick Chil-dren, University of Toronto, for providing access to data and MR images from their study of preterm neo-nates and for reviewing and commenting on a draft of our manuscript.
References
1. Cowan F, Rutherford M, Groenendaal F, et al. Ori-gin and timing of brain lesions in term infants with neonatal encephalopathy. Lancet 2003;361(9359): 736–742.
2. Barkovich AJ. Normal development of neonatal and infant brain, skull, and spine. In: Pediatric neuroimaging. Philadelphia, Pa: Lippincott Wil-liams & Wilkins, 2005; 57.
3. Rutherford MA, Azzopardi D, Whitelaw A, et al. Mild hypothermia and the distribution of cerebral lesions in neonates with hypoxic-ischemic encepha-lopathy. Pediatrics 2005;116(4):1001–1006.
4. Jones RA, Palasis S, Grattan-Smith JD. MRI of the neonatal brain: optimization of spin-echo param-eters. AJR Am J Roentgenol 2004;182(2):367–372. 5. Schneider JF, Confort-Gouny S, Le Fur Y, et al.
Diffusion-weighted imaging in normal fetal brain maturation. Eur Radiol 2007;17(9):2422–2429. 6. Robertson RL, Ben-Sira L, Barnes PD, et al. MR
line-scan diffusion-weighted imaging of term neo-nates with perinatal brain ischemia. AJNR Am J Neuroradiol 1999;20(9):1658–1670.
7. Fan G, Wu Z, Chen L, Guo Q, Ye B, Mao J. Hypoxia- ischemic encephalopathy in full-term neonate: cor-relation proton MR spectroscopy with MR imaging. Eur J Radiol 2003;45(2):91–98.
8. Boichot C, Walker PM, Durand C, et al. Term neo-nate prognoses after perinatal asphyxia: contribu-tions of MR imaging, MR spectroscopy, relaxation times, and apparent diffusion coefficients. Radiology 2006;239(3):839–848.
9. Counsell SJ, Maalouf EF, Fletcher AM, et al. MR imaging assessment of myelination in the very pre-term brain. AJNR Am J Neuroradiol 2002;23(5): 872–881.
10. Judas M, Rados M, Jovanov-Milosevic N, Hrabac P, Stern-Padovan R, Kostovic I. Structural, immuno-cytochemical, and MR imaging properties of peri- ventricular crossroads of growing cortical pathways in preterm infants. AJNR Am J Neuroradiol 2005; 26(10):2671–2684.
11. Chi JG, Dooling EC, Gilles FH. Gyral development of the human brain. Ann Neurol 1977;1(1):86–93.
ischemic encephalopathy: multimodality imaging findings. RadioGraphics 2006;26(suppl 1):S159– S172.
15. Paneth N, Pinto-Martin J, Gardiner J, et al. Inci-dence and timing of germinal matrix/intraventricular hemorrhage in low birth weight infants. Am J Epide-miol 1993;137(11):1167–1176.
16. Kirton A, Deveber G, Pontigon AM, Macgregor D, Shroff M. Presumed perinatal ischemic stroke: vas-cular classification predicts outcomes. Ann Neurol 2008;63(4):436–443.
17. Roelants-van Rijn AM, Groenendaal F, Beek FJ, Eken P, van Haastert IC, de Vries LS. Parenchymal brain injury in the preterm infant: comparison of cranial ultrasound, MRI and neurodevelopmental outcome. Neuropediatrics 2001;32(2):80–89. 18. Kuban K, Sanocka U, Leviton A, et al. White matter
disorders of prematurity: association with intraven-tricular hemorrhage and ventriculomegaly. The De-velopmental Epidemiology Network. J Pediatr 1999; 134(5):539–546.
19. Limperopoulos C, Bassan H, Gauvreau K, et al. Does cerebellar injury in premature infants contrib-ute to the high prevalence of long-term cognitive, learning, and behavioral disability in survivors? Pe-diatrics 2007;120(3):584–593.
20. Desilva TM, Kinney HC, Borenstein NS, et al. The glutamate transporter EAAT2 is transiently expressed in developing human cerebral white matter. J Comp Neurol 2007;501(6):879–890.
21. Sharma R, Tepas JJ 3rd, Hudak ML, et al. Neonatal gut barrier and multiple organ failure: role of endo-toxin and proinflammatory cytokines in sepsis and necrotizing enterocolitis. J Pediatr Surg 2007;42(3): 454–461.
22. Barkovich AJ. Brain and spine injuries in infancy and childhood. In: Pediatric neuroimaging. 4th ed. Philadelphia, Pa: Lippincott Williams & Wilkins, 2005; 190–290.
first 10 days. AJNR Am J Neuroradiol 1995;16(3): 427–438.
25. Rutherford MA, Pennock JM, Counsell SJ, et al. Abnormal magnetic resonance signal in the internal capsule predicts poor neurodevelopmental outcome in infants with hypoxic-ischemic encephalopathy. Pediatrics 1998;102(2 pt 1):323–328.
26. Liauw L, van der Grond J, van den Berg-Huysmans AA, Palm-Meinders IH, van Buchem MA, van Wezel-Meijler G. Hypoxic-ischemic encephalopathy: diagnostic value of conventional MR imaging pulse sequences in term-born neonates. Radiology 2008; 247(1):204–212.
27. Rutherford M, Counsell S, Allsop J, et al. Diffusion-weighted magnetic resonance imaging in term perinatal brain injury: a comparison with site of le-sion and time from birth. Pediatrics 2004;114(4): 1004–1014.
28. Domi T, deVeber G, Shroff M, Kouzmitcheva E, MacGregor DL, Kirton A. Corticospinal tract pre-wallerian degeneration: a novel outcome predictor for pediatric stroke on acute MRI. Stroke 2009;40 (3):780–787.
29. Blaser S, Feigenbaum A. A neuroimaging approach to inborn errors of metabolism. Neuroimaging Clin N Am 2004;14(2):307–329.
30. Verboon-Maciolek MA, Groenendaal F, Hahn CD, et al. Human parechovirus causes encephalitis with white matter injury in neonates. Ann Neurol 2008; 64(3):266–273.
31. Ma Y, Haynes RL, Sidman RL, Vartanian T. TLR8: an innate immune receptor in brain, neurons and axons. Cell Cycle 2007;6(23):2859–2868.
32. Vossough A, Zimmerman RA, Bilaniuk LT, Schwartz EM. Imaging findings of neonatal herpes simplex vi-rus type 2 encephalitis. Neuroradiology 2008;50(4): 355–366.
33. Barkovich AJ. Congenital malformations of the brain and skull. In: Pediatric neuroimaging. 4th ed. Phila-delphia, Pa: Lippincott Williams & Wilkins, 2005; 291–439.
This article meets the criteria for 1.0 AMA PRA Category 1 CreditTM. To obtain credit, see
www.rsna.org/education /rg_cme.html.
Page 764
It is crucial to consider the clinical history when interpreting MR studies of encephalopathic neonates: The gestational age at birth is predictive of the pattern of hypoxic-ischemic injury, with the pattern in preterm infants (those with a gestational age of less than 36 weeks) differing from that in full-term neonates (those with a gestational age of 36 weeks or more) (Fig 1). The time lag between the hypoxic-ischemic insult (eg, asphyxia at birth, fetal distress before delivery) and the MR study also affects the findings, especially those at diffusion-weighted imaging, with the appearance of the brain returning to normal or near normal within 5–7 days after an insult; thus, knowing the time of onset of encephalopathy is helpful.
Encephalopathy due to hypoxic-ischemic injury usually manifests within the first few hours after birth. If encephalopathy occurs later (eg, a few days after birth) and without an obvious reason, metabolic and infec-tious causes must be considered (1).
Page 766
The standard MR sequences used in adults must be adapted for use in neonates; the neonatal brain has longer T1 and T2 relaxation times because of its higher water content and lower protein and lipid contents. To optimize both the SNR and the contrast between white matter and gray matter in neonates, the repeti-tion time (TR) in T1- and T2-weighted imaging sequences must be increased.
Page 770
The posterior portion of the posterior limb of the internal capsule should show signal hyperintensity on T1-weighted images obtained at 36–37 weeks of gestation.
Page 773
Periventricular leukomalacia, or white matter injury of prematurity, is characterized primarily by areas of focal necrosis in the deep white matter (cystic variant) or more diffuse injury to premyelinating oligodendrocytes (noncystic variant). Periventricular leukomalacia is most commonly seen adjacent to the trigones of the lateral ventricles and to the Monro foramen, areas that correspond to the watershed zones in periventricular white matter in the premature brain. The condition probably represents toxic injury to premyelinating oligodendrocytes because of cerebral ischemia, reperfusion, or both.
Page 774
Mild to moderate hypoxic-ischemic injury in a full-term neonate causes lesions in the watershed areas, the parasagittal cortex, and subcortical white matter, while sparing the brainstem, cerebellum, and deep gray matter structures. Severe hypoxic-ischemic injury involves the ventral and lateral aspects of the thalamus, posterior aspect of the putamen, perirolandic regions, and corticospinal tracts.