A Work Project, presented as part of the requirements for the Award of a Master Degree
in Finance from the NOVA – School of Business and Economics.
THE INTEGRABILITY OF ESG INVESTING INTO ROBO ADVISING
TOBIAS NIKLAS BECKER – 29714
Project carried out on the Master in Finance Program, under the supervision of:
Rafael Zambrana
The Integrability of ESG Investing into Robo Advising
Abstract
Environmental, Social and Governance (ESG) investing and passive asset management are two
distinct trends in financial markets. This research examines whether robo advisors can combine
these two trends by integrating ESG into their passively managed portfolios. On the example of the
ESG portfolio of a German robo advisor, the research finds that ESG is integrable into robo
advising, with limitations. A backtest with a threshold-based rebalancing strategy was performed
over the sample period 05/31/2011 – 10/31/2018. In comparison to its Non-ESG counterpart, the
ESG portfolio does not over- or underperform. Also, its ESG scores are higher. However, the
analysis of a second robo advisor shows the limited integrability of ESG into different portfolios
due to a lack of available ESG ETFs and inconsistencies in ESG scores.
CONTENTS
1. INTRODUCTION ... 1 2. ROBO ADVISING ... 4 2.1 Industry overview ... 4 2.2 Investment Methodology... 5 3. ESG INVESTING ... 6 3.1 ESG Performance ... 6 3.2 ESG Integration ... 7 3.3 ESG ETFs ... 83.3.1 Characteristics of ESG ETFs ...8
3.3.2 Performance of ESG ETFs ...9
4. METHODOLOGY ... 10
4.1 Research approach ... 10
4.2 Data description ... 12
4.3 Data analysis procedure ... 14
5. RESULTS ... 16
5.1 Performance ... 16
5.1.1 Performance backtest ... 16
5.1.2 Transaction Costs ... 18
5.2 ESG scores ... 20
5.3 Integrability into different portfolios ... 22
6. DISCUSSION ... 24
REFERENCES... 27
1. INTRODUCTION
The Financial Services Industry is in constant change. Changes are led by technological progress
and by clients’ demands. Combining investment theory and computer science, a new industry has
emerged, satisfying clients’ demands that have not been satisfied by traditional wealth managers
yet. It is the access to low-cost and transparent wealth management through so-called robo advisors.
Robo advisors leverage on passive asset management, particularly ETFs, to construct globally
diversified portfolios and automatically manage them over time with algorithm-driven risk
management systems. This approach proved to be highly cost-efficient and is expected to attract
more than 145 million users by 2023 (Statista, 2018). Additionally driven by new regulations and
demographical changes, their market share is growing rapidly with many potentials lying ahead.
New robo advising models appear that have different degrees of sophistication or are combinations
of active and passive asset management. Robo advisors are profoundly rethinking business models
and expanding into different areas within the financial services industry. One area into which a few
robo advisors are trying to expand, is investing in accordance with Environmental, Social and
Governance (ESG) criteria.
The goal of ESG investing is to have a positive impact on society while at the same time achieving
competitive long-term financial returns (US SIF, 2018a). Its increasing popularity among investors
is evidenced by the growth of assets whose managers apply ESG criteria in their investment
analysis. In the U.S., these assets have increased by 44 percent only since 2016, totalling USD 11.6
trillion, accounting for 26 percent of all professionally managed assets (US SIF, 2018b). Especially
women and millennials show interest in sustainable investing, promising further increasing demand
The expansion of robo advisors into ESG investing can only made possible through the use of ESG
ETFs, an investment vehicle that replicates indexes with superior ESG rankings. Until now, ESG
ETFs are a niche product, managing about USD 7 billion assets in the U.S. (US SIF, 2018c).
However, the importance of ESG ETFs is unambiguous as they connect the passive management
of assets through ETFs with ESG investing. The ETF itself is considered as one of the most
successful innovations in finance of the last 15 years, experiencing USD 2.6 trillion inflows over
this time period (Bloomberg Intelligence, 2018a). Robo advisors find themselves in the position
where they can potentially construct and manage portfolios out of ESG ETFs. By doing this, they
could combine two distinct trends in financial markets: passive asset management and ESG
investing.
However, industry experts claim that an integration of ESG investing into robo advising is not
possible because the ESG ETF market is not mature enough. It is claimed that there are not enough
ESG ETFs to build fully diversified portfolios and that the characteristics of ESG ETFs conflict
with the investment methodology of robo advisors (see Schultz, 2017; Beioley, 2018). At the same
time, a few robo advisors already launched portfolios taking ESG criteria into account. This
paradox within the robo advising industry on the one hand and the potential high demand for ESG
portfolios managed by robo advisors on the other hand are the motivation for the research question:
Is ESG investing integrable into robo advising?
The subject of ESG investing has been studied extensively. Robo Advising has been studied to a
low extent. Prior research mainly focused on the performance of ESG strategies (see Friede et al,
2015) and on the investment model of robo advisors (see Bjerknes and Vuković, 2017). However,
no prior research combined these two subjects. Therefore, it can be concluded that there is a gap in
To answer the research question, the ESG portfolio of an existing robo advisor is analyzed and
compared to the Non-ESG counterpart offered by the same robo advisor. The ESG integration is
seen as successful if the ESG portfolio does not perform significantly worse and has higher ESG
scores than its counterpart. The analysis is conducted at the example of Liqid, a German robo
advisor. For the performance backtest, a threshold-based rebalancing strategy was performed to
simulate an automated trading strategy. The ESG scores were collected from three different rating
agencies for each company within an ETF and then aggregated to find a single score for each ETF.
Additionally, it was explored whether ESG can be integrated into other robo advisors’ portfolios.
More specifically, it was tested whether an ESG portfolio can be constructed to substitute the
current portfolio of Scalable Capital, Germany’s largest robo advisor.
The key findings are the following. First, the backtest over a seven-year and five-months long time
period finds that the ESG portfolio does not perform worse than its Non-ESG counterpart. Second,
the ESG scores are consistently higher for the ESG portfolio. Third, Scalable Capital’s portfolio
cannot be substituted with an ESG counterpart. The example of Liqid shows that ESG is integrable
into robo advising, with limitations. However, the integrability into different portfolios is limited
due to a lack of available ESG ETFs and inconsistencies in ESG scores.
This research will have six main sections. The first section was an introduction to the topic and a
summary of the research question, methodology, and key findings. Section 2 and 3 will provide
insights into the robo advising industry and the theoretical background of this research. Section 4
will describe the thesis methodology and the data set. The results will be presented in section 5 and
are divided according to the tested criteria: Performance, ESG scores and integrability into different
2. ROBO ADVISING
2.1 Industry overview
This section provides a snapshot of the robo advising industry and shows to which extent the
dominating robo advisors in the USA and in Germany integrated ESG. Section 2.2 describes the
investment methodology of robo advisors with special attention to the investment vehicle selection.
Robo advising is an innovation with the potential to significantly transform the way financial
advisory firms manage portfolios and communicate with clients. In short, robo advisors utilize
technology to offer advisory and portfolio management services with a minimum of human
intervention (Kaya, 2017). In practice, clients first go through a fully automated onboarding process
in which their risk preference is determined. Second, their money is invested in a globally
diversified portfolio constructed out of ETFs and third, their portfolio is automatically managed
over time by algorithm-driven, rule-based strategies.
With the first robo advisor founded in 2008, the industry still bears enormous growth potential. The
Assets under Management (AuM), which amount to USD 397,972 million worldwide in 2018, are
expected to show an annual growth rate (CAGR 2018-2022) of 38.2%. The number of users is
expected to amount to 145 million in 2023. In 2018, the average AuM per user amounts to USD
15,438 million. In a global comparison, the USA has the largest robo advising industry with USD
283,255 million in 2018, followed by China, United Kingdom and Germany (Statista, 2018). The
stages of development differ between countries. The US robo advising market is in the most
advanced stage. The established firms Vanguard and Charles Schwab have overcome the
founded robo advisors in terms of AuM (Wong, 2018), whereas in the German market, the
In the USA, as well as in Germany, only a few robo advisors offer ESG portfolios and these
portfolios cannot be found at the two biggest robo advisors in each market. The third biggest robo
advisor in the USA, Betterment, offers an ESG portfolio. However, due to the difficulties of
integrating ESG, only the equity ETFs covering the U.S. and Emerging Markets are replaced with
ESG ETF substitutes (Betterment, 2018). In Germany, also the third biggest robo advisor, Liqid, is
offering an ESG portfolio. This portfolio is completely replaced with ESG substitutes and will be
analyzed further in this research.
2.2 Investment Methodology
Even though robo advisors found an innovative way of managing their clients’ portfolios, their
investment methodology is, in its roots, based on established theories. Bjerknes and Vuković (2017)
examined several of the biggest robo advisors in the USA and find that their investment approaches
rely on Modern Portfolio Theory. Robo advisors apply Modern Portfolio Theory to construct
globally diversified, optimal portfolios. Each client invests in these portfolios according to his
assessed risk tolerance. Then, the portfolio is monitored and rebalanced over time.
An important characteristic that differentiates robo advisors from traditional wealth management
is the choice of investment vehicles. By choosing ETFs as investment vehicles, robo advisors
construct the optimal portfolios without actively selecting single securities (Jung et al, 2018). ETFs
are diversified, inexpensive and can be traded within all open market hours. With these features,
they are most suitable for automated trading strategies. 96% of all robo advisors use ETFs as their
main investment instruments. Among these, 55% exclusively invest in ETFs (Kaya, 2017).
With a growing number of available ETFs, the ETF selection process became an important part of
process of robo advisors. In the first stage, they exclude ETFs that conflict with their general
investment philosophy e.g. leveraged ETFs. In the next steps, ETFs with a short performance
history, insufficient market liquidity or poor performance are excluded. Only 3-6% of all available
ETFs are selected for the final set (Kaya, 2017). The market liquidity is of special importance since
low liquidity increases the trading costs in the form of higher bid-ask spreads. Robo advisors do
not only execute trades according to their investment strategy but also when the client transfers
money in and out or changes his risk category. In order to provide the client with the flexibility to
make these changes at low costs, robo advisors must minimize the costs related to bid-ask spreads.
After choosing the optimal portfolios, robo advisors provide ongoing portfolio management. Most
common among robo advisors is a rebalancing strategy based on thresholds in order to control the
overall portfolio risk (Kaya, 2017). Kaissar (2017) shows that rebalancing is an effective method
to increase a portfolio’s risk-adjusted return. Over the timeline from 1926 to 2016 regularly
rebalanced portfolios had higher Sharpe Ratios than never-rebalanced portfolios.
3. ESG INVESTING
3.1 ESG Performance
The relationship between financial performance and ESG has been subject to research and
discussion since the 1970s (ESG and financial performance). According to the neoclassical view,
the firm’s engaging in Corporate Social Responsibility enhancing activities cannot result in a
positive impact on financial performance (Friedman, 1970). The neoclassical view found empirical
evidence (see Aupperle et al, 1985) and still has an impact on the mindset of today’s institutional
Also in more recent research, the impact of ESG has been studied extensively. The results are
diverse with many researchers having not significant or ambiguous outcomes (see Kreander and
Sinclair, 2005; Revelli and Viviani, 2015). Friede et al. (2015) conducted an aggregated research
on more than 2000 empirical studies of ESG and financial performance. They claim that the results
of studies of mutual fund performance are overlaid by management fees and implementation costs.
By dividing the empirical studies into mutual fund and non-mutual fund studies, they reveal that
the large majority of studies, particularly company-focused studies, support the evidence for a
positive ESG relation. In conclusion, the combined academic and empirical research suggests that
ESG can increase risk-adjusted returns in the long-term (Eccles and Kastrapeli, 2018).
3.2 ESG Integration
The definition of ESG investing is vague. Most of today’s asset managers have a policy on ESG
issues. However, a written ESG policy is not a reliable indicator of the firm’s commitment to
integrating ESG into its financial analysis and investment decisions (Cappucci, 2017).
Eccles and Kastrapeli (2018) use the definition of “Full ESG Integration”, which is “Investing with
a systematic and explicit inclusion of ESG risks and opportunities in investment analysis”. The
advantage of this definition is that it is used by several recent surveys (Cappucci, 2017). Among
these, a survey by Amel-Zadeh and Serafeim (2017) finds that 60% of asset managers believe that
full ESG integration has a positive impact on performance relative to a market benchmark.
Even though more than half of asset managers believe in the benefits of fully integrating ESG,
actual practices show that most of them do not achieve this state of full ESG integration. In fact,
most managers are in a state where the level of ESG integration leads to a negative impact on
investment performance and ESG intensity has the form of a J-Curve. When starting to integrate
ESG, investment performance first decreases due to the immediate realization of implementation
costs. But with a rising level of ESG intensity, financial performance improves due to more
consistent screening processes. Cappucci (2017) claims that most managers are at the point of the
J-Curve where ESG integration decreases financial performance.
The reason for managers not being able to capture the full potential of ESG investing is the
difficulty of integrating it. Despite the definition of ESG investing being vague, ESG is difficult to
measure. When MSCI introduced its ESG quality scores for mutual funds and ETFs in 2016, the
results approximately followed a normal distribution. 66% of equity funds and 51% of bond funds
were rated with the MSCI ESG research median scores (MSCI, 2016). This makes it difficult to
distinguish between funds with high and low ESG scores.
3.3 ESG ETFs
3.3.1 Characteristics of ESG ETFs
In the previous chapter, it was described that the majority of asset managers fails to reach a high
level of ESG integration. ESG ETFs present the potential to integrate ESG criteria into one's
investment strategy without actively selecting stocks.
However, ESG ETFs have characteristics that conflict with the investment methodology of robo
advisors. Among broad-based ESG ETFs, the two ETFs with the longest track record are the
iShares MSCI KLD 400 Social ETF and the iShares MSCI USA ESG Select ETF. They both track
the U.S. market and have the most AuM in this category. At the example of these two ETFs, one
can learn about the characteristics of ESG ETFs. As described in chapter 2.2, robo advisors choose
conditions. But ESG ETFs typically have fewer constituents, higher expense ratios and higher
bid-ask spreads than Non-ESG ETFs. The two iShares ESG ETFs have 413 and 125 holdings, total
expense ratios of 25 Basis Points (bps) each and average bid-ask spreads of 25 bps and 27 bps over
the last three years (Nov 2015 to Oct 2018). In comparison, the largest Non-ESG ETF tracking the
S&P 500, the SPDR S&P 500 ETF, has 505 constituents, a total expense ratio of 9.5 bps and
bid-ask spreads that are less than 1 bp on average. (Bloomberg, 2018; Bloomberg Intelligence, 2018b).
3.3.2 Performance of ESG ETFs
As described in chapter 3.1, the relationship between ESG and performance has been studied
extensively at the example of mutual funds and individual companies. But only recent research
tried to fill the gap of measuring the performance of ESG ETFs (see Mitikka, 2017). The reason
for this is the short performance history of available ESG ETFs. Among broad-based ESG ETFs,
only the two iShare ETFs described in the previous chapter have a track record that allows for a
performance assessment. Both of them launched more than ten years ago. But the vast majority of
ESG ETFs was launched from 2016 on, having a track record of fewer than three years (Bloomberg
Intelligence, 2018b).
Mitikka (2017) uses an alternative methodology to allow for the measurement of ESG ETFs’
performances over a longer time period. According to the author’s methodology, an ETF is
determined as sustainable in two possible ways: Either the ETF is officially committed to an ESG
strategy or the ETF has a relatively high sustainability rating, measured by the Morningstar
Sustainability Rating. This method results in a performance evaluation over a five-year sample
period. The author concludes that the performances are controversial and vary across regions. In
finding is controversial. On the one hand, it is consistent with prior research finding that ESG
investing can function as a risk management component (see Lins et al, 2017). On the other hand,
ESG ETFs have fewer constituents than their Non-ESG counterparts and are therefore less
diversified, as described in the previous chapter. Furthermore, recent research confirms the finding
that ESG integration has a different impact depending on the region. Sherwood and Pollard (2017)
conclude that ESG strategies significantly outperform in Emerging Markets.
4. METHODOLOGY
4.1 Research approach
In this section, the thesis methodology is presented. Section 4.1 links the theoretical framework to
the methodology part by presenting and discussing the research approach. Section 4.2 describes the
data and section 4.3 describes in detail how the data were analyzed.
As based on the industry insights and theoretical framework, the growing importance of robo
advising, passive asset management and ESG investing is unambiguous. The ESG ETF is an
investment vehicle that robo advisors can potentially use to provide ESG investing for their clients.
Robo advisors follow a concrete investment methodology and ESG ETFs have specific
characteristics that might prevent a successful integration into robo advisors’ portfolios. Industry
experts claim that a successful integration is not possible yet due to the immaturity of the ESG ETF
market, while at the same time a few robo advisors already launched ESG portfolios. This
background forms the foundation for the research question of this thesis: Is ESG investing
integrable into robo advising?
To answer the research question, a mixed-method approach is applied. The ESG portfolio of an
robo advisor. The ESG integration is seen as successful if the ESG portfolio does not perform
significantly worse and has higher ESG scores than its counterpart. For the sake of a more general
statement, it is additionally tested whether ESG can be integrated into other robo advisors’
portfolios.
The ESG portfolio of the German robo advisor, Liqid, was chosen to analyze in this study. The
reasons for this choice are that Liqid’s management of its ESG portfolio follows the definition of
robo advising most closely and that its portfolio is most representative for ESG investing. As
described in chapter 2.1, there are only a few robo advisors offering ESG portfolios. Among these,
some offer a combination of active and passive management or only replace selected ETFs with
ESG substitutes. It is to be acknowledged that also Liqid's portfolio does not perfectly match the
objectives of this work, as will be described in the next section. The additional robo advisor, which
is tested for ESG integration, is Scalable Capital. This choice is justified by the fact that Scalable
Capital is the largest robo advisor in the same market, Germany, and therefore allows for a more
general conclusion.
The methodology of this work does not follow any previous research. This is because no previous
research with a similar objective was identified. An alternative research approach would be to
explore the universe of available ESG ETFs as a whole and test whether there are portfolios of ESG
ETFs that fit into the investment methodology of robo advisors. It was not decided for this approach
because the barriers of ESG integration are highly specific to each market. For example, the
4.2 Data description
The applied data in this research are the components of Liqid’s ESG and Non-ESG portfolio, the
data series used for the performance backtest and the ESG scores. Liqid launched its digital wealth
management business in September 2016 and is now the third biggest robo advisor in Germany
with approximately EUR 300 million AuM (= USD 339.51 million, as of 10/31/2018). The ESG
portfolio launched in June 2018. For a minimum investment of EUR 100,000, investors can choose
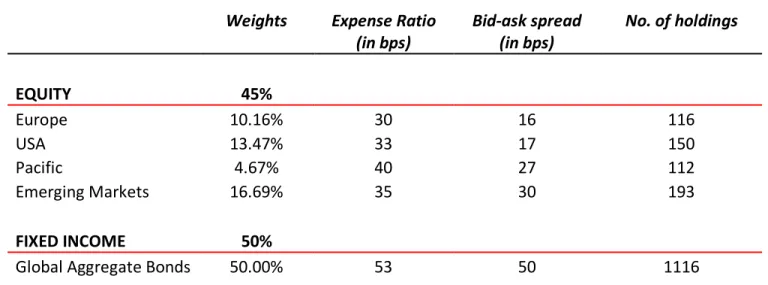
among ten risk categories, on a scale from 10 to 100 (Liqid, 2018). The two tables below show the
components of Liqid’s ESG and Non-ESG portfolio for an investor with the risk-category 50.
Additional characteristics of the ETFs are provided in the tables.
Table 1: Liqid’s ESG Portfolio
Weights Expense Ratio (in bps) Bid-ask spread (in bps) No. of holdings
EQUITY 45% Europe 10.16% 30 16 116 USA 13.47% 33 17 150 Pacific 4.67% 40 27 112 Emerging Markets 16.69% 35 30 193 FIXED INCOME 50%
Global Aggregate Bonds 50.00% 53 50 1116
Source: Liqid company website, Bloomberg. Data as of 10/31/2018. Bid-ask spreads are calculated as an average from 01/02/2018 to 10/31/2018.
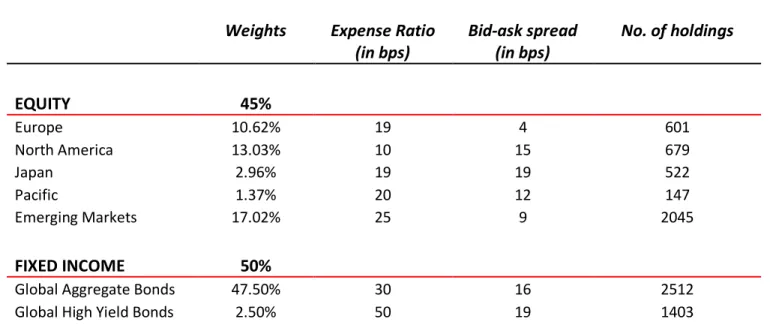
Table 2: Liqid’s Non-ESG Portfolio
Weights Expense Ratio (in bps) Bid-ask spread (in bps) No. of holdings
EQUITY 45% Europe 10.62% 19 4 601 North America 13.03% 10 15 679 Japan 2.96% 19 19 522 Pacific 1.37% 20 12 147 Emerging Markets 17.02% 25 9 2045 FIXED INCOME 50%
Global Aggregate Bonds 47.50% 30 16 2512
Global High Yield Bonds 2.50% 50 19 1403
Source: Liqid company website, Bloomberg. Data as of 10/31/2018. Bid-ask spreads are calculated as an average from 01/02/2018 to 10/31/2018.
The tables show that the ESG ETFs have higher expense ratios, higher bid-ask spreads and fewer
holdings. The ETFs in the ESG portfolio have a weighted average expense ratio of 42 bps and
bid-ask spreads of 35 bps, compared to 24 bps and 13 bps in the Non-ESG portfolio. In the ESG
portfolio, there are 6222 fewer holdings than in its counterpart. For simplicity, commodities, which
make up 5% in each portfolio, were excluded. Their weight was added to cash to avoid negative
cash during trading in the performance backtest.
The Global Aggregate Bonds in Liqid's ESG portfolio are tracked by an actively managed fund
offered by Robecosam, rather than an ETF. Robecosam was founded in 1995 and is an investment
specialist focused exclusively on sustainability investing (Robecosam, 2018). This is why Liqid’s
portfolio does not perfectly match the objectives of this research, as mentioned in the previous
chapter. A bid-ask spread of 50 bps was used for this fund, which is equal to the fund’s entry
The ETFs’ bid-ask spreads were collected from the trading platform Xetra as an average between
01/02/2018 to 10/31/2018. This timeline was chosen according to data availability. More than 90%
of all trading in shares at all German exchanges and about 30 percent of trading in ETFs in Europe
is transacted through Xetra (Xetra, 2018). Therefore, it was assumed that Liqid executes its trades
through Xetra as well.
For the performance backtest, the returns of the ETFs’ benchmark indexes were collected, due to
the longer performance history. The daily returns were collected between 05/31/2011 and
10/31/2018 from Bloomberg. In Appendix 1 and 2, tables with the ETF and index names are
provided. The ESG scores were collected for each company held by each ETF in the portfolio. The
company-level rankings are provided by Robecosam, Sustainalytics and Bloomberg and were
downloaded from Bloomberg as of 10/31/2018.
4.3 Data analysis procedure
The data analysis was divided into three steps, according to the criteria that were tested:
Performance, ESG scores and Integrability into different portfolios.
The performance backtest was conducted using the computer language Python. To simulate an
automated trading strategy, a threshold-based rebalancing strategy was performed. Expense ratios
and bid-ask spreads, as shown in Table 1 and 2, were deducted accordingly from the index returns
to approximate the realistic performance of the ETFs. The impact of slippage, i.e. the impact of
Liqid’s trading on the ETF price, was neglected due to the small size of Liqid’s portfolios compared
to the ETFs’ trading volumes.
In a first step, a backtest with the threshold of 5% was performed because 5% is regarded as a
compare the risk-adjusted returns of the two portfolios, the portfolio returns were regressed on the
daily Fama/French Global 3 Factors (Fama and French, 2018). Bid-ask spreads were excluded for
these two regressions. The Fama/French Factors are constructed out of equity portfolios and can
therefore not adjust for the risk of fixed-income securities. As can be seen in Appendix 1 and 2, the
benchmark index of the fixed-income fund in the ESG portfolio is the Barclays Multiverse Index.
This index is an aggregate of the two indexes used in the Non-ESG portfolio: the Barclays Global
Aggregate Index and Barclays Global High-Yield Index. Therefore, it is argued that the risk
exposure of the underlying fixed-income securities of the two portfolios is similar. Despite other
common risk-measures, the one-year Value at Risk (VaR) was projected using Monte-Carlo
Simulations. The VaR is used by several robo advisors, e.g. Scalable Capital, because it is
supportive in quantifying the risk-categories for clients. Instead of measuring risk as a deviation
from an expected value, the VaR only quantifies the downside risk.
In a second step, it was measured how transaction costs can impact performance. As described in
chapter 3.3.1, the high bid-ask spreads of ESG ETFs conflict with the methodology of robo advisors.
Two additional backtests with the thresholds 1% and 3% were performed to measure the effect of
bid-ask spreads.
To obtain one ESG score from each rating agency for each ETF, the company-level ratings were
aggregated. For each ETF and for each rating agency, the weighted average of these company-level
ratings was computed, weighted by the AuM of each company within the ETF. The ESG score
analysis was limited to the equity ETFs due to data availability.
To test whether an integration into different portfolios is possible, it was explored whether an ESG
portfolio can be constructed to substitute the current portfolio of Scalable Capital. For the ETFs in
computed and compared according to the same procedure described in the last paragraph. Because
it was assumed that also Scalable Capital executes its trades through Xetra, the condition was that
the ESG substitutes are available on Xetra as well.
5. RESULTS
This chapter presents the results of this research. Chapter 5.1 presents the results of the backtest
performed on Liqid’s ESG and Non-ESG portfolio. Next, in chapter 5.2, the ESG scores of the two
portfolios are compared. Lastly, in chapter 5.3, the flexibility to integrate ESG into other robo
advisors’ portfolios is analyzed.
5.1 Performance
5.1.1 Performance backtest
In this section, the backtest results are presented and the performance of the ESG and Non-ESG
portfolios compared. In chapter 5.1.2, a closer examination of the transaction costs and how they
can reduce performance is presented.
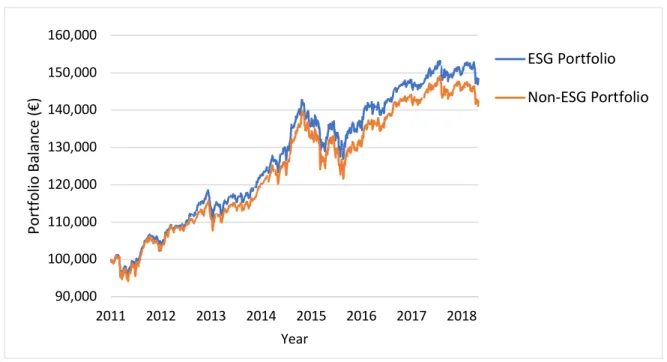
The backtest with a 5% threshold-based rebalancing strategy shows that the ESG portfolio
outperformed the Non-ESG portfolio in terms of cumulative return and in all other selected risk
measures over the five-year and five-months long bull market. The cumulative performances of a
EUR 100,000 investment are graphed in Figure 1. Table 3 depicts the final balance at the end of
the investment period for each of the portfolios and also includes selected performance measures,
such as the annualized return, annualized standard deviation, annualized sharpe ratio, the maximum
Figure 1: The growth of the ESG and Non-ESG portfolio between March 2011 and October 2018
Table 3: Selected performance measures for the ESG and Non-ESG portfolio between March 2011 and October 2018
Portfolio Final
Balance Return Standard Deviation Sharp Ratio Maximum Drawdown One- year 5% Value at Risk
ESG 148,528 6.54% 5.60% 0.99 -11.13% 7.55%
Non-ESG 142,639 5.75% 5.85% 0.81 -12.95% 8.74%
Notes: The return, standard deviation and sharpe ratio are annualized figures. The Sharpe Ratio was calculated with a risk-free rate of 1%.
Table 3 shows that an investment in the ESG portfolio would have resulted in a higher final balance.
The ESG portfolio has a lower standard deviation, a lower maximum drawdown, a higher sharpe
ratio and a higher projected one-year 5% VaR than the Non-ESG portfolio. For the calculation of
the 5% VaR, the mean and standard deviation of the portfolios’ returns over the observation period
function as the measure of central tendency and dispersion. The results imply that with a probability 90,000 100,000 110,000 120,000 130,000 140,000 150,000 160,000 2011 2012 2013 2014 2015 2016 2017 2018 Po rt fo lio Ba la nce (€) Year ESG Portfolio Non-ESG Portfolio
of 95% a loss of 7.55% and 8.74% will not be exceeded for the ESG and Non-ESG portfolio,
respectively.
The results suggest an outperformance of the ESG portfolio. However, when adjusting for the
equity risk, the ESG portfolio does not have a significantly higher risk-adjusted return than the
Non-ESG portfolio. Regressing the returns of each portfolio with the daily Fama/French Global 3
Factors shows that none of the portfolios has statistically significant higher returns than the global
market on a 95% confidence level. The regression outputshows positive but insignificant intercepts
with 0.0008% and 0.00004% on a yearly basis for the ESG and Non-ESG portfolio, respectively.
The fama-french factors Mkt-RF, SmB, and HML are all statistically significant (p=0) and are very
similar for the ESG and Non-ESG portfolio. The R-squared implies that 77.9% and 78.5% of the
ESG and normal portfolio’s daily returns are explained by the three factors.
As portrayed in Table 1 and 2, the ESG ETFs have higher expense ratios and fewer holdings than
the Non-ESG ETFs. Though, the ESG portfolio does not significantly over- or underperform its
counterpart on a risk-adjusted basis. This is consistent with the literature. While the combined
literature suggests that ESG can increase risk-adjusted returns, this relationship is less clear for
ESG ETFs, as described in chapter 3.3.2. Also consistent with previous research is that the
outperformance of the ESG portfolio varies across regions and outperforms in Emerging Markets.
When comparing the stand-alone performance of the indexes, a yearly excess return of 3.54% was
achieved by the ESG Emerging Markets index, with expense ratios subtracted.
5.1.2 Transaction Costs
This section examines how the amount of paid bid-ask spreads differs between the ESG and
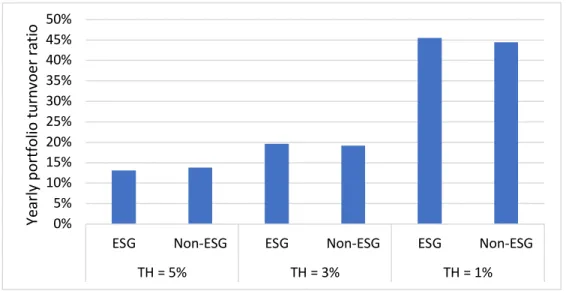
Two additional backtests were performed with the thresholds 1% and 3%, ceteris paribus. Figure 2
illustrates the yearly portfolio turnover ratio depending on the threshold. The yearly portfolio
turnover ratio is defined as the amount of assets purchased and sold on average per year divided by
the average amount of assets in the portfolio.
Figure 2. Yearly portfolio turnover ratio dependent on the rebalancing threshold
The table shows that with a threshold of 5%, the algorithm purchases and sells between 13% and
14% of the assets held in the portfolio per year. With the threshold decreasing, the turnover ratio
over-proportionally increases. There is no systematical difference between the ESG and Non-ESG
portfolio.
The higher the turnover ratio, the higher are the transaction costs paid. Table 1 and 2 provide the
bid-ask spreads for each ETF. It is expected that half of the bid-ask spread has to be paid for each
purchase or sell. Accordingly, the average bid-ask spread that has to be paid for trading an ETF in
the ESG portfolio is 18 bps and in the Non-ESG portfolio 6 bps. Measured as a percentage of the
initial investment, the bid-ask spreads for rebalancing the ESG and Non-ESG portfolio amount to
2.37 bps and 0.83 bps for a threshold of 5% and 8.18 bps and 2.67 bps for a threshold of 1%. 0% 5% 10% 15% 20% 25% 30% 35% 40% 45% 50%
ESG Non-ESG ESG Non-ESG ESG Non-ESG
TH = 5% TH = 3% TH = 1% Ye arl y portfol io turnvoe r rati o
The results show that the paid transaction costs are always lower than 10 bps of the initial
investment per year and do not significantly reduce performance. However, it has to be noted that
the turnover ratio can increase depending on the changes the client makes with his portfolio. As
explained in chapter 2.2, it is always in the interest of the robo advisor to choose ETFs with low
bid-ask spreads in order to enable the client to make these changes at low costs. Thus, the three
times higher bid-ask spreads for the ESG portfolio represent a conflict with the investment
methodology of robo advisors.
Concluding chapter 5.1, the performance criteria is fulfilled. Even though ESG ETFs have higher
expense ratios and fewer holdings, the ESG portfolio does not perform worse than its Non-ESG
counterpart on a risk-adjusted basis. The bid-ask spreads are higher for the ESG ETFs. However,
the resulting difference in transaction costs is not high enough to significantly reduce the relative
performance of the ESG portfolio, even if lower rebalancing thresholds are applied.
5.2 ESG scores
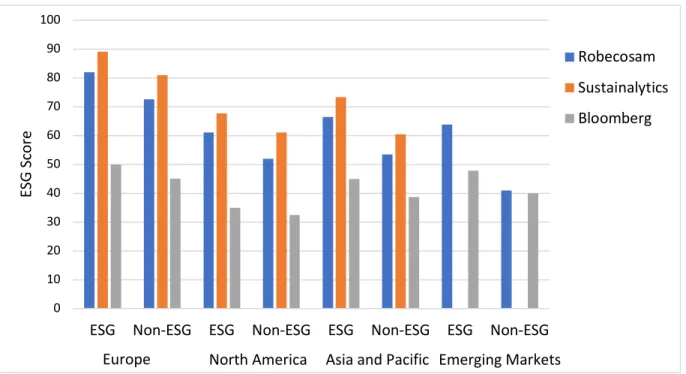
The ESG portfolio outperforms its Non-ESG counterpart in terms of the ESG score. Figure 3
demonstrates the weighted average ESG scores for each equity ETF, depending on the rating
Figure 3: ETF ESG Scores depending on rating agency and region.
The ESG scores of each ETF are different depending on which rating agency’s company-level
ratings were applied. The table also shows that the ESG scores are consistent. The following pattern
holds true: An ESG ETF that has a higher ESG score according to one rating agency also has a
higher ESG score according to the other two rating agencies. For Emerging Markets, the
Sustainalytics ratings are not available.
On average, the ESG ETFs have a score of 61.4, compared to 51.5 for the Non-ESG counterparts.
Within the ESG ETFs, the number of companies covered by the rating agencies is 81.90%,
compared to 69.95% for the Non-ESG ETFs. The difference in coverage is smaller when computing
how much of the AuM within an ETF are covered, which is on average 83.97% and 81.17% for the
ESG and Non-ESG portfolio, respectively.
As described in chapter 3.2, the ESG scores for funds tend to follow a normal distribution, what
makes it difficult to distinguish between high and low scored funds. On a company-level, this
0 10 20 30 40 50 60 70 80 90 100
ESG Non-ESG ESG Non-ESG ESG Non-ESG ESG Non-ESG
ES G S core Europe Robecosam Sustainalytics Bloomberg
difficulty only exists for the ratings provided by Bloomberg, with 41% of the companies being
within the ratings 40 and 60 for the Non-ESG portfolio. Accordingly, the Bloomberg rating also
shows the lowest improvement of the total ESG score, which is 5.4 points, compared to the average
improvement of 9.9 points.
The Emerging Markets ESG ETF does not only outperform its Non-ESG counterpart in terms of
returns, as described in chapter 5.1.1, but also achieves the highest improvement in terms of ESG
score. Its excess ESG score is 15 points. The Non-ESG Emerging Markets ETF has the highest
percentage of companies within the ratings 0-20. According to the Robecosam ratings, the
percentage of companies within these ratings can be reduced from 46.1% to 18.9% when changing
to the ESG ETF. These results show that the negative screening method, i.e. the exclusion of
companies with low ESG scores, achieved a large improvement for the Emerging Markets ETF.
The distributions of the company ratings in the Emerging Markets ETFs are provided in Appendix
3 and 4.
In conclusion, the ESG scores as well as the percentage of companies covered by the rating agencies
are higher for the equity ESG ETFs. Importantly, the improvement in the ESG score is consistent
for every rating agency and every ETF. The criteria for having higher ESG scores is fulfilled.
5.3 Integrability into different portfolios
Based on the results of chapter 5.1 and 5.2, ESG is integrable into Liqid’s portfolio. The equity
side of Liqid's Non-ESG portfolio can be substituted with ESG ETFs that do not perform worse
and have higher ESG scores than its counterparts. This section analyzes whether ESG can be
it is tested whether an ESG portfolio can be constructed to substitute the current portfolio of
Scalable Capital.
Out of 17 ETFs in Scalable Capital’s portfolio, only seven were identified that can be substituted
with ESG ETFs. Among these seven ETFs, five are equity ETFs and two are corporate bond ETFs.
Four of the five equity ETFs were substituted with ESG ETFs out of Liqid’s portfolio. The two
ESG corporate bond ETFs were the only substitutes available on Xetra. No substitutes were
identified for the ETFs covering equity small cap, real estate, government bonds, secured bonds,
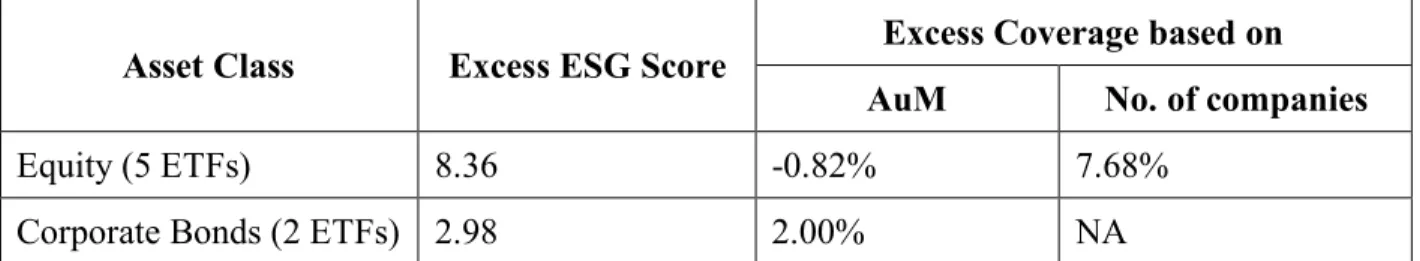
and commodities. Table 4 shows the results of the ESG score comparison.
Table 4: ESG score comparison of Scalable Capital’s ETFs and ESG substitutes
Asset Class Excess ESG Score Excess Coverage based on
AuM No. of companies
Equity (5 ETFs) 8.36 -0.82% 7.68%
Corporate Bonds (2 ETFs) 2.98 2.00% NA
Notes: For corporate bonds, the Morningstar Sustainability Rank was used.
The table shows the average excess ESG score and excess coverage of the ESG substitutes over
their Non-ESG counterparts. In summary, the substitution leads to higher ESG scores on average.
But the improvement is relatively low, compared to the 9.9 points difference between Liqid’s ESG
and Non-ESG equity ETFs. Moreover, the ESG scores and the coverage ratios are not consistent.
Three of the five equity ESG ETFs have a lower score than its Non-ESG counterparts according to
the Bloomberg rating.
In conclusion, the criteria of integrability into different portfolios is not fulfilled. The results show
side, the availability of ESG substitutes is very limited. This explains why Liqid uses an actively
managed fund to create the fixed-income exposure. But also for the other asset classes, except for
equity, no substitutes were identified. Even if the identified ETFs were substituted, the increased
ESG impact would be limited due to the relatively low improvement in the ESG score and the
inconsistency in the ratings.
6. DISCUSSION
This research examined whether ESG investing is integrable into robo advising on the example of
a German robo advisor. The result is that ESG is integrable, with limitations. But the lack of
available ESG ETFs and the inconsistencies in ESG scores still prevent the replacement of more
complex portfolios with ESG substitutes. Two of the three tested criteria are fulfilled.
First, Liqid’s ESG portfolio does not perform worse than its Non-ESG counterpart. After adjusting
for the equity risk in both portfolios, no significant over- or underperformance was identified.
Industry experts claim that ESG ETFs have characteristics that conflict with the investment
methodology of robo advisors (higher expense ratios, less diversification, and higher bid-ask
spreads). The backtest proved that these characteristics do not result in a significantly worse relative
performance and are therefore not an argument against the integrability of ESG investing. Besides,
it is expected that ESG portfolios with a minor relative underperformance still find investors.
Białkowski and Starks (2016) prove that ESG investors are less sensitive to negative performance.
Investing according to ESG criteria has additional value for investors.
Second, the ESG scores are consistently higher for Liqid’s ESG portfolio. But the improvement of
the average ESG score from 51.5 to 61.4 on a scale from 1 to 100 is less than expected. The ESG
scores could not be collected for the fixed-income securities and only at one point in time, rather
than continuously over time. However, more crucial for the results of this study is the credibility
of ESG scores. Instead of actively choosing companies that promise a higher ESG impact, robo
advisors invest in ESG ETFs that select and weight companies based on their ESG scores. Thus,
only if one can rely on the correct measurement of ESG scores, robo advisors can integrate ESG
investing. But due to missing reporting standards for companies and inconsistencies in the
methodologies among rating agencies, much skepticism remains on the credibility of ESG scores
(see Doyle, 2018; Flood, 2018). Future research can examine further how ESG measurements can
become more consistent and not oversimplistic at the same time.
Third, the integrability into other portfolios is limited due to the lack of available ESG ETFs and
inconsistencies in ESG scores. The claim of industry experts that there are not enough ESG ETFs
to construct fully diversified portfolios proved to be true. On the example of Scalable Capital, this
research finds that there are not enough ESG ETFs, except for the asset classes equity and corporate
bonds. Liqid overcame this problem by constructing an ESG portfolio that is subject to two
limitations. First, the portfolio is not diversified over other asset classes except for equity and bonds.
Second, an actively managed mutual fund was used to create the bond exposure. With these
limitations, ESG is integrable into robo advising. This explains why there are conflicting opinions
within the robo advising industry. Robo advisors like Scalable Capital cannot replace their
portfolios with ESG substitutes and therefore do not see the integrability of ESG investing. Other
robo advisors, like Liqid, make the integration possible by constructing portfolios that bear
significant limitations.
This research was conducted at the example of a German robo advisor. The results are dependent
same two portfolios of ETFs at the same costs. A recommendation for future work is to analyze the
integrability of ESG in other geographical markets.
The contribution of this research is the clarity that ESG investing will be integrated further into
robo advising in the future. It was proven that already at this stage, the characteristics of ESG ETFs
do allow an integration into automated trading strategies. The limitations that prevail for
constructing more complex ESG portfolios are due to the immaturity of the ESG ETF market. But
particularly since 2016, the market is advancing at fast pace, with new ESG ETFs emerging that
have different underlying methodologies and lower expense ratios. Given the high demand for ESG
investing and passive asset management, it is only a question of time until more robo advisors offer
REFERENCES
Amel-Zadeh, Amir, and George Serafeim. 2017. "Why and How Investors Use ESG
Information: Evidence from a Global Survey." Harvard Business School Working Paper 17-079.
Aupperle, Kenneth E., Archie B. Carroll and John D. Hatfield. 1985. "An Empirical Examination of the Relationship Between Corporate Social Responsibility and Profitability."
Academy of Management. Journal 28 (2): 446–463. doi:10.2307/256210.
Barnett, Michael L. and Robert M. Salomon. 2006. “Beyond Dichotomy: The Curvilinear Relationship Between Social.” Strategic Management Journal. Journal 27 (11): 1101- 1122. doi: 10.1002/smj.557.
Beioley, Kate. 2018. “Robo advisers short circuit over ethical investing.” Financial Times, September 2018. https://www.ft.com/content/1dabbce8-b5d8-11e8-b3ef-799c8613f4a1
Betterment. 2018. “Understanding our Socially Responsible Investing (SRI) Portfolio.”
Accessed November 2018. https://www.betterment.com/resources/socially-responsible-investing-portfolio/
Bloomberg. 2018. Bloomberg Professional. Available at: Subscription Service. Accessed 30 October 2018.
Bloomberg Intelligence. 2018a. “U.S. ETFs Outlook.” Retrieved from Bloomberg Intelligence ETF Research Database.
Bloomberg Intelligence. 2018b. “Broad ESG ETFs generate hype, yet performance trails benchmarks.” Accessed November 2018. https://www.bloomberg.com/professional/blog/broad-esg-etfs-generate-hype-yet-performance-trails-benchmarks/
Bjerknes, Line, and Vuković, Ana. 2017. “Automated Advice: A Portfolio Management Perspective on Robo-Advisors.” Master’s Thesis. Trondheim: Norwegian University of Science and Technology. Retrieved from https://brage.bibsys.no
Cappucci, Michael. 2017. “The ESG Integration Paradox”. Harvard Management Company Working Paper June 8, 2017.
Doyle, Timothy. 2018. “The Big Problem With 'Environmental, Social And Governance' Investment Ratings? They're Subjective.” Investor’s Business Daily, August 2018.
https://www.investors.com/politics/commentary/the-big-problem-with-environmental-social-and-governance-investment-ratings-theyre-subjective/
Eccles, Robert G. and Mirtha D. Kastrapeli. 2018. State Street Corporation Report. Retrieved from
http://www.statestreet.com/content/dam/statestreet/documents/Articles/The_Investing_Enlighten ment.pdf
Fama, Eugene F. and Kenneth R. French. 2018. “Fama/French Global 3 Factors Daily”. Retrieved from Fama and French Data Library
http://mba.tuck.dartmouth.edu/pages/faculty/ken.french/Data_Library/f-f_3developed.html
Flood, Chris. 2018. “Scepticism persists on ‘ETFs for good’.” Financial Times, May 2014.
https://www.ft.com/content/c3cbc64a-2b90-11e8-97ec-4bd3494d5f14
Friede, Gunnar, Timo Busch and Alexander Bassen. 2015. “ESG and financial performance: aggregated evidence from more than 2000 empirical studies.” Journal of Sustainable Finance &
Investment. Journal 5 (4): 210-233. doi:10.1080/20430795.2015.1118917.
Friedman, Milton. 1970. “The Social Responsibility of Business is to Increase its Profits.” The
New York Times Magazine, September 1970. http://umich.edu/~thecore/doc/Friedman.pdf
Jaconetti, Colleen M., Francis M. Kinniry and Yan Zilbering. 2010. “Best practices for portfolio rebalancing.” Vanguard Research. Retrieved from
https://www.vanguard.com/pdf/icrpr.pdf
Jung, Dominik, Verena Dorner, Florian Glaser, Stefan Morana. 2018. “Robo-Advisory. Digitalization and Automation of Financial Advisory.“ Springer Bus Inf Syst Eng. Journal 60 (1): 81–86. doi:10.1007/s12599-018-0521-9.
Kaissar, Nir. 2017. “The ups and downs of portfolio rebalancing.” Bloomberg Article. Retrieved from https://www.bloomberg.com/
Kaya, Orçun. 2017. “Robo-advice – a true innovation in asset management.” Deutsche Bank Industry Report. Retrieved from Deutsche Bank Research database.
Kreander, N. Gray R.H. Power D.M. and C.D. Sinclair. 2005. “Evaluating the Performance of Ethical and Non-ethical Funds: A Matched Pair Analysis.” Journal of Business Finance and
Accounting. Journal 32 (7-8): 1465-1493. doi: 10.1111/j.0306-686X.2005.00636.x.
Lins, Karl V., Henri Servaes and Ane Tamayo. 2017. “Social Capital, Trust, and Firm Performance: The Value of Corporate Social Responsibility during the Financial Crisis.” The
Journal of Finance. Journal 72 (4): 1785-1824. doi: 10.1111/jofi.12505
Liqid. 2018. Liqid company website. Accessed October 2018. https://www.liqid.de/de
Mitikka, Elina. 2017. “Doing well by doing good? Performance of sustainable and socially responsible ETFs.” Master’s Thesis. Helsinki: Hanken School of Economics. Retrieved from
https://helda.helsinki.fi
MSCI. 2016. “MSCI introduces ESG Quality Scores for Mutual Funds, ETFs.” Accessed November 2018.
https://www.msci.com/www/blog-posts/msci-introduces-esg-quality/0308840040.
Revelli, Christophe, and Jean-Laurent Viviani. 2015. “Financial Performance of Socially Responsible Investing (SRI): What Have We Learned? A Meta-Analysis.” Business Ethics: A
European Review. Journal 24 (2): 158–185. doi:10.1111/beer.12076.
Robecosam. 2018. Robecosam company website. Accessed October 2018.
https://www.robecosam.com/
Scalable Capital. 2018. Scalable Capital company website. Accessed October 2018.
https://de.scalable.capital/anlageuniversum
Schultz, Abby. 2017. “The Problem With ESG ETFs, and the Opportunities.” Barron’s, October 2017.
https://www.barrons.com/articles/the-problem-with-esg-etfs-and-the-opportunities-1507349966
Sherwood W. Matthew and Julia L. Pollard. 2017. “The risk-adjusted return potential of integrating ESG strategies into emerging market equities.” Journal of Sustainable Finance &
Statista. 2018. “Statista Digital Market Outlook - Robo Advisors: September 2018”. Retrieved from https://www.statista.com.
US SIF. 2018a. “SRI Basics: What is sustainable, responsible and impact investing?” Accessed December 2018. https://www.ussif.org/sribasics
US SIF. 2018b. “US SIF Trends Report: Sustainable and Impact Investing – Overview.” Retrieved from https://www.ussif.org/fastfacts
US SIF. 2018c. “US SIF Trends Report: Sustainable and Impact Investing – Money Managers 2018.” Retrieved from https://www.ussif.org/fastfacts
U.S. Trust Survey. 2018. “2018 U.S. Trust Insights on Wealth and Worth.” Retrieved from
https://newsroom.bankofamerica.com
Wong, Michael M. 2018. “Financial Services – Robo-Advisor Upgrade! Installing a Program for Profitability: Digital Advice Raises Profits for Investment Services Industry." Morningstar
Research Report. Retrieved from https://www.morningstar.com/lp/robo-advisor-upgrade
APPENDIX
Appendix 1 – Liqid's ESG Portfolio: ETFs and Benchmark Indexes used for the Performance Backtest
ETF Benchmark Index
EQUITY
iShares MSCI Europe SRI UCITS MSCI Euope SRI TR Net UBS ETF (LU) MSCI USA Socially Responsible UCITS MSCI USA SRI TR Net UBS ETF (LU) MSCI Pacific Socially Responsible UCITS MSCI Pacific SRI TR Net
iShares MSCI EM SRI UCITS MSCI EM SRI TR Net
FIXED INCOME
Robeco Global Total Return Bond Fund Barclays Multiverse TR Source: Liqid company website, Bloomberg.
Appendix 2 – Liqid's Non-ESG Portfolio: ETFs and Benchmark Indexes for the Performance Backtest
ETF Benchmark Index
EQUITY
iShares STOXX Europe 600 UCITS MSCI Europe TR Net
Vanguard FTSE North America UCITS MSCI North America TR Net
Vanguard FTSE Japan UCITS MSCI Japan TR Net
iShares Core MSCI Pacific ex-Japan UCITS MSCI Pacific Ex JapanTR Net iShares Core MSCI EM IMI UCITS MSCI Emerging Markets TR Net
FIXED INCOME
iShares Global Aggregate Bond UCITS Barclays Global-Aggregate TR iShares Global High Yield Corporate Bond UCITS Barclays Global High Yield TR Source: Liqid company website, Bloomberg.
Appendix 3 - Distribution of company-level ratings in the Emerging Markets ESG ETF
Source: Bloomberg. Total Number of companies in the ETF: 193. Not all companies are covered by the rating agencies.
Appendix 4 - Distribution of company-level ratings in the Emerging Markets Non-ESG ETF
Source: Bloomberg. Total Number of companies in the ETF: 2045. Not all companies are covered by the rating agencies. 0 5 10 15 20 25 30 35 40 45 0-10 10-20 20-30 30-40 40-50 50-60 60-80 80-90 90-100 Fr eque nc y (no . o f c om pa ni es) ESG Score Robecosam Bloomberg 0 50 100 150 200 250 300 350 0-10 10-20 20-30 30-40 40-50 50-60 60-70 70-80 80-90 90-100 Fr eque nc y (no . o f c om pa ni es) ESG Score Robecosam Bloomberg