DOI: 10.1002/jso.24759
RESEARCH ARTICLE
Performance of prognostic scores and staging systems in
predicting long-term survival outcomes after surgery for
intrahepatic cholangiocarcinoma
Stefan Buettner
1,2|
Boris Galjart
2|
Jeroen L. A. van Vugt MD
2|
Fabio Bagante MD
1|
Sorin Alexandrescu MD
3|
Hugo P. Marques MD
4|
Jorge Lamelas MD
4|
Luca Aldrighetti MD
5|
T. Clark Gamblin MD
6|
Shishir K. Maithel MD
7|
Carlo Pulitano MD
8|
Georgios A. Margonis MD, PhD
1|
Matthew Weiss MD
1|
Todd W. Bauer MD
9|
Feng Shen MD
10|
George A. Poultsides MD
11|
J. Wallis Marsh MD
12|
Jan N. M. IJzermans MD
2|
Bas Groot Koerkamp MD, PhD
2|
Timothy M. Pawlik MD, MPH, PhD
1,131Department of Surgery, Johns Hopkins Hospital, Baltimore, Maryland 2Department of Surgery, Erasmus MC University Medical Center, Rotterdam, The Netherlands
3Fundeni Clinical Institute, Bucharest, Romania
4Curry Cabral Hospital, Lisbon, Portugal 5Ospedale San Raffaele, Milan, Italy 6Medical College of Wisconsin, Milwaukee, Wisconsin
7Emory University, Atlanta, Georgia 8University of Sydney, Sydney, Australia 9University of Virginia, Charlottesville, Virginia
10Eastern Hepatobiliary Surgery Hospital, Shanghai, China
11Stanford University, Stanford, California 12University of Pittsburgh Medical Center, Pittsburgh, Pennsylvania
13The Ohio State University Wexner Medical Center, Columbus, Ohio
Correspondence
Timothy M. Pawlik, MD, MPH, PhD, FACS, Professor and Chair, Department of Surgery, The Urban Meyer III and Shelley Meyer Chair for Cancer Research, The Ohio State University Wexner Medical Center, 395 W. 12th Avenue, Suite 670, Columbus, OH 43210.
Email: tim.pawlik@osumc.edu
Introduction: We sought to validate the commonly used prognostic models and staging
systems for intrahepatic cholangiocarcinoma (ICC) in a large multi-center patient
cohort.
Methods: The overall (OS) and disease free survival (DFS) prognostic discriminatory
ability of various commonly used models were assessed in a large retrospective cohort.
Harrell
’s concordance index (c-index) was used to determine accuracy of model
prediction.
Results: Among 1054 ICC patients, median OS was 37.7 months and 1-, 3-, and 5-year
survival, were 78.8%, 51.5%, and 39.3%, respectively. Recurrence of disease occurred
in 454 (43.0%) patients with a median DFS of 29.6 months. One-, 3-, and 5- year DFS
were 64.6%, 46.5%, and 44.4%, respectively. The prognostic models associated with
the best OS prediction were the Wang nomogram (c-index 0.668) and the Nathan
staging system (c-index 0.639). No model was proficient in predicting DFS. Only the
Wang nomogram exceeded a c-index of 0.6 for DFS (c-index 0.602). The c-index for the
AJCC staging system was 0.637 for OS and 0.582 for DFS.
Conclusions: While the Wang nomogram had the best discriminatory ability relative to
OS and DFS, no ICC staging system or nomogram demonstrated excellent prognostic
discrimination. The AJCC staging for ICC performed reasonably, although its overall
discrimination was only modest-to-good.
K E Y W O R D S
intrahepatic cholangiocarcinoma, prognostic staging, recurrence, risk factors, survival
Bas Groot Koerkamp and Timothy M. Pawlik contributed equally to this work.
1
|I N T R O D U C T I O N
Intrahepatic cholangiocarcinoma (ICC) occurs in approximately 1-2 per 100 000 persons, making it the second most common primary hepatic malignancy.1–3 Although ICC mostly develops as a well-differentiated carcinoma, only a minority (15%) of patients presents with resectable disease at the time of diagnosis.4Complete surgical
resection remains the only option for cure. The estimated median survival after resection of ICC ranges from 27 to 36 months.5–9 Postoperative survival estimates for individual patients can have consequences with regards to surveillance strategies and decisions about adjuvant chemotherapy.10
The most common staging for ICC is the TNM system in the American Joint Committee on Cancer (AJCC) staging manual.11
While the AJCC staging system is widely adopted, TNM categoriza-tion can be limited in providing individual patient-specific prognosis among patients with biliary cancers. As such, several groups have proposed new prognostic models and nomograms.12,13In addition,
some groups including the Liver Cancer Study Group of Japan (LCSGJ),14 the Society of Hepatobiliary Surgery Japan (SHPBSJ),15
Okabayashi et al,16and Nathan et al17have offered a wide range of different staging systems that have been proposed to discriminate overall survival (OS) better. External validation of these proposed prognostic staging schemes has been largely lacking, however. When developing a prediction model, there is an inherent risk of overestimating both its accuracy and generalizability. External validation of any staging proposal is therefore necessary in large, multicenter cohorts of patients. Since only a few prognostic ICC models have been tested in such cohorts, further evaluation of these models is important. As such, the objective of the current study was to define the predictive ability of the available proposed prognostic models for patients with resected ICC in a large cohort of patients from multiple international high-volume centers.
2
|M E T H O D S
All patients undergoing resection for ICC between January 1, 1990 and July 1, 2016 at one of 12 participating major hepatobiliary institutions in the United States, Asia, Oceania, and Europe were identified (Johns Hopkins University, Baltimore, Maryland; Emory University, Atlanta, Georgia; Stanford University Medical Center, Stanford, California; University of Virginia Health System, Charlottesville, Virginia; Fundeni Clinical Institute, Bucharest, Romania; Beaujon Hospital, Clichy, France; Curry Cabral Hospital, Lisbon, Portugal; Eastern Hepatobiliary Surgery Hospital, Shanghai, China; Ottowa General Hospital, Ottowa, Canada; Royal Prince Alfred Hospital, Sydney, Australia; San Raffaele Hospital, Milan, Italy; Erasmus MC University Medical Center, Rotterdam, the Netherlands). Patient records in each participating center were assessed retrospectively and entered into a central standardized registry for each institution.
Sociodemographic and clinicopathologic data were collected and included age, sex and race, tumor size, histologic grade, presence of
nodal metastases, final resection margin and the presence of vascular, and/or perineural invasion. A minor hepatectomy was defined as a hepatic resection of less than three Couinaud segments. Margin status was categorized as R0 for tumor negative resection margins, R1 for microscopically positive margins and R2 for macroscopically positive margins. Only patients undergoing surgery for histologically confirmed ICC were included in the study population; patients who did not undergo resection were excluded. Patients who underwent transplan-tation were also excluded. The respective institutional review boards of each participating institution approved this study.
2.1
|Included models
Seven frequently used postoperative nomograms and staging systems for resected ICC patients were selected for this study. The prognostic models included those proposed by Wang et al,18the AJCC TNM 7th
edition,11Hyder et al,13Liver Cancer Study Group of Japan (LCSGJ),14
the Society of Hepatobiliary Surgery Japan (SHPBSJ),15Okabayashi
et al,16and Nathan et al,17which are summarized in Table 1.
2.2
|Statistical analysis
Categorical variables were described as whole numbers and percen-tages while continuous variables were reported as medians with interquartile (IQR) range. Percentages for each variable were calculated based on available data, excluding missing values. Univariable comparison of categorical variables was performed using the Pearson chi-square test. Univariable comparison of continuous variables was performed using the Mann-Whitney U-test. In order to ascertain the validity of the results, additional multiple imputations for the Wang (51.8% missing) and Hyder (23.9% missing) nomograms were performed, as these models had a larger amount of missing data. Since c-indices cannot be pooled using Rubin’s rules, median and range values were provided.19
The primary outcome of the study was overall survival (OS). The secondary outcome was disease-free survival (DFS). OS was calculated as the time from the date of surgery to the date of death or date of last available follow-up, while DFS was calculated from the date of surgery to the date of first-known radiographically or pathologically confirmed metastasis. Both survival estimates were determined using the Kaplan-Meier method. The log-rank test was used to compare the strata of the prognostic models. Cox regression was performed to evaluate the effect of well-known prognostic variables in this particular cohort of patients. Each of the variables included in the models Schoenfeld residuals were plotted, in order to evaluate if the proportional hazards assumption was not violated. A sub-analysis among the patients who had a mass-forming ICC was conducted for the SHPBSJ and Okabayashi staging systems, because these staging systems were originally developed in cohorts of patients with mass-forming ICC.15,16
Model performance was assessed using Harrell’s concordance index (c-index). The c-index provides the probability that, in a randomly selected pair of patients, in which one patient dies before the other, the patient who died first had the worse predicted outcome from the
nomogram. Analyses were performed using SPSS 22.0 (IBM, New York) and R version 3.03 (http://www.r-project.org) with the rms package. All tests were two-sided and P < 0.05 defined statistical significance.
3
|R E S U L T S
3.1
|Cohort description
A total of 1054 patients who underwent resection for ICC and met the inclusion criteria were identified (Table 2). Median patient age was 59 years (IQR 51, 68) and the majority of patients were male (n = 568, 53.9%). Most patients had an ASA classification of II (n = 486, 52.0%) or III (n = 274, 29.3%). At the time of surgery, 6 out of 10 patients underwent a major hepatectomy involving more than three Couinaud segments (n = 60, 59.9%). Almost half of patients underwent a formal portal lymphadenectomy (n = 463, 45.1%). On final pathology, the majority of patients had an R0 resection (n = 882, 86.4%). Morphologi-cally, most patients had a mass-forming ICC (n = 892; 92.1%), while a minority had a papillary (n = 31; 3.2%) or periductal infiltrating (n = 45; 4.5%) growth pattern. Lymph node metastases were noted in 17.5% of patients (n = 184).
For each prognostic model, patients were allocated into the different risk groups, based on disease characteristics (Tables 3 and 4). The number of missing values that resulted in patients being excluded from analysis was small in most prognostic models. Specifically, 99 (9.4%) patients were not included in the AJCC TNM staging, 33 (3.1%) in the LCSGJ staging, 42 (4.0%) in the SHPBS staging, 25 (2.4%) in the Okabayashi staging, and 91 (8.6%)
in the Nathan staging system. The nomograms by Wang (51.8% missing) and Hyder (23.9% missing) had a higher proportion of missing patients. In the Wang nomogram, the median points score was 40.1 (IQR 23.2, 63.6). One hundred twenty-seven patients (25.0%) were allocated in the group <23.4 points, 255 (50.1%) in the group 23.4-64.9, and 127 in the group >64.9. Of note, the main reason the Wang nomogram could not be determined for a subset of patients (n = 548), were missing values for both CEA and CA19-9.
In the AJCC 7th staging schema, the majority of patients were allocated into stages I and II (n = 692, 72.2%). In the LCSGJ staging system, almost 6 out of every 10 patients were allocated in stage II (n = 607, 59.3%), which was identical to the allocation using the SHPBSJ staging system. In the Okabayashi staging system, 61.8% of the patients had stage I disease and 299 (29.0%) had stage III disease, while only 94 patients were allocated into the other stages. In the staging by Nathan, 398 (41.2%) patients had stage I disease, 360 (37.2%) had stage II disease and 209 (21.6%) had stages III or IV disease. Patients had an average score of 12.9 (IQR 10.9-15.9) when using Hyder’s nomogram.
3.2
|Overall survival and disease free survival
After a median follow-up of 27 months, nearly half of patients were deceased (n = 521, 49.7%). Median OS was 37.7 months and 1-, 3-, and 5-year survival was 78.8%, 51.5%, and 39.3%, respectively. Recur-rence of disease occurred in 454 (43.1%) patients during follow-up. Median disease-free survival was 29.6 months and 1-, 3-, and 5-year DFS was 64.6%, 46.5%, and 44.4%, respectively.
TABLE 1 Summary of the included prognostic scores and staging systems
Component
Wang
nomogram AJCC 7th LCSGJ staging
Society of hepatobiliary
surgery Japan Okabayashi
Nathan staging Hyder nomogram CEA, preoperative 0-100μg/L – – – – – – CA 19-9, preoperative 0-1,000 U/mL – – – – – –
Vascular invasion Yes/No Yes/No Yes/No Yes/No Yes/No Yes/No No, microscopic,
macroscopic Lymph node
metastases
Yes/No Yes/No Yes/No Yes/No Yes/No Yes/No Yes/No,
insufficiently harvested Direct invasion/local
metastases
Yes/No Yes/No – – Yes/No –
Number of lesions 1, 2-3,≥4 Solitary, multiple Solitary, multiple Solitary, multiple Solitary, multiple Solitary, multiple Solitary, multiple Tumor diameter 0-22 cm – ≤2 cm, >2 cm ≤2 cm, >2 cm – 1-15 cm Periductal/serosal invasion
– Yes/No Yes/No – Yes/No –
Distant metastases – Yes/No Yes/No Yes/No Yes/No Yes/No –
Age – – – – – – 25-85 years
Components of the prognostic models of interest were evaluated separately for prognostic ability with regards to OS and DFS (Table 3). Except for age and cirrhosis, all variables were associated with OS. Of note, direct invasion of adjacent organs (HR: 2.76, 95%CI 2.11-3.60, P < 0.001) and distant metastases (HR: 2.64, 95%CI 1.67-4.19, P < 0.001) were the factors most strongly associated with OS. The continuous variable CA19-9 had the best c-index of 0.634. With regards to DFS, tumor diameter >2 cm was strongly associated with risk of disease recurrence (HR: 2.10, 95%CI 1.12-3.92). Plotted Schoenfeld residuals demonstrated that the proportional hazards assumption was not violated for any of the variables.
3.3
|Comparison of scoring systems
Data on the performance of the models regarding the OS prediction are presented in Table 4 and Fig. 1; the ability of the models to predict DFS is presented in Table 5 and Fig. 2. Although there was a decline in OS and DFS with each progressive stage in most models, the highest stage was not always associated with the worst survival. For example, in the higher stages of several models, no differences in OS and DFS were observed (Figs. 1 and 2). The Wang nomogram was the only prognostic model in which incremental, clear differences among the survival curves in the bottom quartile, interquartile range, and the upper quartile were identified for both OS and DFS.
The prognostic models providing the best prediction of OS at all time points were the Wang nomogram and the Nathan staging system. These prediction methods also yielded the highest c-statistics (0.668 and 0.639). No model exceeded a c-index of 0.7 for OS. The ability of the models to predict DFS is presented in Table 5 and Fig. 2. No model was proficient in predicting DFS. The only model to exceed a c-index of 0.6 for DFS, which indicates fair discrimination, was the nomogram by Wang et al. For both OS and DFS, the Hyder nomogram had the lowest predictive capacity. Both the SHPBSJ (OS c-index: 0.606, DFS c-index: 0.558) and the Okabayashi staging systems (OS c-index: 0.600, DFS c-index: 0.558) did not perform better within the mass-forming ICC sub-cohort. The imputed datasets for the Wang and Hyder nomograms did not show large differences compared with the complete case analysis. Specifically, the Wang nomogram had a c-index of 0.674 (0.670-0.680) for OS and 0.601 (0.597-0.604) for DFS, which was similar to the estimate in the complete-case analysis. For the Hyder nomogram, the c-index for OS was 0.614 (0.613-0.616) and the c-index for DFS was 0.542 (0.541-0.548).
TABLE 2 Baseline characteristics of the validation cohort (n = 1,054)
Variable n (%)/median (IQR)
Gender Male 568 (53.9) Female 485 (46.1) Age, years 59 (51-68) Race Caucasian 626 (61.6) African-American 39 (3.8) Asian 329 (32.4) Other 22 (2.2) ASA I 104 (11.1) II 486 (52.0) III 274 (29.3) IV 71 (7.6) BMI 25.4 (22.6-28.2) Period of treatment 1990-2000 35 (3.4) 2001-2005 115 (11.1) 2006-2010 422 (40.8) 2011-2016 463 (44.7) Type of resection
Minor hepatectomy (<3 segments) 419 (40.9)
Right hepatectomy 167 (16.3)
Left hepatectomy 193 (18.8)
Extended right hepatectomy 128 (12.5)
Extended left hepatectomy 96 (9.4)
Central hepatectomy 21 (2.1) Number of tumors 1 (1-1) Morphologic type Mass-forming 892 (92.1) Papillary 31 (3.2) Periductal infiltrating 45 (4.6) Tumor size (cm) 6.1 (4.3-9.0)
Major vascular invasion 100 (9.7)
Microvascular invasion 257 (25.6)
Perineural invasion 152 (16.4)
Invasion of adjacent organs 77 (7.5)
Satellite lesions 233 (22.6)
Intrahepatic metastases 75 (7.3)
Lymphadenectomy 463 (45.1)
Lymph nodes harvested 2 (0-5)
Lymph node metastases 184 (17.5)
Extrahepatic metastases 40 (3.8)
Margin status
(Continues)
TABLE 2 (Continued)
Variable n (%)/median (IQR)
R0 882 (86.4)
R1 134 (13.1)
4
|D I S C U S S I O N
Prognostic models are frequently used in order to determine prognosis and predict adverse outcomes in malignant HPB surgery.18,20–27 Because of the vast difference in characteristics among individual patients diagnosed with ICC, different approaches in adjuvant therapy, follow-up, and further surgical treatment can be tailored to individual patients with the help of these models.12,28–30
In this study, we examined the ability of established nomograms and staging systems to predict OS and DFS in one of the largest Western cohorts of ICC to date. We quantified the predictive ability of each nomogram using Harrell’s concordance index. Although the included prognostic models varied considerably, some variables were included in multiple models. Notably, vascular invasion, lymph node metastases, and number of lesions were included in all prognostic models. These risk factors had significant prognostic TABLE 3 Prognostic value of the individual components
Overall survival Disease free survival
Component Hazard ratio 95%CI P-value C-index Hazard ratio 95%CI P-value C-index
CEA, preoperative Continuous (µg/L) 1.00 1.00-1.00 0.003 0.570 1.00 1.00-1.00 0.001 0.514 CA 19-9, preoperative Continuous (U/mL) 1.00 1.00-1.00 <0.001 0.634 1.00 1.00-1.00 0.369 0.550 Vascular invasion No Ref. – – – Ref. – – – Yes 1.57 1.19-2.06 0.001 0.519 1.59 1.19-2.13 0.002 0.522 Microscopic 1.28 1.02-1.59 0.031 0.91 0.72-1.16 0.451 Macroscopic 1.64 1.24-2.17 <0.001 0.542 1.54 1.15-2.07 0.004 0.521
Lymph node metastases
No Ref. – – – Ref. – – –
Yes 2.48 2.02-3.05 <0.001 0.565 1.62 1.30-2.03 <0.001 0.539
Direct invasion/local metastases
No Ref. – – – Ref. – – –
Yes 2.76 2.11-3.60 <0.001 0.544 1.80 1.27-2.56 <0.001 0.515
Number of lesions
Single Ref. – – – Ref. – – –
Multiple 1.88 1.53-2.30 <0.001 0.551 1.58 1.26-1.97 <0.001 0.534 2-3 1.75 1.39-2.19 <0.001 1.46 1.14-1.89 0.003 ≥4 2.45 1.69-3.55 <0.001 0.552 2.13 1.38-3.27 <0.001 0.536 Tumor diameter Continuous (cm) 1.07 1.04-1.09 <0.001 0.577 1.06 1.03-1.09 <0.001 0.586 ≤2 cm Ref. – – – Ref. – – – >2 cm 2.17 1.22-3.85 0.008 0.513 2.10 1.12-3.92 0.021 0.512 Periductal/serosal invasion No Ref. – – – Ref. – – – Yes 2.42 2.01-2.91 <0.001 0.616 1.59 1.31-1.92 <0.001 0.566 Distant metastases No Ref. – – – Ref. – – – Yes 2.65 1.67-4.20 <0.001 0.514 1.48 0.81-2.69 0.200 0.505 Age Continuous (years) 1.00 1.00-1.01 0.384 0.519 0.98 0.97-0.99 <0.001 0.582 Cirrhosis No Ref. – – – Ref. – – – Yes 1.01 0.76-1.35 0.939 0.506 1.35 1.02-1.80 0.037 0.522
TABLE 4 Prediction of overall survival by the included prognostic scores and staging systems
1-Year 3-Year 5-Year
Staging/nomogram
#At risk start study (%) Hazard ratio 95%CI #At risk OS rate #At risk OS rate #At risk OS rate C-statistic (SE) Wang nomogram 0.668 (0.021)* Cont. 1.01 1.01-1.01 <23.4 129 (25.3) Ref. – 112 91.2 56 78.8 22 66.9 23.4-64.9 260 (51.1) 2.23 1.51-3.29 197 82.9 72 53.6 25 40.8 >64.9 120 (23.6) 4.87 3.22-7.36 68 67.0 13 28.8 3 13.1 AJCC 7th 0.637 (0.021) I 399 (41.6) Ref. – 328 87.6 165 67.2 76 56.4 II 293 (30.6) 2.10 1.69-2.62 193 78.1 71 42.7 27 27.5 III 63 (6.6) 2.50 1.72-3.63 29 62.3 13 44.1 3 18.5 IV A 161 (16.8) 3.24 2.53-4.15 81 63.4 20 23.9 10 15.4 IV B 42 (4.4) 3.65 2.40-5.54 17 63.3 6 24.1 1 0.1 LCSGJ 0.631 (0.012) I 29 (2.8) Ref. – 26 96.4 18 88.1 8 78.0 II 607 (59.3) 1.95 1.00-3.78 453 84.0 208 59.7 98 47.9 III 172 (16.8) 3.31 1.68-6.56 107 73.4 46 43.5 18 29.9 IV A 7 (0.7) 5.34 1.78-16.00 5 85.7 0 0.0 0 0.0 IV B 209 (20.4) 5.41 2.75-10.67 90 63.2 20 35.7 6 10.0 Society of hepatobiliary surgery Japan 0.611 (0.012) I 29 (2.9) Ref. – 27 96.4 18 88.1 8 78.0 II 607 (59.8) 1.94 1.00-3.78 453 84.0 208 59.7 98 47.9 III 172 (16.9) 3.31 1.67-6.55 107 73.4 46 43.5 18 29.9 IV A 155 (15.3) 5.28 2.66-10.48 73 65.0 14 24.3 3 8.1 IV B 52 (5.1) 5.59 2.65-11.80 19 62.1 5 17.3 3 13.8 Okabayashi 0.607 (0.012) I 638 (61.8) Ref. – 480 84.5 228 61.4 108 49.5 II 55 (5.3) 1.54 1.03-2.30 32 71.3 15 51.7 4 34.4 III A 130 (12.6) 1.85 1.45-2.37 83 75.0 33 38.5 14 26.8 III B 169 (16.4) 2.77 2.21-3.47 79 64.3 17 24.0 5 9.8 IV 40 (3.9) 3.58 2.24-5.72 11 56.3 3 17.0 1 11.4 Nathan staging 0.639 (0.013) I 398 (41.2) Ref. – 327 88.0 165 67.9 76 57.0 II 360 (37.2) 2.20 1.79-2.72 225 75.3 85 42.4 31 26.3 III 167 (17.3) 3.42 2.69-4.36 85 63.4 21 22.8 8 11.1 IV 42 (4.3) 4.64 2.90-7.43 11 53.6 3 16.2 1 10.8 Hyder nomogram 0.599 (0.017)* Cont. 1.09 1.06-1.12 <10.9 191 (23.8) Ref. – 156 86.4 72 68.0 29 59.8 (Continues)
value in our cohort as well. After evaluating model performance, we noted that no single model reached the threshold for good discrimination (ie, a c-index of 0.7) for both OS and DFS. The most often used AJCC TNM staging system performed reasonable
compare with the other prognostic models (OS c-index: 0.637, DFS c-index: 0.582). In line with previous studies,10,18the nomogram by
Wang et al performed the best in predicting OS (c-index 0.668) and DFS (c-index 0.607).
TABLE 4 (Continued)
1-Year 3-Year 5-Year
Staging/nomogram
#At risk start study (%) Hazard ratio 95%CI #At risk OS rate #At risk OS rate #At risk OS rate C-statistic (SE) 10.9-15.9 423 (52.6) 1.30 0.99-1.71 290 82.7 117 55.9 48 44.2 >15.9 190 (23.6) 2.41 1.79-3.25 100 68.5 33 36.8 10 24.5
*C-indices for nomograms were calculated using the continuous score.
FIGURE 1 Overall survival stratified by the different prognostic models. (A) Wang Nomogram Score, (B) AJCC 7th edition stage, (C) LCSGJ stage, (D) SHPBS stage, (E) Okabayashi stage, (F) Nathan stage, (G) Hyder nomogram score
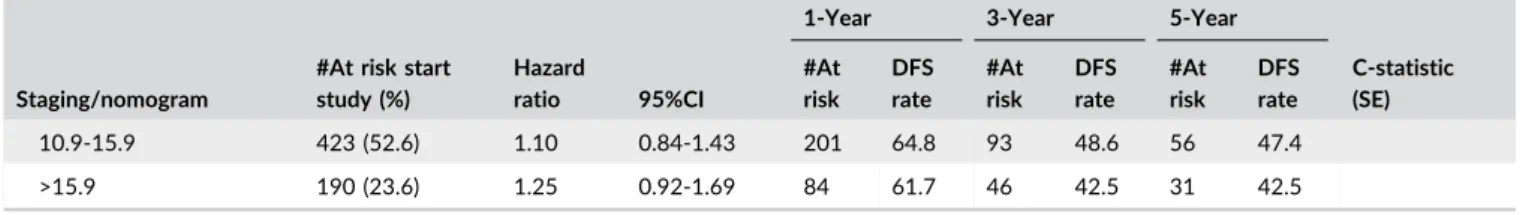
TABLE 5 Prediction of disease free survival by the included prognostic scores and staging systems
1-Year 3-Year 5-Year
Staging/nomogram
#At risk start study (%) Hazard ratio 95%CI #At risk DFS rate #At risk DFS rate #At risk DFS rate C-statistic (SE) Wang nomogram 0.607 (0.020)* Cont. 1.01 1.01-1.01 <23.4 129 (25.3) Ref. – 45 64.0 15 39.1 7 36.5 23.4-64.9 260 (51.1) 1.71 1.22-3.40 59 38.3 17 15.9 8 14.7 >64.9 120 (23.6) 2.59 1.77-3.80 23 31.4 5 10.0 4 10.0 AJCC 7th 0.582 (0.014) I 399 (41.6) Ref. – 225 69.3 97 51.0 52 48.4 II 293 (30.6) 1.50 1.20-1.88 122 58.8 49 38.6 22 33.8 III 63 (6.6) 1.18 0.73-1.89 20 66.5 9 49.4 6 42.3 IV A 161 (16.8) 1.83 1.42-2.37 54 50.2 21 28.6 15 28.6 IV B 42 (4.4) 2.88 1.83-4.54 9 48.2 1 6.4 1 6.4 LCSGJ 0.562 (0.012) I 29 (2.8) Ref. – 20 91.3 10 70.3 6 70.3 II 607 (59.3) 1.55 0.80-3.02 323 67.4 153 50.3 98 48.2 III 172 (16.8) 2.06 1.03-4.12 68 60.7 33 41.9 17 36.8 IV A 7 (0.7) 3.65 1.22-10.90 2 33.3 1 33.3 1 33.3 IV B 209 (20.4) 2.56 1.29-5.06 69 53.6 31 31.9 22 31.9 Society of hepatobiliary surgery Japan 0.563 (0.012) I 29 (2.9) Ref. – 20 91.3 10 70.3 6 70.3 II 607 (59.8) 1.55 0.80-3.02 323 67.4 155 50.6 98 48.2 III 172 (16.9) 2.06 1.03-4.12 68 60.7 33 41.9 17 36.8 IV A 155 (15.3) 2.51 1.26-5.00 58 54.4 25 32.9 17 32.9 IV B 52 (5.1) 3.19 1.47-6.92 Okabayashi 0.557 (0.012) I 638 (61.8) Ref. – 343 68.4 166 51.4 106 49.2 II 55 (5.3) 1.35 0.87-2.11 20 60.0 9 46.2 3 38.5 III A 130 (12.6) 1.34 1.02-1.78 54 60.9 27 40.7 15 36.7 III B 169 (16.4) 1.68 1.32-2.13 62 54.1 26 31.3 18 31.3 IV 40 (3.9) 1.70 0.93-3.11 7 50.3 5 35.9 4 35.9 Nathan staging 0.581 (0.013) I 398 (41.2) Ref. – 224 69.5 97 51.3 52 48.7 II 360 (37.2) 1.48 1.19-1.83 145 60.1 59 39.3 29 34.5 III 167 (17.3) 2.06 1.60-2.65 54 49.0 18 24.7 13 24.7 IV 42 (4.3) 1.47 0.80-2.70 9 56.0 6 42.7 5 42.7 Hyder nomogram 0.521 (0.016)* Cont. 1.03 1.00-1.06 <10.9 191 (23.8) Ref. – 105 65.8 41 53.9 20 50.4 (Continues)
ICC prognostic models have been developed in different populations for different purposes. While the AJCC staging includes all ICC patients, other models pertain only to patients who have undergone surgical resection. For example, the nomogram by Wang
et al was designed to predict individual OS after resection of ICC.18 Prognostic factors in this model included CEA, CA19-9, vascular invasion, presence of lymph node metastases, direct invasion and local metastases, number of tumors, and tumor diameter. A similar TABLE 5 (Continued)
1-Year 3-Year 5-Year
Staging/nomogram
#At risk start study (%) Hazard ratio 95%CI #At risk DFS rate #At risk DFS rate #At risk DFS rate C-statistic (SE) 10.9-15.9 423 (52.6) 1.10 0.84-1.43 201 64.8 93 48.6 56 47.4 >15.9 190 (23.6) 1.25 0.92-1.69 84 61.7 46 42.5 31 42.5
*C-indices for nomograms were calculated using the continuous score.
FIGURE 2 Disease free survival stratified by the different prognostic models. (A) Wang Nomogram Score, (B) AJCC 7th edition stage, (C) LCSGJ stage, (D) SHPBS stage, (E) Okabayashi stage, (F) Nathan stage, (G) Hyder nomogram score
nomogram was developed by Hyder et al. Risk factors for survival after resection in this model included age, number of tumors, tumor diameter, cirrhosis, lymph node metastases, and macrovascular invasion.13 A notable feature of the Hyder nomogram was that it
categorized patients who did not undergo a lymphadenectomy as Nx, instead of N0 like the other prognostic models. Other staging systems, such as those examined in the current study, were proposed as an alternative to the AJCC and included the Liver Cancer Study Group of Japan (LCSGJ),14 the Society of Hepatobiliary Surgery Japan
(SHPBSJ),15Okabayashi et al,16and Nathan et al staging systems.17
Similar to nomograms, these staging systems sought to better differentiate prognosis among patients and more individualized prognostication. One difference in the SHPBSJ and the Okabayashi staging systems versus the other staging systems was the inclusion of only patients with mass-forming ICC, the most common ICC morphology.15,16Although the prognostic models differed
consider-ably and used different cut-offs and units for the variables, the included factors included in the models had marked overlap. As stated before, vascular invasion, lymph node metastases and number of lesions were included in all prognostic models. These risk factors have been associated with worse prognosis in many previous studies.10On the other hand, age and cirrhosis were included only in the nomogram by Hyder et al.13Interestingly, tumor size was been removed from the
T-stage in the 7th edition of the AJCC staging system, but was included in four out of the seven prognostic models, indicating its importance in prognostication. To this point, tumor size has been re-introduced into the new, recently published 8th edition AJCC ICC staging system.
Due to the low incidence of ICC compared with other HPB malignancies, derivation studies for prognostic models often have lacked statistical power. Underpowered studies are at a risk of over-fitting the model to the data, causing decreased reproducibility. The current study is important because it externally evaluated current ICC models in a large and multicenter cohort. In particular, the data suggested that most prognostic models lacked the ability to identify patients with higher risk of recurrence or mortality, as demonstrated by the relatively low c-statistic associated with the different models. In previous studies by Doussot et al and Nathan et al similar poor results were demonstrated, although the sample size of the study cohorts were smaller than the current study.10,17Although multiple
well-known prognostic factors are used in the prognostic models, accurate estimation of their impact on survival remains elusive. The most commonly used prognostic factors were patient- and tumor-specific factors, with a limited number of factors such as number of tumors and vascular invasion. In addition, these factors were often analyzed in a binary fashion in many models, further limiting their predictive ability. It stands to reason that the potential prognostication of ICC, a complex biological process, based on a small number of binary predictors whose impact has only been measured in small cohorts, is limited.
In order to improve the predictive ability of current and new prognostic models, new determinants of biological processes in the form of biomarkers will be needed. Biomakers such as CEA and CA19-9 have previously been correlated with tumor processes and clinical out-comes.31,32 Only the Wang nomogram, however, utilized these
biomarkers in a prognostic model. The superior discriminating ability of
the Wang nomogram may relate to the importance of these biomarkers in prognostic models. In addition, a recent meta-analysis identified several other immunohistochemistry biomarkers associated with ICC.33To this
end, some investigators have proposed that a composite biomarker profile that combines clinical factors (CEA and CA19-9) with pathological biomarkers may improve the accuracy of prognostic models and guide treatment in patients with resected ICC.34The potential of this approach
has been proven with the recent successes of biomarker based prediction in breast cancer and colorectal cancer.35,36
Results of the current study should be interpreted in the context of several limitations. The inclusion of multiple centers did not allow for the standardization of operative approach or treatment-based protocols. The multi-center nature of the study does add to the generalizability, allowing the findings to be applied across a wide range of patient populations. Another limitation was the unavailability of preoperative values of CEA and CA19-9 in a number of patients. The lack of CEA and CA19-9 data were likely related to the varied clinical practice across centers, as well as the relatively recent identification of CEA and CA19-9 as important prognostic factors. These missing values were unlikely to change the conclusions of the study, as multiple imputation analysis led to the same results. Additionally, due to the small number of patients with a tumor morphology other than mass-forming ICC, we were unable to assess prognostic models for each morphology separately. Finally, not all patients underwent lymphadenectomy and therefore the“true” nodal status of these patients could not be determined. It is likely that a subset of these patients did indeed harbor occult nodal metastases.
In conclusion, while the Wang nomogram had the best discriminatory ability relative to OS and DFS, no staging system or nomogram demonstrated excellent prognostic discrimination. The most widely adopted AJCC staging for ICC performed reasonably compared with other prognostic models, although its overall discrimination was only modest-to-good. Further research into the optimization of ICC prognostic models, possibly with inclusion of specific biomarkers, is warranted.
C O N F L I C T O F I NT E R E S T
The authors have no conflicts of interest to declare.
RE F ER E N CE S
1. Shin HR, Oh JK, Masuyer E, et al. Comparison of incidence of intrahepatic and extrahepatic cholangiocarcinoma-focus on East and South-Eastern Asia. Asian Pac J Cancer Prev. 2010;11:1159–1166. 2. Singal AK, Vauthey JN, Grady JJ, Stroehlein JR. Intra-hepatic
cholangiocarcinoma-frequency and demographic patterns: thirty-year data from the M.D. Anderson Cancer Center. J Cancer Res Clin Oncol. 2011;137:1071–1078.
3. Everhart JE, Ruhl CE. Burden of digestive diseases in the United States Part III: liver, biliary tract, and pancreas. Gastroenterology. 2009;136:1134–1144.
4. Buettner S, van Vugt JL, Ijzermans JN, Groot Koerkamp B. Intrahepatic cholangiocarcinoma: current perspectives. Onco Targets Ther. 2017;2017:10:1131–1142.
5. Nakeeb A, Tran KQ, Black MJ, et al. Improved survival in resected biliary malignancies. Surgery. 2002;132:555–563; discission 563–554.
6. Konstantinidis IT, Koerkamp BG, Do RK, et al. Unresectable intra-hepatic cholangiocarcinoma: systemic plus intra-hepatic arterial infusion chemotherapy is associated with longer survival in comparison with systemic chemotherapy alone. Cancer 2016;122:758–765. 7. Endo I, Gonen M, Yopp AC, et al. Intrahepatic cholangiocarcinoma:
rising frequency, improved survival, and determinants of outcome after resection. Ann Surg. 2008;248:84–96.
8. de Jong MC, Nathan H, Sotiropoulos GC, et al. Intrahepatic cholangio-carcinoma: an international multi-institutional analysis of prognostic factors and lymph node assessment. J Clin Oncol. 2011;29:3140–3145. 9. Amini N, Ejaz A, Spolverato G, Kim Y, Herman JM, Pawlik TM. Temporal trends in liver-directed therapy of patients with intrahepatic cholangiocarcinoma in the United States: a population-based analysis. J Surg Oncol. 2014;110:163–170.
10. Doussot A, Groot-Koerkamp B, Wiggers JK, et al. Outcomes after resection of intrahepatic cholangiocarcinoma: external validation and comparison of prognostic models. J Am Coll Surg. 2015;221:452–461. 11. Edge SB, Byrd DR, Compton CC, Fritz AG, Greene FL, Trotti A. AJCC
Cancer Staging Manual. 7th ed. Chicago, IL: Springer; 2009. 12. Buettner S, van Vugt JL, Gani F, et al. A comparison of prognostic
schemes for perihilar cholangiocarcinoma. J Gastrointest Surg. 2016;20:1716–1724.
13. Hyder O, Marques H, Pulitano C, et al. A nomogram to predict long-term survival after resection for intrahepatic cholangiocarcinoma: an Eastern and Western experience. JAMA Surg. 2014;149:432–438. 14. Sakamoto Y, Kokudo N, Matsuyama Y, et al. Proposal of a new staging
system for intrahepatic cholangiocarcinoma: analysis of surgical patients from a nationwide survey of the Liver Cancer Study Group of Japan. Cancer. 2016;122:61–70.
15. Uenishi T, Ariizumi S, Aoki T, et al. Proposal of a new staging system for mass-forming intrahepatic cholangiocarcinoma: a multicenter analysis by the Study Group for Hepatic Surgery of the Japanese Society of Hepato-Biliary-Pancreatic Surgery. J Hepatobiliary Pancreat Sci. 2014;21:499–508. 16. Okabayashi T, Yamamoto J, Kosuge T, et al. A new staging system for mass-forming intrahepatic cholangiocarcinoma: analysis of preopera-tive and postoperapreopera-tive variables. Cancer. 2001;92:2374–2383. 17. Nathan H, Aloia TA, Vauthey JN, et al. A proposed staging system for
intrahepatic cholangiocarcinoma. Ann Surg Oncol. 2009;16:14–22. 18. Wang Y, Li J, Xia Y, et al. Prognostic nomogram for intrahepatic
cholangiocarcinoma after partial hepatectomy. J Clin Oncol. 2013;31:1188–1195.
19. Clark TG, Altman DG. Developing a prognostic model in the presence of missing data: an ovarian cancer case study. J Clin Epidemiol. 2003;56:28–37.
20. Gold JS, Gönen M, Gutiérrez A, et al. Development and validation of a prognostic nomogram for recurrence-free survival after complete surgical resection of localised primary gastrointestinal stromal tumour: a retrospective analysis. Lancet Oncol. 2009;10:1045–1052. 21. Groot Koerkamp B, Wiggers JK, Gonen M, et al. Survival after resection
of perihilar cholangiocarcinoma-development and external validation of a prognostic nomogram. Ann Oncol. 2015;26:1930–1935.
22. International Bladder Cancer, Nomogram C, Bochner BH, Kattan MW, Vora KC. Postoperative nomogram predicting risk of recurrence after radical cystectomy for bladder cancer. J Clin Oncol. 2006;24:3967–3972. 23. Karakiewicz PI, Briganti A, Chun FK, et al. Multi-institutional validation of a new renal cancer-specific survival nomogram. J Clin Oncol. 2007;25:1316–1322.
24. Song C, Kim K, Chie EK, et al. Nomogram prediction of survival and recurrence in patients with extrahepatic bile duct cancer undergoing curative resection followed by adjuvant chemoradiation therapy. Int J Radiat Oncol Biol Phys. 2013;87:499–504.
25. van der Gaag NA, Kloek JJ, de Bakker JK, et al. Survival analysis and prognostic nomogram for patients undergoing resection of extrahe-patic cholangiocarcinoma. Ann Oncol. 2012;23:2642–2649. 26. Wang SJ, Lemieux A, Kalpathy-Cramer J, et al. Nomogram for
predicting the benefit of adjuvant chemoradiotherapy for resected gallbladder cancer. J Clin Oncol. 2011;29:4627–4632.
27. Wierda WG, O’Brien S, Wang X, et al. Prognostic nomogram and index for overall survival in previously untreated patients with chronic lymphocytic leukemia. Blood. 2007;109:4679–4685.
28. Ferlay J, Shin HR, Bray F, Forman D, Mathers C, Parkin DM. Estimates of worldwide burden of cancer in 2008: GLOBOCAN 2008. Int J Cancer. 2010;127:2893–2917.
29. Leung TW, Tang AM, Zee B, et al. Construction of the Chinese University Prognostic Index for hepatocellular carcinoma and comparison with the TNM staging system, the Okuda staging system, and the Cancer of the Liver Italian Program staging system: a study based on 926 patients. Cancer. 2002;94:1760–1769.
30. Lepage C, Capocaccia R, Hackl M, et al. Survival in patients with primary liver cancer, gallbladder and extrahepatic biliary tract cancer and pancreatic cancer in Europe 1999-2007: Results of EUROCARE-5. Eur J Cancer. 2015. pii: S0959-8049(15)00714-5 [Epub ahead of print]. https://doi.org/10.1016/j.ejca.2015.07.034
31. Grobmyer SR, Wang L, Gonen M, et al. Perihepatic lymph node assessment in patients undergoing partial hepatectomy for malig-nancy. Ann Surg. 2006;244:260–264.
32. Choi SB, Kim KS, Choi JY, et al. The prognosis and survival outcome of intrahepatic cholangiocarcinoma following surgical resection: associ-ation of lymph node metastasis and lymph node dissection with survival. Ann Surg Oncol. 2009;16:3048–3056.
33. Ruys AT, Groot Koerkamp B, Wiggers JK, Klumpen HJ, ten Kate FJ, van Gulik TM. Prognostic biomarkers in patients with resected cholangio-carcinoma: a systematic review and meta-analysis. Ann Surg Oncol. 2014;21:487–500.
34. Bridgewater J, Galle PR, Khan SA, et al. Guidelines for the diagnosis and management of intrahepatic cholangiocarcinoma. J Hepatol. 2014;60:1268–1289.
35. Lech G, Slotwinski R, Slodkowski M, Krasnodebski IW. Colorectal cancer tumour markers and biomarkers: recent therapeutic advances. World J Gastroenterol. 2016;22:1745–1755.
36. Le Du F, Ueno NT, Gonzalez-Angulo AM. Breast cancer biomark-ers: utility in clinical practice. Curr Breast Cancer Rep. 2013;5: 284–292.
How to cite this article: Buettner S, Galjart B, van Vugt JLA, et al. Performance of prognostic scores and staging systems in predicting long-term survival outcomes after surgery for intrahepatic cholangiocarcinoma. J Surg Oncol.