The Impact of the Brexit Vote on
Financial Narratives
Evidence from UK
Maria Leonor Guedes Soares
Católica Porto Business School 2019
The Impact of the Brexit Vote on
Financial Narratives
Evidence from UK
Final Assignment in the modality of Dissertation presented to Universidade Católica Portuguesa
to obtain the degree of Master in Finance
by
Maria Leonor Guedes Soares
under the supervision of(PhD) Paulo Alexandre Pimenta Alves
Católica Porto Business School October 2019
Acknowledgments
I would like to thank my supervisor, Professor Paulo Alves, for the support and availability.
Resumo
Estudamos o impacto do referendo do Brexit em empresas transacionadas na London Stock Exchange (LSE) através da análise de mudanças de certas características das suas narrativas financeiras nomeadamente, o tom, a incerteza, o forward–looking e a causalidade. Usando vários modelos de regressão linear, realizamos uma análise das características referidas a diferentes secções do relatório de gestão (Management Discussion and Analysis – MD&A –, mensagem do Chairman e mensagem do CEO).
Enquanto o tom não é explicado pelo referendo, as palavras de incerteza, de forward-looking e de causalidade tornam-se mais frequentes após o voto.
Os resultados mostram que as empresas reagiram ao referendo do Brexit e alteraram o seu discurso em consequência do resultado do voto.
Palavras–chave: Referendo do Brexit, Natural Language Processing, tom, incerteza, forward–looking, causalidade, empresas financeiras e não financeiras.
Abstract
We study the impact of the Brexit referendum on firms listed on the London Stock Exchange (LSE) by analysing the changes in some characteristics of their financial narratives, namely, tone, uncertainty, forward–looking and causal language. Using a multivariate model, we analyse these features on different sections of the management report (e.g. Management Discussion and Analysis, Chairman message and CEO message).
While tone is not explained by the referendum, uncertainty, forward-looking and causal words become more frequent after the vote.
Our results confirm companies reacted to the Brexit referendum and change their discourse as a consequence of the vote outcome.
Keywords: Brexit referendum, Natural Language Processing, tone, uncertainty, forward–looking, causality, financial and non–financial firms.
Table of contents
Acknowledgments ... v
Resumo ... vii
Abstract ... ix
List of graphics ... xii
List of tables ... xiii
1. Introduction ... 1
2. Literature review ... 5
2.1. Automated content analysis... 5
2.2. Financial narratives ... 8
2.3. The Brexit referendum ... 11
2.3.1. The market reaction to the Brexit referendum ... 12
2.3.2. Consequences of Brexit ... 14
2.4. Research question: the effect of the Brexit vote on a firm’s discourse 16 3. Methodology ... 20 3.1. Sample selection ... 20 3.2. Research design... 20 4. Results ... 24 4.1. Tone ... 26 4.2. Uncertainty ... 31 4.3. Forward–looking ... 35 4.4. Causality ... 39 4.5. Further analysis ... 42 5. Conclusions ... 46 6. References ... 49 7. Appendix ... 55
List of graphics
Figure 1 – GBP and USD exchange rate around the Brexit vote ... 12 Figure 2 – GBP and EUR exchange rate around the Brexit vote ... 13 Figure 3 – Growth rate of the indexes around the Brexit vote ... 13
List of tables
Table 1 – Descriptive statistics ... 25
Table 2 – OLS coefficients estimates of tone ... 26
Table 3 – Non–financial firms: OLS coefficients estimates of tone ... 29
Table 4 – Financial firms: OLS coefficients estimates ... 30
Table 5 – OLS coefficients estimates of uncertainty ... 31
Table 6 – Non–financial firms: OLS coefficients estimates of uncertainty ... 33
Table 7 – Financial firms: OLS coefficients estimates of uncertainty ... 34
Table 8 – OLS coefficients estimates of forward–looking ... 35
Table 9 – Non–financial firms: OLS coefficients estimates of forward–looking ... 37
Table 10 – Financial firms: OLS coefficients estimates of forward–looking .. 38
Table 11 – OLS coefficients estimates of causality ... 39
Table 12 – Non–financial firms: OLS coefficients estimates of causality ... 41
Table 13 – Financial firms: OLS coefficients estimates of causality ... 42
Table 14 – Regression models that capture discourse inconsistencies ... 43
Table 15 – Discourse inconsistencies ... 45
Table 16 – Variables definition. ... 55
Table 17 – Descriptive statistics: non–financial firms ... 57
1. Introduction
Natural Language Processing (NLP) can be defined as a “discourse analysis technique” and refers to automated methods used to process information from text collections (Xing, Cambria and Welsch, 2017). Through its application, it is possible to extract discourse characteristics, such as sentiment (or tone), complexity and readability.
Research on Accounting and Finance suggests that firm sentiment can be a predictor for earnings and stock returns (Bannier, Pauls and Walter, 2017; Price et al, 2012) or a proxy for firm performance (Smith and Taffler, 2000), reflecting not only current performance, but also, expectations towards the future. However, tone has been shown to be used as a mechanism to manipulate investors’ perception of performance (Huang, Teoh and Zhang, 2011). In addition, it has been documented that firms with lower earnings increase complexity, making discourse harder to understand as an attempt to difficult the process of analysing information. Furthermore, profitable firms with persistent earnings have lower complexity (Li, 2008).
Hence, tone and complexity are correlated with firm performance and can be used to more accurately analyse a company’s financial condition. Note that, the association between performance and tone can be used to analyse if a firm is looking to inform the market or engaging in perception manipulation.
Sentiment based research can be applied to different corporate disclosure vehicles, from conference calls and earnings press releases to annual reports. In this thesis, we focus on the Chairman’s, the CEO’s and Management Discussion and Analysis (MD&A) sections of the annual report1. The study of these sections
1Alves et al. (2016) showed that different annual report sections carry different performance predictive
is complementary to the Financial Statements’ analysis (Karthik, Li and Yang, 2012), as investors are unable to fully analyse a company’s financial performance by looking only to quantitative information (Huang, Teoh and Zhang, 2011).
Interest on the information that firm sentiment captures is increasing, which is evident in the growing importance of the narratives’ sections both in terms of Accounting and Finance research (Clatworthy and Jones, 2003) but also in each firm’s annual report. Lewis and Young (2019) showed that the median report size – measured by the number of words – grew by 122%2, and the number of
topics in the median table of contents of UK reports, related to the narratives sections was 50% higher from 2003 to 2016, considering a sample of 19,426 annual reports (3,252 firms).
We use the dataset3 generated by the CFIE–FRSE4 software which classifies
annual report sections and extracts sentiment based on different lists of words developed for Accounting and Finance research. Using a sample of 6,821 annual reports (2,296 from financial firms and 4,525 from non–financial companies) from 2012 to 2017, we study the narratives tone – here defined as the number of positive words minus the negative ones, scaled by their sum –, but also, uncertainty, forward–looking and causality language. Positive and negative words are defined according to the list of words proposed by Loughran and McDonald (2011). Uncertainty is proxied with words that capture imprecision (Loughran and McDonald, 2011). Forward–looking words are the ones related with forecasts (Hussainey, Schleicher and Walker, 2003). Causal language is associated with words firms use to justify or explain something, such as performance or an event that affected it (Zhang and Aerts, 2015). Koonce, Seybert and Smith (2011) stated that causal language is a central dimension on financial
2This growth can be explained by the mandatory adoption of the IFRS in 2005 (Lewis and Young, 2019).
3 The dataset is available for download at
http://www.research.lancs.ac.uk/portal/en/datasets/uk-annual-report-narratives-dataset-cfiefrse-may-2019(4443e5bd-38c4-45bf-ae96-a7d947e529ce).html
and voluntary report. However, there is a major gap on research on uncertainty, forward–looking and causal language in Accounting and Finance. We plan to contribute to the literature by studying these sentiments around an event that may influence companies’ performance and, consequently, discourse. The Brexit referendum is an example of such event. We believe it will impact the discourse applied in each company’s financial narratives.
The Brexit referendum had a major impact for the economy of the United Kingdom as the market fail to anticipate the outcome of the vote. Results to leave the European Union (EU) won by 51.9%5. Studies show this result created
uncertainty (Bloom, 2019), it reduced companies’ abnormal returns (Oehler, Horn and Wendt, 2017; Ramiah et al, 2017) and is expected to reduce the UK’s long–term GDP growth rate (Dhingra et al, 2017; OECD, 2016; PwC, 2016). Having in account these effects and work on firm sentiment, we test whether firms’ discourse changes as a consequence of the vote. We expect tone to become more negative (to decrease) and uncertainty, forward–looking and causal words to be more recurrent in the annual reports published in 2016 and 2017.
Our results show the vote does not affect tone. Uncertainty, forward-looking and causal words, on the contrary, become more frequent, which means the financial narratives incorporated the uncertainty created by the Brexit referendum.
To the best of our knowledge, the effects of the Brexit referendum have not yet been quantified using computational linguistics. We add a different perspective to analyse the effects of the vote. Moreover, we contribute to Accounting and Finance literature by conducting an analysis across annual report sections and by studying different sentiments. Furthermore, we add to the work on automated content analysis, a study applied to a non–US country, the UK. Work on these
5 See https://www.electoralcommission.org.uk/whowe-are-and-what-we-do/elections-and-referendums/past-elections-and-referendums/eu-referendum/results-and-turnout-eu-referendum
matters shows there are many obstacles to the application of computational linguistics to non–US countries, mainly due to disclosure regulation.
The remainder of the thesis is organized as follows. Chapter 2 regards the literature review presenting a theoretical framework on financial narratives and the Brexit referendum. Chapter 3 is the methodology, where we describe the process of sample selection and variables included in the models. Chapter 4 presents and discusses the results. Chapter 5 concludes the thesis.
2. Literature review
As mentioned above we study the impact of the Brexit referendum through the application of computational linguistics. Therefore, we start the literature review by explaining the process used to extract tone from text collections and then, how it is applied to study the impact of the Brexit referendum.
2.1.
Automated content analysis
The use of automated content analysis for Accounting and Finance discourse or as stated by Loughran and McDonald (2016) “the notion of parsing text for patterns has a long history”.
Computational linguistics, automated content analysis or Natural Language Processing (NLP) are commonly used across disciplines as aliases and refer to similar textual analysis approaches (Loughran and McDonald, 2011 and 2016). These concepts are used to define the “idea of automatically analysing textual information” (Xing, Cambria and Welsch, 2018).
NLP is a subdiscipline of Artificial Intelligence (El–Haj et al, 2019b) and refers to methods such as, Naïve–Bayes classifications, term weighting and cosine similarity. Each one is a machine learning method. Their application is complex and hard to replicate across studies, which makes the process to validate their accuracy harder than the methods to be presented further – see Loughran and McDonald, 2011 and 2016; Xing, Cambria and Welsch, 2018; Lewis and Young, 2019 and El–Haj et al, 2019b for additional details.
On the other hand, there is word categorization, which is a dictionary–based approach and the most common method to extract tone in Accounting and Finance research (Loughran and McDonald, 2011). Bag of words – or word
categorization – is the method in which words are divided into several categories, according to the sentiment they capture. This method has the advantage to be easily replicated across papers however, in contrast to some machine–learning methods, it does not capture semantics, which means it ignores the sequence of words (El–Haj et al, 2019b).
There are four different lists of words commonly used for Accounting and Finance research: Henry (2008), Harvard’s GI (General Inquirer), Diction and Loughran and McDonald (2011) – also known as LM dictionary.
Loughran and McDonald (2011) developed a list of words to be applied to Accounting and Finance research, with positive, negative and uncertainty meaning, after showing that the Harvard IV–4 dictionary – a list of positive and negative words created for psychology and sociology – is not appropriate for Accounting and Finance discourse since it classifies common words (considering this kind of speech) such as “tax” and “liability” as negative. In addition, it does not include words with a positive sentiment (and commonly used in financial disclosures) such as “strong” and “record” (Henry, 2009). The authors also studied Diction dictionaries and found that the software’s word classification is not suitable for Accounting and Finance discourse. They applied word lists to manager’s writing in 10–K files and found the following, “83% of the Diction optimism and 70% of the Diction pessimism frequencies are misclassified, based on LM classifications” (Loughran and McDonald, 2015).
These methods can be applied to “corporate press releases; webpage content; analyst reports; (…) pressure groups and politicians; media commentary; and speeches by policymakers, regulators and politicians:” (Lewis and Young, 2019). In Accounting and Finance research, tone has been shown to be related with stock returns, trading volume and earnings. Sentiment and performance’s connection has been documented by applying automated content analysis methods to analyst reports (Huang, Zang and Zheng, 2014), social media (Kothari, Li and
Short, 2009) and corporate disclosures such as, earnings press releases (Henry, 2008; Huang, Teoh and Zhang, 2011; Price et al, 2012; Zhou, 2014) and annual reports (Li, 2008) or sections on it (Abrahamson and Amir, 1996; Li, 2010b; Lo, Ramos and Rogo, 2016; Smith and Taffler, 2000).
Bannier, Pauls and Walter (2017) studied the CEO’s speech at the Annual General Meeting from German firms between 2008 and 2016. They developed a list of German words based on the lists proposed by Loughran and McDonald (2011). Cumulative abnormal returns decreased with the decrease of the difference between positive and negative tone.
Kothari, Li and Short (2009) using word lists from GI, quantified the effects of favorable or unfavorable disclosures from MD&A, analyst reports and business press, on the cost of capital, return volatility and analyst dispersion from 1996 to 2001. Considering the aggregated sources, they found that favorable (unfavorable) disclosures are associated with a decreasing (increasing) cost of capital, stock return volatility and analyst forecast dispersion. For each source of disclosure individually, they showed that the MD&A only affects stock return volatility, by increasing it, if the tone is unfavorable. This result reflects some credibility issues regarding the managers speech. By reacting only to unfavorable disclosures, the market is recognizing and acknowledging the existence of management bias. Analyst report’s sentiment has no effects on cost of capital. The business press carries the same results as the combined sources.
Li (2010b) analysed forward–looking statements in the MD&A. She manually classified sentences as forward–looking and then applied Naïve–Bayes classifier to classify those sentences as positive, negative and neutral. She found that smaller firms with higher performance, lower accruals and less growth opportunities (high book–to–market ratio) have more positive forward–looking sentences.
In this thesis, the sentiments used to explain the impact of the Brexit referendum are extracted from the financial narratives of the companies who compose our sample.
2.2.
Financial narratives
Ingram and Frazier (1983) defined an annual report as “undisguised advertisement”. It allows “management to present a serial, annual description of corporate financial performance” – Clatworthy and Jones, 2012. There are two main parts, the Financial Statements (FS) and the narratives’ sections – hereafter mentioned as the narratives. The FS are composed by the balance sheet, the income statement, statement of changes of equity, the cash–flow statement and the explanatory notes. Their disclosure is mandatory by the IFRS6 and, in
contrast, to some parts of the narratives these ones are audited. Even though, they allow for corporate financial analysis, they are highly influenced by accounting standards and conventions, forecast errors and managers accounting choices (Palepu, Healy and Peek, 2013). The Chairman’s statement (also known as President’s Letter, Chairman’s Letter or Letter to Shareholders), the Management Commentary7 (also known as MD&A or Operating and Financial
Review), the Governance report, the remuneration review, the audit review and a residual commentary, on the other hand, are included in the narratives.
In contrast, in the US, following the SEC’s (Securities and Exchange Commission) terms, firms are required to submit a part of the annual report on HTML format, which constitutes the 10–K files. Here, there is a very standardized
6International Financial Reporting Standards (https://www.ifrs.org/)
7IFRS Practice Statement 1: Management Commentary. “(…) Should be consistent with the following
principles: Provide management’s view of entity’s performance, position and progress (including forward looking information)”. See https://www.ifrs.org/issued-standards/management-commentary-practice-statement/ for the complete definition of the Management Commentary.
It may include one or more sections such as the CEO’s review, a business review or strategic review (Alves et al, 2016).
format associated with a standard set of headings, that all public firms must follow, which “enables more straightforward selection of relevant sections for further analysis” (El–Haj, Rayson, Alves and Young, 2018). In addition, the SEC’s EDGAR system, allows the extraction of a large sample of files. UK annual reports’ lack standardization and are not as easily available. Still, while following the requirements imposed by IAS Regulation, UK firms still hold some discretionary power regarding content and structure and so, they can choose where they present the information in the annual report and the titles for each section (El–Haj, Alves, Rayson, Walker and Young, 2019a). This together with the fact that in UK, annual reports are published as PDF files represents a major obstacle to retrieve and process information, as the first step to analyse the narratives involves to automatically determine the structure of the annual report. Karthik, Li and Yang (2012) state that financial reporting and voluntary disclosure are complementary, since FS represent supportable evidence, while the narratives improve the FS’s credibility. Still, the narratives can also be subjected to management bias, since there is an opportunity for firms to manipulate the market perception of their financial performance or corporate accomplishments. Likewise, they can act as proxy for firm performance.
Merkl–Davies and Brennan (2007) showed that impression management8 is
one incentive for voluntary narrative disclosures. Huang, Teoh and Zhang (2011) demonstrated that managers use tone management9 to mislead investor’s
perception. Clatworthy and Jones (2003) proved that not only companies with improving performance present more good news and emphasize them, but also, there is a tendency to attribute improving performance on themselves and blame the environment in case of bad news. Li (2010a) evidenced the existence of
8“Impression management, the process by which people control the impressions others form of them” -–
Leary and Kowalski, 1990.
9Tone management is defined by Huang, Teoh and Zhang (2011) as the “choice of the tone level in
managerial SAB (self–attribution bias) – managers take responsibility for positive results and fault someone or something else for poor results – when she found a more recurrent use of first–person pronouns, in MD&A from 10–K files, for improving performance. In addition, the author showed that companies with lower earnings presented more complex10 annual reports, and the ones associated
with more persistent positive earnings have annual reports with higher levels of readability – they are easier to understand (Li, 2008). Lo, Ramos and Rogo (2016) showed that the MD&A section from 10–K files studied from 2000 to 2012 are more complex if the firm is more likely to have engaged in earnings management to overcome the previous year earnings.
Still, financial narratives can also be a source of incremental information. For instance, Smith and Tafler (2000) found that the chairman’s statement can be a predictor for financial distressed firms, “reinforcing the argument that such unaudited narrative disclosures contain important information associated with the future of the company”.
Ji, Talavera and Yin (2018) studied the Independent Directors Reports from Chinese listed firms from 2004–2012 by applying Naïve–Bayes classifiers. The authors found that positive (negative) tone is associated with improving (decreasing) firm performance (proxied by abnormal returns).
Price et al (2012) analysed earnings conference calls from the 4th quarter of 2004 to the 3rd quarter of 2007 using the GI list of words. The authors showed that the tone from quarterly earnings conference calls are a predictor of abnormal returns and trading volume.
10 For the mentioned paper, complexity is measured with the Fog index, which tell us the number of years
of formal education required for an average intelligence person to understand a text collection after reading
it once. It can be calculated with the following formula:
Fog index = (words per sentence + proportion of complex words)×0,4
Words with more than three syllables are defined as complex. High levels of the fog index (more than 14 years of formal education) indicate for high levels of complexity and low levels of readability. A fog index higher than 21 stands for unreadable discourses.
Overall, tone may be positive reflecting good performance, or it may signal positive expectations regarding future performance that quantitative disclosures do not reflect due to regulation. In both cases, tone is a source of incremental information. Nevertheless, it can also represent an attempt for managers to hide poor performance, which, in this case, is an example of tone management (Huang, Teoh and Zhang, 2011).
Following, we discuss the effects of the Brexit referendum and explain why we believe it will affect a company’s financial narratives.
2.3.
The Brexit referendum
Brexit stands for British exit.
On June 23rd, 2016 the UK voted to leave the EU. The EU was formally notified regarding the UK’s intention to no longer be a member by March 29th, 2017. According to Article 50 nº 3 on the Treaty on European Union11, withdrawal
negotiations may last two years. If the UK and the EU do not reach an agreement in that period, the UK will cease to be a member of the EU automatically. However, this period may be extended if the remaining EU state members unanimously approve. The deadline was set at 31st October 2019 and, until then, the UK is a member of the EU. The withdrawal process is still being negotiated.
When studying the effects of Brexit, literature focuses on the consequences of leaving the EU considering two possible scenarios, a Hard Brexit and a Soft Brexit. A Soft Brexit is considered an optimistic scenario. It assumes the UK remains in the European’s Union single market12, keeping the free movement of
goods, services, capital and labor. A Hard Brexit means total isolation of the UK.
11 Available at https://eur–lex.europa.eu/legal–content/EN/TXT/PDF/?uri=OJ:C:2012:326:FULL&from=EN.
12European Economic Area (EEA). By staying in the single market, the UK becomes a non–EU member with
a similar agreement with the EU like Norway, Liechtenstein and Iceland. These countries have a free–trade agreement with the EU allowing the free trade of goods, services, labor and capital. They still contribute to the EU budget. Contributions are not as large as if they were EU members, though (Chang, 2017).
Considering this scenario, trades between the UK and the EU are regulated under the WTO – World Trade Organization – terms. This is the same as a non– agreement Brexit.
In addition, work regarding Brexit also studies the market’s reaction to the vote.
By analysing a firm’s narratives, we want to understand if the effects of the Brexit referendum and the expectations towards the consequences of Brexit, are reflected and absorbed by the firms that compose our sample.
2.3.1.
The market reaction to the Brexit referendum
On June 24th, 2016, the day after the vote, the pound sterling registered its higher drop against the US Dollar since 1985. At the end of the day, the market closed with a nearly 8% drop in the GBP (see figure 1) while the EUR fell by, approximately, 2%. Against the EUR, the GBP reported a similar behavior, Exchange rates fell by 6% (see figure 2).
Note: The x–axis is the number of working days before (t<0) or following the Brexit referendum (t>0). Day zero is the day of the vote, June 23rd, 2016. The y–axis tells us how many USD 1 GBP
can buy. Source: Datastream.
Note: The x–axis is the number of working days before (t<0) or following the Brexit referendum (t>0). Day zero is the day of the vote, June 23rd, 2016. The y–axis tells us how many EUR 1 GBP
can buy. Source: Datastream.
The index FTSE100, FTSE250 and LSE closed the day with a loss higher than 3%, 7% and 9% respectively (see figure 3).
Figure 3 –Growth rate of the indexes around the Brexit vote
Note: The x–axis is the number of working days before (t<0) or following the Brexit referendum (t>0). Day zero is the day of the vote, June 23rd, 2016. The y–axis is the growth rate.
Source: Datastream.
The credit rating agencies downgraded the UK’s debt rating. Standard & Poor’s lowered UK’s credit rating to AA. Fitch ratings changed it from AA+ to AA. Moody’s who had previously classified the UK’s debt rating as stable, downgraded it to negative (Aristeidis and Elias, 2018; Oehler, Horn and Wendt, 2017).
Ramiah et al (2017) showed that the impact of the vote differs between sectors. However, most of them registered negative abnormal returns following the Brexit referendum. Banking was the most affected one. They also documented variations in the short–term systematic risk following the vote.
Bloom et al (2019) stated that the Brexit referendum started a period of high uncertainty. The authors found that nearly 40% of UK companies described Brexit as one of the top three causes of uncertainty in the two years following the referendum. Also, uncertainty is higher for firms who are more dependent on both trades or migrant labor from the EU, such as the ones from Wholesale & Retail and the Manufacturing industries. This finding is consistent with Oeher, Horn and Wendt (2017) who found that firms with lower levels of internationalization diversification – proxied by the weight of domestic sales – reported more negative abnormal returns the day following the vote, than the ones with high levels of diversification.
2.3.2.
Consequences of Brexit
Brexit is a major source of uncertainty, particularly towards the potential existence of trade barriers, affecting both imports and exports. Uncertainty from the possibility of loss of passporting rights13, which may have a significant impact
13 For the UK, having passporting rights allows UK firms to trade services with any country from the EEA
without the need of authorization from the country it is trading with, it reduces “red tap”. Ramiah et al (2017) showed that Banking was the most affected sector following the vote, registering a high drop on abnormal returns. This is consistent with the concern to lose passporting rights. Note that, the banking sector is responsible to generate 54% of income from financial services trades between the EU and the UK (Armour, 2017).
on services exports. Uncertainty from the regulation of matters that so far were of shared or of exclusive competence of the EU, such as agriculture and fishery, trade agreements, immigration and financial regulation (Chang, 2017).
Uncertainty is a major issue because both people and firms do not know what to expect. If they do not recognize with a reasonable amount of certainty what is to come, they are unable to hedge themselves against future issues.
Considering this, Dhingra et al (2017) estimated a drop on the consumption of UK goods and services per capita by 1.3% and 2.7% with a Soft and Hard Brexit, respectively. Leaving the single market is expected to result in a decrease of exportations and an increase in the price of importations, due to the imposition of trade barriers. Consequently, a drop in UK’s long–term GDP growth rate is anticipated. PwC (2016) and OECD (2016) estimated a 3.5% and a 5% decrease, respectively. Dhingra et al (2017) predicted more than a 7% drop.
So far, we have reported potential outcomes resulting from UK leaving the EU. Literature identifies both advantages and disadvantages of the Brexit. But for the matter of this thesis, the important subject here, is to understand that the market’s reaction to the vote suggests a negative sentiment towards Brexit. Yet, and as a lot of work highlights, estimates are based on assumptions characterized by high uncertainty, that may or may not be accurate and verified in the future, since there are so many questions and doubts. Lehmann and Zetzsche (2016) stated “(…) The only certainty for now is that it is impossible to predict the exact outcome of the negotiation process.”
This uncertainty and reaction are what we look to capture in our study. In addition to the work mentioned throughout the thesis, see Craig (2016) for a review of the process to get to the Brexit referendum; Belke, Dubova and Osowsi (2018) who studied the consequences of Brexit to the UK and non–UK countries; Steinberg (2019) that documented the impact of uncertainty on trade policies following the vote; Driffield and Karoglaw (2018) to understand the
effects of Brexit on foreign investment in the UK and Bockli et al (2017) who wrote “The Consequences of Brexit for Companies and Company Law”.
2.4.
Research question: the effect of the Brexit vote on a
firm’s discourse
Studies show that the annual report and individual sections, such as the Chairman’s and MD&A’s, carry predictive ability of a company’s future performance. Alves et al (2016) proposed three arguments that support the hypothesis that each section carries different predictive ability of firm performance, giving strength to the need to perform a simultaneous analysis of several annual report sections. First, each section, by definition, has one purpose and information may differ depending on the one it belongs to. Second, the whole annual report is not written by the same person or team. Furthermore, different authors may have a different profile – academic background and personality, for instance – which as shown by Argamon et al (2009) is reflected on linguistic style. Third, Ball, Robin and Wu (2003) showed that preparers’ incentives are a determinant of financial reporting quality. Moreover, Osma and Guillamón–Saorín (2011) documented that governance mechanisms impact management disclosures. Companies with strong governance policies are associated with higher quality disclosures.
Our goal is to understand if a company’s tone and discourse characteristics are affected by the Brexit referendum event. Given that, we compare its impact on different sentiments and sections. Thus, we not only care to explain tone, but also, uncertainty, forward–looking and causality as speech characteristics and sentiments in an annual report. Each one is studied for the Chairman’s, the CEO’s and the narratives’ sections.
To test if the Brexit referendum influenced companies, we formulated the following hypotheses:
H1a) Brexit has a negative impact on tone in the Chairman’s letter. H1b) Brexit has a negative impact on tone in the CEO’s review.
H1c) Brexit has a negative impact on the MD&A’s14 tone.
Considering the negative effect, the Brexit referendum had on firms’ abnormal returns for most sectors (Ramiah et al, 2017), we believe a company’s tone will decrease, consequently. These hypotheses are formulated under the assumption that tone and firm performance are positively associated, meaning that decreasing performance is reflected with a more negative tone.
H2a) Brexit has a positive impact on the level of uncertainty in the Chairman’s section.
H2b) Brexit has a positive impact on the level of uncertainty in the CEO’s section. H2c) Brexit has a positive impact on the MD&A’s level of uncertainty.
Uncertainty words are defined as the ones related with the notion of imprecision (Loughran and McDonald, 2011). As mentioned throughout the thesis, one of the major consequences of the referendum is the uncertainty it brought and created for firms in the UK. Given that, we expect the referendum to increase the use of uncertainty words on the firm’s annual report.
Still, we must highlight that literature on the study of uncertainty discourse, forward–looking speech and causal reasoning as speech dimensions for Accounting and Finance research is sparse and limited. For this reason, this assumes an exploratory character.
H3a) Brexit has a positive impact on the use of forward–looking words in the
Chairman’s section.
H3b) Brexit has a positive impact on the use of forward–looking words in the CEO’s
section.
H3c) Brexit has a positive impact on the MD&A’s use of forward–looking words.
14 As mentioned on page 8, the MD&A or Management Commentary, may include several annual report sections’
and, as so, it is commonly used to refer to the narratives. Given that, hereinafter when we use the term MD&A we are referring to the narratives.
Hussainey et al (2003) identified forward–looking words as the ones “associated with forecasts and predictions”.
Although the study of forward–looking discourse undertakes an experimental character – and, given that, there is some doubt towards the expected impact of the vote on forward–looking discourse – following the work from Bozanic et al (2018), we believe the vote has positive effect on forward–looking words. The authors found that when uncertainty is high, the issuance of forward–looking statements with a non–forecast–like dimension (non–quantitative earnings– related reports) increases. Furthermore, Athanasakou and Hussainey (2014) showed that firms make more disclosures on forward–looking performance – measured by an index of reports regarding expected performance – when they increase levels of debt or if they are to announce bad news.
H4a) Brexit has a positive impact on the use of causal words in the Chairman’s section. H4b) Brexit has a positive impact on the use of causal words in the CEO’s section. H4c) Brexit has a positive impact on the MD&A’s use of causal words.
Causal words are the ones used when we are explaining or justifying something. Zhang and Aerts (2015) stated it is the kind of language used when the firm is explaining “why” and “how” of its performance. Their paper studies the use of causality words on the Management Commentary, as an impression management mechanism firms use when they fail to meet earnings thresholds. They found a positive relationship between the use of causal reasoning words and not meeting earnings thresholds, “such as positive earnings, earnings change and analyst earnings consensus”. Li (2008) found that companies with less persistent earnings use causal words more frequently.
Considering the impact of the Brexit referendum documented related with the decrease on cumulative abnormal returns and abnormal returns, the expectations towards the UK’s GDP, the evolution of consumption of UK goods and services,
but also UK exports, we believe the use of causal language will become more recurrent following the vote.
3. Methodology
3.1.
Sample selection
The digital PDF annual reports are processed by the software CFIE–FRSE, which generates the dataset of textual analysis. It includes one dummy variable (DR_AR_IGNORE) that takes the value one if the annual report classification accuracy is questionable. To collect the sample, we drop those observations (DR_AR_IGNORE=1) and the ones with no data. Next, we delete the ones prior to 2012 and utility firms as well.
Due to the presence of outliers, we drop the extreme bottom and top one percentiles for the following variables: ROA, market value and book–to–market ratio. For the returns, earnings yield, change in ROA and ROA and returns volatility we only drop the observations above percentile 99.
Our sample comprises a total of 6,821 annual reports. The number of observations varies across annual report section.
3.2.
Research design
To test our hypotheses, we formulate several OLS regression models. To understand the impact of the referendum, first, we regress tone, uncertainty, forward–looking and causality on tone determinants and industry–fixed effects which control for firm features. Then, we formulate a second regression model and add the Brexit indicator variable.
Each sentiment is regressed for three sections, the CEO’s, the Chairman’s and the MD&A’s, according to the hypothesis being tested.
Tests on our hypotheses focus on estimates of 𝛽14 from the following
𝑁𝑎𝑟𝑟𝑎𝑡𝑖𝑣𝑒𝑠′𝑐ℎ𝑎𝑟𝑎𝑐𝑡𝑒𝑟𝑖𝑠𝑡𝑖𝑐𝑠 = 𝛽0+ 𝛽1𝑅𝑂𝐴𝑖𝑡+ 𝛽2𝐶ℎ_𝑅𝑂𝐴𝑖𝑡+ 𝛽3𝑅𝑒𝑡𝑖𝑡+ 𝛽4𝐸𝑌𝑖𝑡 + 𝛽5𝐶ℎ_𝐸𝑌𝑖𝑡+ 𝛽6𝑆𝑖𝑧𝑒𝑖𝑡+ 𝛽7𝐵𝑇𝑀𝑖𝑡+ 𝛽8𝑅𝑒𝑡𝑉𝑜𝑙𝑖𝑡 + 𝛽9𝑅𝑂𝐴𝑉𝑜𝑙𝑖𝑡 + 𝛽10𝐴𝑔𝑒𝑖𝑡+ 𝛽11𝐺𝑒𝑜𝑆𝑒𝑔𝑖𝑡 + 𝛽12𝐵𝑢𝑠𝑆𝑒𝑔𝑖𝑡+ 𝛽13𝐿𝑜𝑠𝑠𝑖𝑡+ 𝛽14𝐵𝑟𝑒𝑥𝑖𝑡𝑖𝑡 + 𝑖𝑛𝑑𝑢𝑠𝑡𝑟𝑦 − 𝑓𝑖𝑥𝑒𝑑 𝑒𝑓𝑓𝑒𝑐𝑡𝑠 + 𝜀𝑖𝑡 (1 – 12)
Note that, the independent variables are the same regardless of the sentiment and annual report section. The only difference among the regression models used to test our hypotheses, are the dependent variables, which vary according to the sentiment and section.
The dependent variable for model (1) is the tone of the Chairman’s section from the annual report published by firm i in year t; for model (2) is the tone of the CEO’s section from the annual report published by firm i in year t; for model (3) is the tone of the MD&A from the annual report published by firm i in year t; for model (4) is the uncertainty of the Chairman’s section from the annual report published by firm i in year t; for model (5) is the uncertainty from the CEO’s section, from the annual report published by firm i in year t; for model (6) is the uncertainty of the MD&A from the annual report published by firm i in year t; for model (7) is the forward–looking of the Chairman’s section from the annual report published by firm i in year t; for model (8) is the forward–looking of the CEO’s section from the annual report published by firm i in year t; for model (9) is the forward-looking of the MD&A from the annual report published by firm i in year t; for model (10) is the causal reasoning of the Chairman’s section from the annual report published by firm i in year t; for model (11) is the causal reasoning of the CEO’s section from the annual report published by firm i in year t; for model (12) is the causal reasoning of the MD&A from the annual report published by firm i in year t.
Following the literature by Li (2008 and 2010) we run panel data regression models on tone determinants suggested by the author. ROA and change in ROA are proxies for profitability. Market and financial performance are measured by the returns, earnings yield and its change. The logarithm of the companies’ equity market value controls for firm dimension. The book–to–market ratio is a proxy for growth opportunities. The ROA and returns volatility control for operational and business risk. Age captures the life cycle of the firm. The number of geographic segments and business segments controls for the firm’s operating complexity. Loss controls for an event of decreasing earnings yield.
Apart from the Brexit indicator variable, our models differ from hers, since we do not control for special items and firm events (seasoned equity offerings and mergers and acquisitions). Also, we add the variables earnings yield and its change and dummy variable loss, to control for situations of changes in earnings and its decline. Each variable is defined in table 16 in appendix.
𝑅𝑂𝐴𝑖𝑡 is return on assets of firm i in year t; 𝐶ℎ_𝑅𝑂𝐴𝑖𝑡 is the change in the return
on assets of firm i in year t; 𝑅𝑒𝑡𝑖𝑡 is the 12–month stock return of firm i in year t;
𝐸𝑎𝑟𝑛𝑖𝑛𝑔𝑠 𝑌𝑖𝑒𝑙𝑑𝑖𝑡 is the earnings yield of firm i in year t; 𝐶ℎ_𝐸𝑌𝑖𝑡 is the change in
the earnings yield of firm i in year t; 𝑆𝑖𝑧𝑒𝑖𝑡 is the logarithm of market
capitalization at fiscal year–end of firm i in year t; 𝐵𝑇𝑀𝑖𝑡 is the book–to–market
ratio of firm i in year t; 𝑅𝑒𝑡𝑉𝑜𝑙𝑖𝑡 is the returns’ volatility of firm i in year t;
𝑅𝑂𝐴𝑉𝑜𝑙𝑖𝑡 is the ROA volatility of firm i in year t; 𝐴𝑔𝑒𝑖𝑡 is the log(1+age) of firm i
in year t; 𝐺𝑒𝑜𝑆𝑒𝑔𝑖𝑡 is the log(1 + number of geographic segments) of firm i in year
t; 𝐵𝑢𝑠𝑆𝑒𝑔𝑖𝑡 is the log(1 + number of business segments) of if firm i in year t; 𝐿𝑜𝑠𝑠𝑖𝑡
is the dummy variable that takes the value 1 if the EY from firm i in year t is lower than zero, or zero otherwise; 𝐵𝑟𝑒𝑥𝑖𝑡𝑖𝑡 is the indicator variable that takes the value
one if the annual report from firm i is published in 2016 or 2017 and zero otherwise. Since the referendum happened in June 2016, we believe this year’s annual report can capture its effect, once they are typically disclosed at the end
of the year, which makes us believe, firms had time to react to the vote and reflect that reaction and expectations in the annual report.
4. Results
Table 1 presents the descriptive statistics of the sample including both financial and non–financial firms.
The median firm has one geographic and business segments. It has 16 years, a market capitalization of 100, a book to market ratio of 0.61; a 12–month stock return of 7.5%; an earnings yield of 4.6%; a ROA of 3.6% and both have changes of, approximately, 0.6%. It has a return and ROA volatility of, approximately, 0.08 and 0.07, respectively. Also, the median firm has a positive tone (tone is higher than zero) and the CEO’s section is the one with the higher levels (0.42). Uncertainty words follow the same pattern, being the CEO’s section the one with the highest level (approximately 0.05). Forward–looking discourse is higher for the Chairman’s statement (0.02), while causal words are more frequent in the narratives (0.01).
Results are presented as follows. For tone – models (1), (2) and (3) – see table 2; for uncertainty – models (4), (5) and (6) – see table 5; for forward–looking – models (7), (8) and (9) – see table 8; for causal reasoning – models (10), (11) and (12) – see table 11.
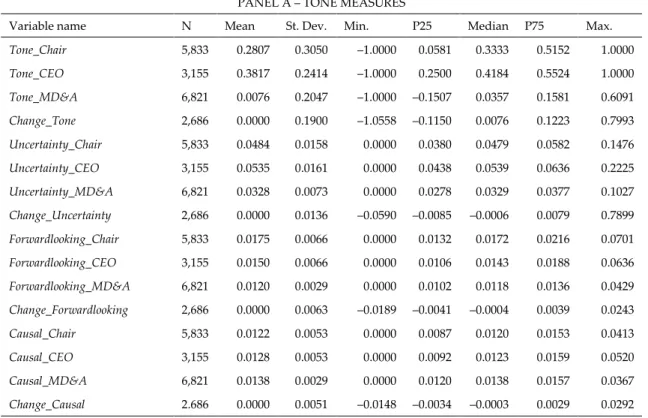
Table 1 – Descriptive statistics
PANEL A – TONE MEASURES
Variable name N Mean St. Dev. Min. P25 Median P75 Max.
Tone_Chair 5,833 0.2807 0.3050 –1.0000 0.0581 0.3333 0.5152 1.0000 Tone_CEO 3,155 0.3817 0.2414 –1.0000 0.2500 0.4184 0.5524 1.0000 Tone_MD&A 6,821 0.0076 0.2047 –1.0000 –0.1507 0.0357 0.1581 0.6091 Change_Tone 2,686 0.0000 0.1900 –1.0558 –0.1150 0.0076 0.1223 0.7993 Uncertainty_Chair 5,833 0.0484 0.0158 0.0000 0.0380 0.0479 0.0582 0.1476 Uncertainty_CEO 3,155 0.0535 0.0161 0.0000 0.0438 0.0539 0.0636 0.2225 Uncertainty_MD&A 6,821 0.0328 0.0073 0.0000 0.0278 0.0329 0.0377 0.1027 Change_Uncertainty 2,686 0.0000 0.0136 –0.0590 –0.0085 –0.0006 0.0079 0.7899 Forwardlooking_Chair 5,833 0.0175 0.0066 0.0000 0.0132 0.0172 0.0216 0.0701 Forwardlooking_CEO 3,155 0.0150 0.0066 0.0000 0.0106 0.0143 0.0188 0.0636 Forwardlooking_MD&A 6,821 0.0120 0.0029 0.0000 0.0102 0.0118 0.0136 0.0429 Change_Forwardlooking 2,686 0.0000 0.0063 –0.0189 –0.0041 –0.0004 0.0039 0.0243 Causal_Chair 5,833 0.0122 0.0053 0.0000 0.0087 0.0120 0.0153 0.0413 Causal_CEO 3,155 0.0128 0.0053 0.0000 0.0092 0.0123 0.0159 0.0520 Causal_MD&A 6,821 0.0138 0.0029 0.0000 0.0120 0.0138 0.0157 0.0367 Change_Causal 2.686 0.0000 0.0051 –0.0148 –0.0034 –0.0003 0.0029 0.0292
PANEL B – TONE DETERMINANTS/ FIRM SPECIFICS
Variable name N Mean St. Dev. Min. P25 Median P75 Max.
ROA 6,821 –0.0110 0.2135 –1.7136 –0.0415 0.0360 0.0927 0.3903
Change ROA 6,821 0.0224 0.3028 –0.8096 –0.0358 0.0056 0.0472 11.8066
Returns 6,821 0.0983 0.4360 –1.0000 –0.1506 0.0747 0.2966 2.4211
Earnings Yield 6,821 –0.0237 0.4491 –18.0000 –0.0472 0.0459 0.0942 0.5855
Change Earnings Yield 6,821 0.0537 1.0341 –32.1786 –0.0338 0.0061 0.0584 43.0127
Market Value 6,821 959 3,191 1 21 100 505 37,937
BTM 6,821 0.4282 1.4194 –14.0037 0.2424 0.6102 1.0297 4.2778
Return Volatility 6,821 0.0995 0.0709 0.0031 0.0514 0.0796 0.1259 0.5068
ROA Volatility 6,821 0.1332 0.2549 0.0002 0.0283 0.0656 0.1395 3.8501
Age 6,821 21.4454 14.9918 0.0000 11.0000 16.0000 29.0000 53.0000
Number geographic seg. 6,821 2.4130 1.9554 1.0000 1.0000 1.0000 4.0000 10.0000
Number business seg. 6,821 2.2466 1.6895 1.0000 1.0000 1.0000 3.0000 10.0000
Loss 6,821 0.3271 0.4692 0.0000 0.0000 0.0000 1.0000 1.0000
Brexit 6,821 0.3168 0.4653 0.0000 0.0000 0.0000 1.0000 1.0000
The sample comprises firm–years for firms listed in the London Stock Exchange with fiscal year–ends between January 2012 and December 2017. Source: market and accounting data is extracted from Datastream. Tone variables belong to the dataset available for download at http://www.research.lancs.ac.uk/portal/en/datasets/uk-annual-report-narratives-dataset-cfiefrse-may-2019(4443e5bd-38c4-45bf-ae96-a7d947e529ce).html
4.1.
Tone
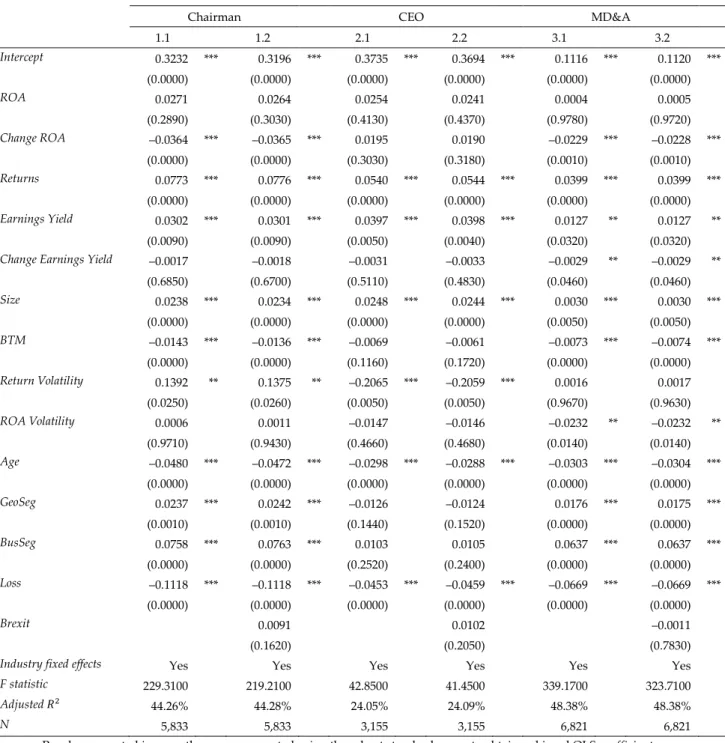
Table 2 presents the regression models on tone from the CEO’s, the Chairman’s and the MD&A’s sections of the annual report. Each one is shown with and without the Brexit indicator variable.
Table 2 – OLS coefficients estimates of tone
Tone
Chairman CEO MD&A 1.1 1.2 2.1 2.2 3.1 3.2 Intercept 0.3232 *** 0.3196 *** 0.3735 *** 0.3694 *** 0.1116 *** 0.1120 *** (0.0000) (0.0000) (0.0000) (0.0000) (0.0000) (0.0000) ROA 0.0271 0.0264 0.0254 0.0241 0.0004 0.0005 (0.2890) (0.3030) (0.4130) (0.4370) (0.9780) (0.9720) Change ROA –0.0364 *** –0.0365 *** 0.0195 0.0190 –0.0229 *** –0.0228 *** (0.0000) (0.0000) (0.3030) (0.3180) (0.0010) (0.0010) Returns 0.0773 *** 0.0776 *** 0.0540 *** 0.0544 *** 0.0399 *** 0.0399 *** (0.0000) (0.0000) (0.0000) (0.0000) (0.0000) (0.0000) Earnings Yield 0.0302 *** 0.0301 *** 0.0397 *** 0.0398 *** 0.0127 ** 0.0127 ** (0.0090) (0.0090) (0.0050) (0.0040) (0.0320) (0.0320)
Change Earnings Yield –0.0017 –0.0018 –0.0031 –0.0033 –0.0029 ** –0.0029 **
(0.6850) (0.6700) (0.5110) (0.4830) (0.0460) (0.0460) Size 0.0238 *** 0.0234 *** 0.0248 *** 0.0244 *** 0.0030 *** 0.0030 *** (0.0000) (0.0000) (0.0000) (0.0000) (0.0050) (0.0050) BTM –0.0143 *** –0.0136 *** –0.0069 –0.0061 –0.0073 *** –0.0074 *** (0.0000) (0.0000) (0.1160) (0.1720) (0.0000) (0.0000) Return Volatility 0.1392 ** 0.1375 ** –0.2065 *** –0.2059 *** 0.0016 0.0017 (0.0250) (0.0260) (0.0050) (0.0050) (0.9670) (0.9630) ROA Volatility 0.0006 0.0011 –0.0147 –0.0146 –0.0232 ** –0.0232 ** (0.9710) (0.9430) (0.4660) (0.4680) (0.0140) (0.0140) Age –0.0480 *** –0.0472 *** –0.0298 *** –0.0288 *** –0.0303 *** –0.0304 *** (0.0000) (0.0000) (0.0000) (0.0000) (0.0000) (0.0000) GeoSeg 0.0237 *** 0.0242 *** –0.0126 –0.0124 0.0176 *** 0.0175 *** (0.0010) (0.0010) (0.1440) (0.1520) (0.0000) (0.0000) BusSeg 0.0758 *** 0.0763 *** 0.0103 0.0105 0.0637 *** 0.0637 *** (0.0000) (0.0000) (0.2520) (0.2400) (0.0000) (0.0000) Loss –0.1118 *** –0.1118 *** –0.0453 *** –0.0459 *** –0.0669 *** –0.0669 *** (0.0000) (0.0000) (0.0000) (0.0000) (0.0000) (0.0000) Brexit 0.0091 0.0102 –0.0011 (0.1620) (0.2050) (0.7830)
Industry fixed effects Yes Yes Yes Yes Yes Yes
F statistic 229.3100 219.2100 42.8500 41.4500 339.1700 323.7100
Adjusted 𝑅2
44.26% 44.28% 24.05% 24.09% 48.38% 48.38%
N 5,833 5,833 3,155 3,155 6,821 6,821
P–values reported in parentheses are computed using the robust standard errors to obtain unbiased OLS coefficients. OLS coefficients estimates and its p–values in parentheses. *p–value < 0.1; **p–value < 0.05; ***p–value < 0.01.
Brexit seems to not explain tone as H1a, H1b and H1c are rejected. The indicator
variable has no statistical significance. We identify two reasons to explain this result. Firstly, companies do not react to the vote, suggesting it has no effect on their expectations of future performance. We find this unlikely considering the results to be presented further and literature on the market reaction to the vote. Secondly, firms do not identify a positive or negative dimension in result of the Brexit referendum. This finding is consistent with the uncertainty hypothesis. Since companies are unable to identify which scenario will result from the Brexit event, they do not attribute a positive or negative sentiment to the vote, which explains why the Brexit variable adds no value (to the regression model without the Brexit dummy variable) when explaining tone. Note that, the scenario in which the UK leaves the EU has a major impact on companies. In addition, the reaction to the vote varies significantly across industry.
Bouoiyour and Selmi (2018) showed that Financial and Technology firms reported stronger stock price declines as a reaction to the referendum than industries such as Consumer Goods and Oil and Gas. Even though, all industries studied reacted negatively to the vote, these last two were much less sensible.
Furthermore, with the sterling depreciation exports are expected to become cheaper (ceteris paribus), explaining why Consumer Goods do not react as badly (as Technology and Financial firms). Oil and Gas companies trade mostly in US Dollars and for that reason, are considered in this scenario, as “safe haven” (Bouoiyour and Selmi, 2018). Knowing this, and once our sample includes those industries, we conduct this analysis on financial and non–financial firms traded in the LSE. We chose to analyse the financial industry individually due to its importance in the UK and the studies suggesting it was one of the most affected industry by the referendum. In 2018, the financial sector accounted for 7% of UK’s GDP and 23% of all services exports in the UK, which, in 2017, 43% of those were to EU countries (Rhodes, 2019). Tables 17 and 18 in appendix present the
descriptive statistics of non-financial and financial firms, respectively. Our results are presented on the tables 3 and 4.
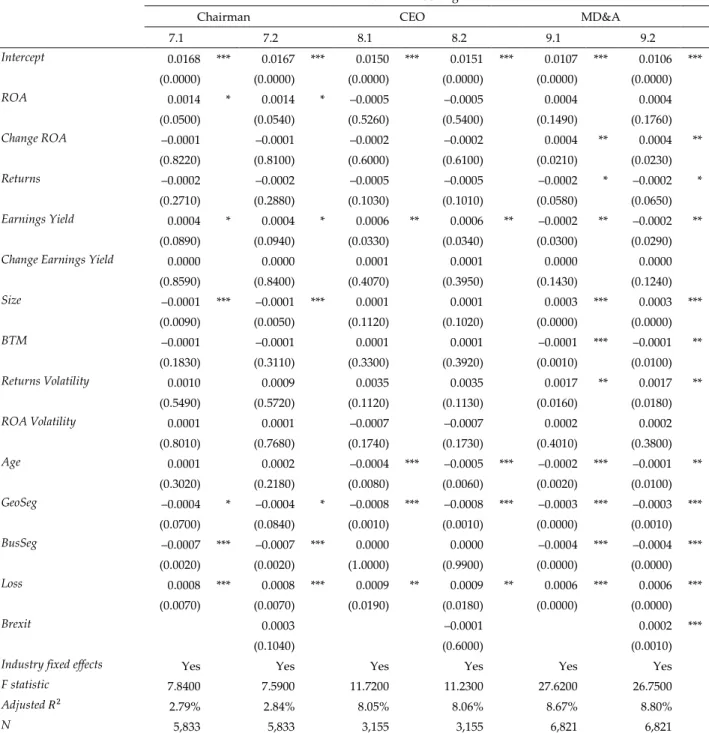
While the tone from financial firms is not explained by the Brexit referendum, the tone from non–financial companies became more positive following the vote.
Before discussing these results, we must highlight that our sample is composed by traded firms on the LSE, not necessarily firms based in the UK. These firms may react positively as they identify the possibility to win market share by the UK exit from the EU.
Note that, while one sample only includes financial firms, the other is a diversified sample, including seven different industries – Basic Materials, Consumer Goods, Consumer Services, Healthcare, Industrials, Oil and Gas, Technology and Telecommunications – which may explain the positive tone following the referendum.
Last of all, Bouoiyour and Selmi (2018) also concluded that when firms announced projects related with product diversification, abnormal returns become positive. In exception to Consumer Goods firms’, this was reported for all sectors in–sample. At least 25% of our sample of non–financial institutions is composed by firms with geographic segments – proxy for diversification – between 4 and 10. This means the impact of Brexit, even if negative, it is lower for these firms. In contrast, only 5% of financial firms have, at least, 4 geographic segments, which shows this sample has a much lower weight of diversified companies (when compared to non–financial firms). The ones with less diversification – less than 4 geographic segments (95%) – are more exposed to the potential consequences from Brexit, which, consequently, explains the results obtained.
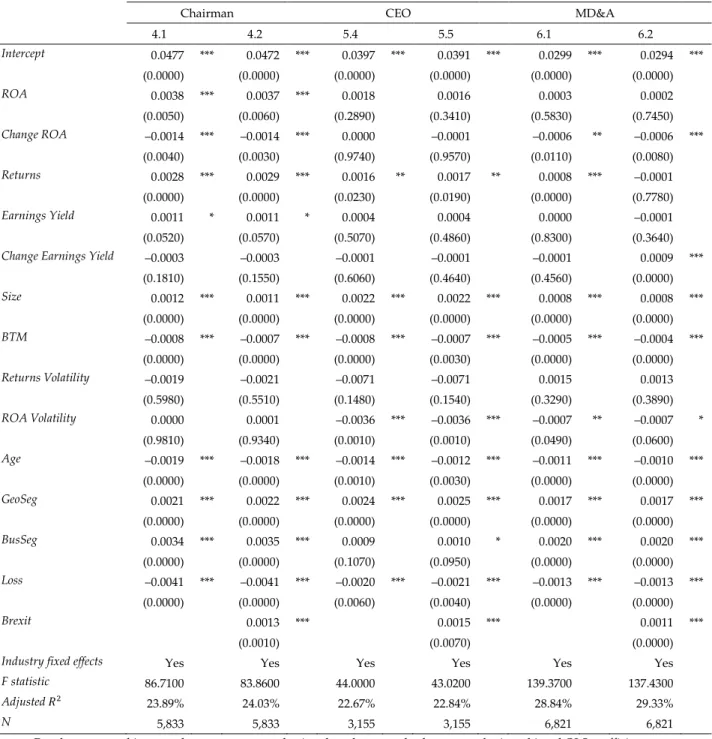
Table 3 – Non–financial firms: OLS coefficients estimates of tone
Tone
Chairman CEO MD&A 1.1 1.2 2.1 2.2 3.1 3.2 Intercept 0,4375 *** 0,4325 *** 0,4096 *** 0,4036 *** 0,2073 *** 0,2064 *** (0,0000) (0,0000) (0,0000) (0,0000) (0,0000) (0,0000) ROA 0,0606 ** 0,0605 ** 0,0283 0,0267 0,0062 0,0061 (0,0280) (0,0290) (0,3800) (0,4090) (0,6940) (0,7010) Change ROA –0,0380 *** –0,0382 *** 0,0224 0,0215 –0,0193 *** –0,0193 *** (0,0000) (0,0000) (0,2430) (0,2620) (0,0090) (0,0080) Returns 0,0806 *** 0,0807 *** 0,0555 *** 0,0556 *** 0,0429 *** 0,0429 *** (0,0000) (0,0000) (0,0000) (0,0000) (0,0000) (0,0000) Earnings Yield 0,0273 ** 0,0271 ** 0,0449 *** 0,0452 *** 0,0154 ** 0,0154 ** (0,0170) (0,0180) (0,0040) (0,0040) (0,0170) (0,0180)
Change Earnings Yield 0,0003 0,0002 –0,0033 –0,0036 –0,0017 –0,0018
(0,9320) (0,9650) (0,4780) (0,4300) (0,3600) (0,3520) Size 0,0239 *** 0,0235 *** 0,0226 *** 0,0221 *** 0,0035 *** 0,0034 *** (0,0000) (0,0000) (0,0000) (0,0000) (0,0050) (0,0060) BTM –0,0067 ** –0,0058 * –0,0033 –0,0020 –0,0022 –0,0020 (0,0300) (0,0640) (0,4600) (0,6550) (0,2210) (0,2640) Return Volatility –0,2109 *** –0,2117 *** –0,3088 *** –0,3067 *** –0,2318 *** –0,2319 *** (0,0020) (0,0020) (0,0000) (0,0000) (0,0000) (0,0000) ROA Volatility 0,0206 0,0215 –0,0205 –0,0200 –0,0174 –0,0173 (0,2360) (0,2140) (0,3700) (0,3800) (0,1140) (0,1160) Age –0,0404 *** –0,0392 *** –0,0249 *** –0,0233 *** –0,0329 *** –0,0326 *** (0,0000) (0,0000) (0,0000) (0,0000) (0,0000) (0,0000) GeoSeg 0,0057 0,0062 –0,0032 –0,0030 0,0086 * 0,0087 * (0,4630) (0,4240) (0,7180) (0,7330) (0,0660) (0,0650) BusSeg –0,0036 –0,0034 –0,0207 ** –0,0208 ** 0,0126 ** 0,0126 ** (0,6600) (0,6770) (0,0280) (0,0280) (0,0100) (0,0100) Loss –0,0837 *** –0,0838 *** –0,0393 *** –0,0404 *** –0,0618 *** –0,0619 *** (0,0000) (0,0000) (0,0030) (0,0020) (0,0000) (0,0000) Brexit 0,0126 * 0,0154 * 0,0023 (0,0900) (0,0550) (0,5960)
Industry fixed effects Yes Yes Yes Yes Yes Yes
F statistic 64,6300 61,6100 35,3700 34,2800 68,1900 64,9000
Adjusted 𝑅2 27,50% 27,55% 23,31% 23,41% 25,10% 25,10%
N 3,826 3,826 2,588 2,588 4,525 4,525
P–values reported in parentheses are computed using the robust standard errors to obtain unbiased OLS coefficients. OLS coefficients estimates and its p–values in parentheses. *p–value < 0.1; **p–value < 0.05; ***p–value < 0.01.
Table 4 – Financial firms: OLS coefficients estimates
Tone
Chairman CEO MD&A 1.1 1.2 2.1 2.2 3.1 3.2 Intercept –0.1712 *** –0.1765 *** 0.0777 0.0809 –0.3111 *** –0.3092 *** (0.0000) (0.0000) (0.2760) (0.2620) (0.0000) (0.0000) ROA 0.0865 0.0820 0.0045 0.0046 0.0520 0.0536 (0.2580) (0.2860) (0.9760) (0.9750) (0.2350) (0.2230) Change ROA –0.0518 –0.0521 –0.0337 –0.0331 –0.0604 ** –0.0605 ** (0.2560) (0.2560) (0.8240) (0.8260) (0.0240) (0.0230) Returns 0.0606 ** 0.0623 ** 0.0491 0.0475 0.0260 * 0.0254 * (0.0230) (0.0200) (0.1080) (0.1380) (0.0900) (0.0980) Earnings Yield 0.0419 *** 0.0418 *** –0.0038 –0.0028 0.0090 0.0090 (0.0050) (0.0050) (0.9450) (0.9590) (0.5450) (0.5440)
Change Earnings Yield –0.0164 –0.0164 0.0158 0.0155 –0.0035 * –0.0035 *
(0.2120) (0.2140) (0.4270) (0.4390) (0.0630) (0.0620) Size 0.0167 *** 0.0162 *** 0.0296 *** 0.0299 *** –0.0016 –0.0014 (0.0000) (0.0000) (0.0000) (0.0000) (0.4610) (0.5230) BTM –0.0198 *** –0.0189 *** –0.0160 –0.0166 –0.0125 *** –0.0128 *** (0.0000) (0.0010) (0.1970) (0.1910) (0.0000) (0.0000) Return Volatility 1.0455 *** 1.0393 *** 0.4517 0.4555 0.6634 *** 0.6654 *** (0.0000) (0.0000) (0.1480) (0.1460) (0.0000) (0.0000) ROA Volatility –0.0525 –0.0516 0.0552 0.0557 –0.0476 *** –0.0479 *** (0.1220) (0.1290) (0.2340) (0.2300) (0.0050) (0.0050) Age –0.0382 *** –0.0373 *** –0.0358 ** –0.0362 ** –0.0096 * –0.0099 * (0.0000) (0.0000) (0.0280) (0.0270) (0.0780) (0.0700) GeoSeg 0.0524 *** 0.0534 *** –0.0407 –0.0414 0.0307 *** 0.0304 *** (0.0020) (0.0020) (0.1180) (0.1220) (0.0050) (0.0060) BusSeg 0.2288 *** 0.2298 *** 0.1069 *** 0.1061 *** 0.1629 *** 0.1625 *** (0.0000) (0.0000) (0.0000) (0.0000) (0.0000) (0.0000) Loss –0.1429 *** –0.1427 *** –0.0907 ** –0.0909 ** –0.0733 *** –0.0734 *** (0.0000) (0.0000) (0.0140) (0.0140) (0.0000) (0.0000) Brexit 0.0095 –0.0059 –0.0036 (0.4180) (0.8190) (0.6110) F statistic 73.6300 68.4400 8.5000 7.8900 66.1700 61.6200 Adjusted 𝑅2 32.53% 32.56% 16.02% 16.03% 27.57% 27.58% N 2,007 2,007 567 567 2,296 2,296 P–values reported in parentheses are computed using the robust standard errors to obtain unbiased OLS coefficients. OLS coefficients estimates and its p–values in parentheses. *p–value < 0.1; **p–value < 0.05; ***p–value < 0.01.