Evolution of the Birth Rates and Infant Mortality Rates
between 1990-2007 in Cluj District
Rodica RADU
1,*, Anamaria MOLNAR
1, Tudor MÎRZA
1,
Ş
tefan I.
Ţ
IGAN
21 Institute of Public Health “Prof. dr. Iuliu Moldovan” Napoca, 6 Louis Pasteur, 400349
Cluj-Napoca, Cluj, Romania.
2 “Iuliu Haţieganu” University of Medicine and Pharmacy Napoca, 13 Emil Isac, 400023
Cluj-Napoca, Cluj, Romania.
E-mail(s): [email protected]; [email protected]; [email protected]; [email protected].
* Author to whom correspondence should be addressed; Tel.: 0264 594252 ext 124; Fax: 0264 594274.
Received: 10 March 2010 /Accepted: 26 March 2010 / Published online: 30 March 2010
Abstract
Despite this generally positive trend, our country continues to have the highest rates of infant mortality between countries and EU candidate countries, with a better reporting system of infant mortality. The study aims to identify and assess infectious risk factors affecting the survival chances of the child. This study is a descriptive epidemiological study of Cluj district population of children under 1 year, born between 2001-2007. In Cluj district, birth rate is rising slightly from 8.8 ‰ in 2000 to 9.3 ‰ in 2007, with a peak in rural areas (10.3 ‰) in 2000 and a minimum urban areas (7.8 ‰) in 2001. Infant mortality rate gradually decreases (29.7 ‰ in 1990 to 14.1 ‰ in 2007) but remains much higher in rural compared to urban (24.1 ‰ in 1990 to 10.2 ‰ in 2007). In the evolution of infant mortality depending on the causes of death between 1991-2007 there was a decrease in deaths due to respiratory disease, due to perinatal pathology and due to infectious and parasitic diseases. Congenital malformations death rate remains high and at constant level. Infant mortality is obviously decreasing, but its value remains among the highest in Europe. There is a very high proportion of deaths from respiratory diseases. These deaths are considered avoidable.
Keywords: Birth rate; Infant mortality; Perinatal; Infectious.
Introduction
In the last 35 years in public health in the world some improvement was produced. In the world during the years 1960-1990 the mortality of children up to age 5 years was reduced by half: from 216 ‰ to 107 ‰. The average life span has increased in this period from 46 to 62 years. However, fertility rates declined from 4.9 to 2.9 and are still falling. Maternal mortality in the same period has decreased substantially.
Although in the health care of mother and child were obtained many successes, many women remain at risk during pregnancy and birth, for causes which remained virtually unchanged over recent decades. Maternal complications remain a serious problem in obstetrical care and in the world, many cases of fetal death rate and early neonatal death occurs from preventable causes.
children mortality up to 5 years has been noted in the recent years [2]. Neonatal deaths represent 40% of all deaths among children to up 5 years of age. The risk of death in the first month of life is 15 times higher than in any other month during the first year of life. Women’s health care in the period before pregnancy, in pregnancy, birth, postnatal period and that given to the newborn reflects consideration and respect of society for women and children [3].
In recent years, Romania has made progress in reducing child mortality, given that in 1990 its rate was 26.9 ‰. In 1999 the infant mortality rate reached the threshold of 20 ‰ and continues to decrease to a value of 16.7 ‰ in 2003[4].
Despite this generally positive trend, our country continues to have the highest rates of infant mortality between countries and EU candidate countries, with a better reporting system of infant mortality. 1-4 years child mortality rate has decreased every year, but still remains death at home. Accidents which are considered avoidable deaths were 38.9% in 2002 and 47% in 2003, according to the Center of Medical Statistics of Ministry of Health [5].
To work towards reducing child mortality, it is necessary to assess accurately the factors that determine or influence, followed by identifying and implementing the most effective solutions to minimize the effect of the factors identified. In this regard, systematic studies are needed to be developed, to be the basis for intervention programs, which must be implemented through synergistic inter-sectoral cooperation.
Starting with the premises that maternal and newborn mortality is determined by many factors among which a special role plays infectious diseases, the study aims to identify and assess infectious risk factors affecting survival chances of the child.
Material and Method
This study is a descriptive epidemiological study of Cluj district population of children under 1 year, born between 2001-2007. The comparison was made with the national data.
Local information source was represented by the Regional Directorate of Statistics Cluj and District Department of Public Health. For country-level data, data source was represented by the Romanian Statistical Yearbook. International data comes from the website of the World Health Organization. Data collection was performed during 2001-2007.
Statistical processing included, in addition to the calculation of different rates, χ2 test and Bravais-Pearson correlation coefficient (r). χ2 test is a nonparametric test, used to test the degree of "proximity" between an empirical and a theoretical distribution, testing the differences between the two structures. The test applies to any type of frequencies, irrespective of the size of tables they appear. Thus, for contingency tables we can test the significance of association, comparing the empirical frequencies with those obtained under the assumption of independence of factors.
To detect the correlation between two quantitative variables continue using Bravais-Pearson correlation coefficient (r). Correlation coefficient analysis was performed using Colton's rule. Statistical limit of tests used was α = 0.05.
Statistical processing was performed with Microsoft Excel (Microsoft Office 2003), online software - statistical analysis Medical OpenEpi v.2.3. [1]
Graphical representation of results was done with the Excel application (Microsoft Office 2003).
Results
14.5 14.7
9.2 12.9 15.8
8.1 10.1 11.1
12.2 16.6
17.9 15.4
9.1 14.8
19.3 17.7 19.5
16.4
0.0 5.0 10.0 15.0 20.0 25.0 30.0
Urban Rural Total
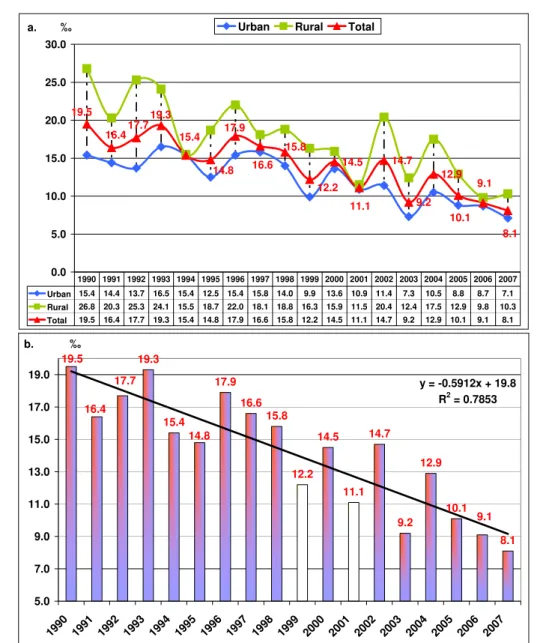
Urban 15.4 14.4 13.7 16.5 15.4 12.5 15.4 15.8 14.0 9.9 13.6 10.9 11.4 7.3 10.5 8.8 8.7 7.1 Rural 26.8 20.3 25.3 24.1 15.5 18.7 22.0 18.1 18.8 16.3 15.9 11.5 20.4 12.4 17.5 12.9 9.8 10.3 Total 19.5 16.4 17.7 19.3 15.4 14.8 17.9 16.6 15.8 12.2 14.5 11.1 14.7 9.2 12.9 10.1 9.1 8.1 1990 1991 1992 1993 1994 1995 1996 1997 1998 1999 2000 2001 2002 2003 2004 2005 2006 2007
‰ a.
19.3
15.4
17.9 16.6
15.8
12.2 14.5
11.1 14.7
9.2 12.9
10.1
8.1 16.4
14.8 19.5
17.7
9.1
y = -0.5912x + 19.8 R2 = 0.7853
5.0 7.0 9.0 11.0 13.0 15.0 17.0 19.0
1990 1991 1992 1993 1994 1995 1996 1997 1998 1999 2000 2001 2002 2003 2004 2005 2006 2007
‰ b.
Figure 1. (a) Infant mortality dynamics and (b) Infant mortality tendency in Cluj district between 1990-2007
8.8 8.3
8 8.8
8.8
9.3 9.5
8.4 8.6 8.7
8.9 9.6
9.8
8.8 9.2
10 12.4
10.5
7 8 9 10 11 12 13
Urban Rural Total
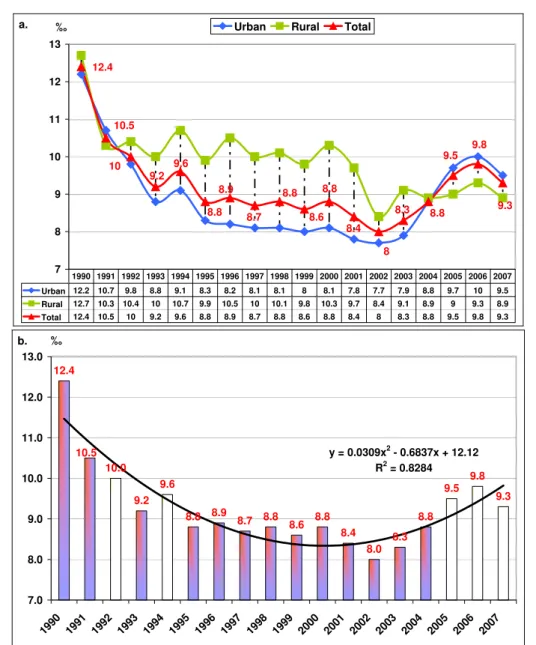
Urban 12.2 10.7 9.8 8.8 9.1 8.3 8.2 8.1 8.1 8 8.1 7.8 7.7 7.9 8.8 9.7 10 9.5 Rural 12.7 10.3 10.4 10 10.7 9.9 10.5 10 10.1 9.8 10.3 9.7 8.4 9.1 8.9 9 9.3 8.9 Total 12.4 10.5 10 9.2 9.6 8.8 8.9 8.7 8.8 8.6 8.8 8.4 8 8.3 8.8 9.5 9.8 9.3 1990 1991 1992 1993 1994 1995 1996 1997 1998 1999 2000 2001 2002 2003 2004 2005 2006 2007
‰ a.
12.4
10.0
9.2 9.6
8.8 8.9 8.7 8.8
8.6 8.8
8.4
8.0 8.3
8.8 9.5
9.8
9.3
10.5 y = 0.0309x2 - 0.6837x + 12.12
R2 = 0.8284
7.0 8.0 9.0 10.0 11.0 12.0 13.0
1990 1991 1992 1993 1994 1995 1996 1997 1998 1999 2000 2001 2002 2003 2004 2005 2006 2007
‰ b.
Figure 2. (a) Natality dynamics and (b) natality tendency in Cluj district between 1990-2007
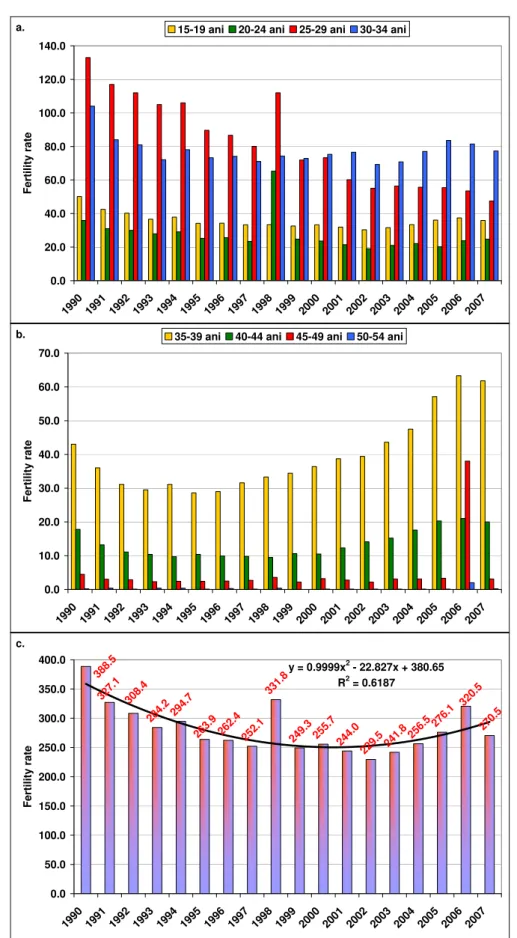
Reducing infant mortality is caused by several factors, one of them being female fertility, which was significant decrease in the period studied (Figure 3).
0.0 20.0 40.0 60.0 80.0 100.0 120.0 140.0
1990 1991 1992 1993 1994 1995 1996 1997 1998 1999 2000 2001 2002 2003 2004 2005 2006 2007
F
e
rtil
ity rate
15-19 ani 20-24 ani 25-29 ani 30-34 ani
a. 0.0 10.0 20.0 30.0 40.0 50.0 60.0 70.0
1990 1991 1992 1993 1994 1995 1996 1997 1998 1999 200 0 200 1 200 2 200 3
2004 2005 2006 2007
Fe rt ili ty rat e
35-39 ani 40-44 ani 45-49 ani 50-54 ani
b.
284.2 29 4.7 262. 4 252. 1 331. 8
249.3 255 .7
244. 0
229. 5
241.8 25 6.5 27
6.1 270. 5 327. 1 263.9 388.5
308.4 320
.5
y = 0.9999x2 - 22.827x + 380.65
R2 = 0.6187
0.0 50.0 100.0 150.0 200.0 250.0 300.0 350.0 400.0
1990 1991 1992 1993 1994 1995 1996 1997 1998 1999 2000 2001 2002 2003 2004 2005 2006 2007
Fe rt ili ty rat e c.
1.5
-2.3 -2.5 -2.9 -3.2
-3.7
-4.5 -3.3
-3.2
-10.0 -8.0 -6.0 -4.0 -2.0 0.0 2.0 4.0 6.0
-5.0 -4.0 -3.0 -2.0 -1.0 0.0 1.0 2.0
Urban Rural Total
1990 2000 2001 2002 2003 2004 2005 2006
a. ‰
-3.0 -2.1
-3.3
-3.8 -3.4
-3.3 -3.2 -3.3
-4.5 -3.7
-3.2 -2.
9 -2. -2.3 5 -2.0
1.5
-3.2 -0.6
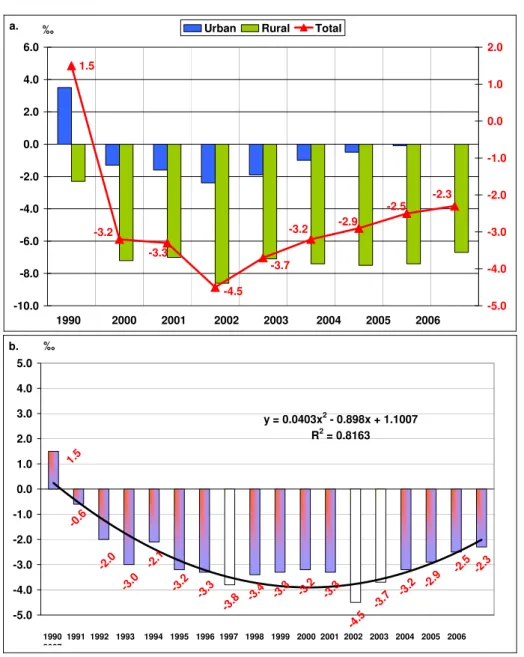
y = 0.0403x2 - 0.898x + 1.1007 R2 = 0.8163
-5.0 -4.0 -3.0 -2.0 -1.0 0.0 1.0 2.0 3.0 4.0 5.0
‰
1990 1991 1992 1993 1994 1995 1996 1997 1998 1999 2000 2001 2002 2003 2004 2005 2006 2007
b.
Figure 4. (a) Natural growth rate and (b) his tendency in Cluj districtbetween 1990-2007
2. Structure and causes of infant mortality in Cluj district between 1991-2007
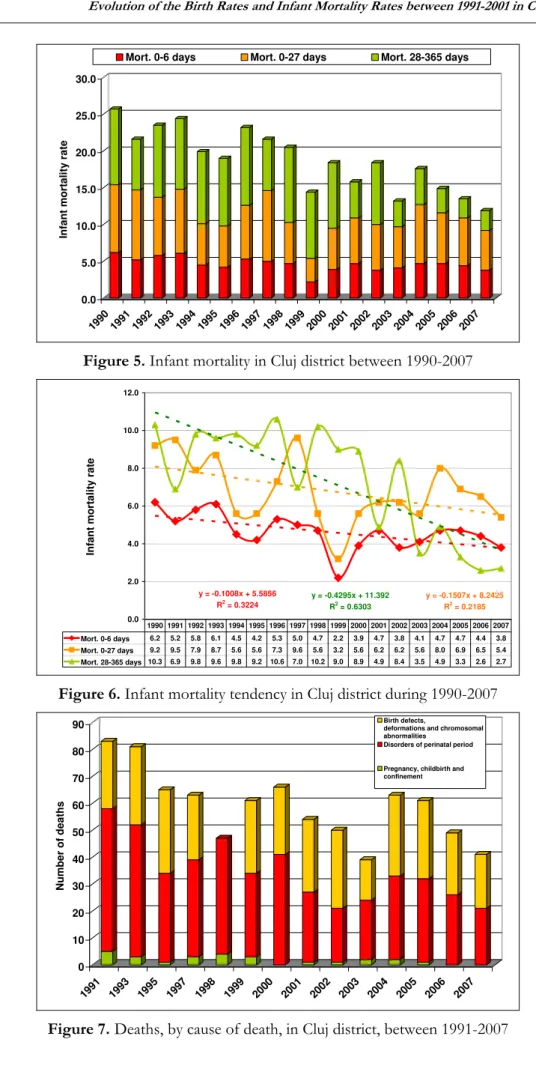
Infant mortality in Cluj district, depending on the time of death is shown in Figure 5.
The downward trend of infant mortality is more pronounced for post-neonatal mortality rate (28-365 days) comparing with early neonatal mortality and neonatal mortality (Figure 6).
Differences between neonatal mortality and post-neonatal mortality from Cluj district and the rest of Romania proved to be statistically significant (p = 0.01038). There was no statistically significant difference between the remaining types of infant mortality between the Cluj district and the rest of Romania (Table 1).
0.0 5.0 10.0 15.0 20.0 25.0 30.0 In fan t mo rt al ity rate
1990 1991 19921993 1994 1995 1996 1997 1998 1999 2000 2001 2002 2003 2004 2005 2006 2007
Mort. 0-6 days Mort. 0-27 days Mort. 28-365 days
Figure 5. Infant mortalityin Cluj districtbetween 1990-2007
y = -0.1008x + 5.5856 R2
= 0.3224
y = -0.4295x + 11.392 R2
= 0.6303
y = -0.1507x + 8.2425 R2 = 0.2185 0.0 2.0 4.0 6.0 8.0 10.0 12.0 In fa nt morta lity r a te
Mort. 0-6 days 6.2 5.2 5.8 6.1 4.5 4.2 5.3 5.0 4.7 2.2 3.9 4.7 3.8 4.1 4.7 4.7 4.4 3.8 Mort. 0-27 days 9.2 9.5 7.9 8.7 5.6 5.6 7.3 9.6 5.6 3.2 5.6 6.2 6.2 5.6 8.0 6.9 6.5 5.4 Mort. 28-365 days 10.3 6.9 9.8 9.6 9.8 9.2 10.6 7.0 10.2 9.0 8.9 4.9 8.4 3.5 4.9 3.3 2.6 2.7 1990 1991 1992 1993 1994 1995 1996 1997 1998 1999 2000 2001 2002 2003 2004 2005 2006 2007
Figure 6. Infant mortalitytendency in Cluj districtduring 1990-2007
0 10 20 30 40 50 60 70 80 90 N u mber of d eaths 199 1
1993 199 5
199 7
1998 199 9
200 0
2001 200 2
200 3
2004 200 5
200 6
2007
Birth defects,
deformations and chromosomal abnormalities
Disorders of perinatal period
Pregnancy, childbirth and confinement
Table 1. Relationship between different types of infant mortality in Cluj district in comparison with the rest of Romania
Deaths 0-1 an Region
Mortality 0-6 days Rest of deaths 0-1 year Total
Cluj district 183 268 451
Rest RO 8652 14725 23377
RO 8835 14993 23828
Alpha 0.05
df 1
Hi squared critical 3.84 p value 0.12046 Hi squared observed 2.41136
Deaths 0-1 an Region
Mortality 7-27 days Rest of deaths 0-1 year Total
Cluj district 89 362 451
Rest RO 4028 19349 23377
RO 4117 19711 23828
Alpha 0.05
df 1
Hi squared critical 3.84 p value 0.16367 Hi squared observed 1.93996
Deaths 0-1 an Region
Mortality 28-365 days Mortality 0-27 days Total
Cluj district 179 272 451
Rest RO 10697 12680 23377
RO 10876 12952 23828
Alpha 0.05
df 1
Hi squared critical 3.84
p value 0.01038 p < 0,05 Hi squared observed 6.56888
3. The main causes of death in infant mortality in Cluj district between 1991-2007
Among the leading causes of death of children up to 1 year of life during the years 1991-2007, the first place is occupied of states due to the perinatal period, followed by congenital anomalies, respiratory diseases, infectious and parasitic diseases, accidents and poisoning. In 2002 congenital anomalies exceeded the perinatal causes. Other major causes of death of children up to one year of life are respiratory diseases, especially pneumonia and acute respiratory viral infection (Table 2 and Figure 8).
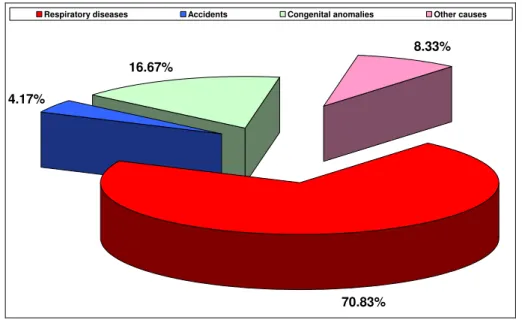
Deaths at home occupied a prominent place in infant mortality depending on the causes of death. The causes of home place mortality were: respiratory diseases, congenital malformations and other causes (Figure 9).
Table 2. Structure of 0-1 year deaths in Cluj district, according to leading causes of death
Causes of death 1991 1993 1995 1997 1999 2002 2003 2004 2005 2006 2007
Infectious and parasitic diseases 5 9 1 2 4 4 2 1 1 2 3
Respiratory diseases 18 21 16 20 16 18 13 15 5 6 8
Diseases of the digestive 10 6 2 6 0 2 0 0 1 1 0
Perinatal causes 53 49 33 36 30 20 22 31 31 26 21
Congenital anomalies 25 29 31 24 20 24 12 24 23 21 17
Accidents 6 4 5 4 2 4 2 2 1 1 1
Other causes 10 10 5 11 2 8 1 4 3 3 1
Total 127 128 93 103 74 80 52 77 65 60 51
38.68%
27.47% 3.08%
17.14% 3.74%
6.37% 3.52%
Infectious and parasitic diseases Respiratory diseases Diseases of the digestive Perinatal causes Congenital anomalies Accidents
Other causes
Figure 8. Structure of 0-1 year deaths in Cluj district (%), according to leading causes of death, between 1991-2007
70.83%
8.33% 16.67%
4.17%
Respiratory diseases Accidents Congenital anomalies Other causes
2.9 3.8
3.8
3.7 5.4
4 4.5
3
0 1 2 3 4 5 6 7 8 9
Urban Rural Total
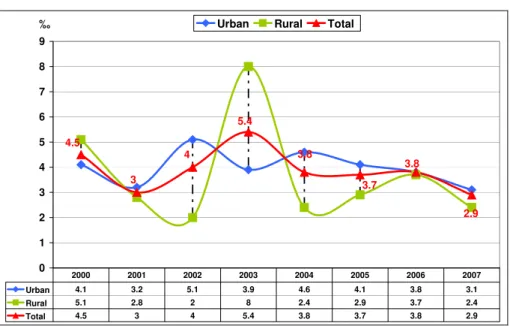
Urban 4.1 3.2 5.1 3.9 4.6 4.1 3.8 3.1 Rural 5.1 2.8 2 8 2.4 2.9 3.7 2.4 Total 4.5 3 4 5.4 3.8 3.7 3.8 2.9 2000 2001 2002 2003 2004 2005 2006 2007
‰
Figure 10. Fetal death rate depending on environment residence, in Cluj district, between 1990-2007
Between 1990-2007 the fetal death rate trend was in a continuously decreasing in Cluj district(Figure 11).In the urban areas the fetal death rates were higher than in rural areas.
6.1
4.5
5.3 5.5 5.9
3.9 4.5
3.0 4.0
5.4
3.8 3.7
2.9 6.0
4.1 6.2
5.8
3.8
y = -0.1556x + 6.1673 R2 = 0.5764
0.0 0.5 1.0 1.5 2.0 2.5 3.0 3.5 4.0 4.5 5.0 5.5 6.0 6.5
1990 199 1
1992 1993 1994 1995 1996 1997 1998 1999 2000 2001 2002 2003 200 4
2005 2006 2007
‰
Figure 11. Fetal death rate tendency depending on environment residence, in Cluj district, between 1990-2007
Discussion
birth rate of Romania and natural growth is also low. At the district level, the lowest value of 8 ‰ live births was registered in 2002. After that, the birth rate began to increase slightly to 9.8 ‰ in 2006. We can say that since 2002 the evolution of this indicator is positive.
The birth rate remained higher in rural areas, but with values declining from those of 2000. The analysis of infant mortality from 1990 to present indicates a decreasing trend. Despite the downward trend from 1990, the infant mortality rate in Romania is three times higher than the average EU countries and two times higher than in Eastern European countries [15]. The reducing of infant mortality rate is caused by several factors [13]. One of them is significant decrease in fertility.
Fertility rate in Cluj district shows the same downward trend as the country level, which has fallen below replacement level, reaching in 2007 to -27.8 ‰ in women of childbearing age (15-49 years). To properly express women fertility we have to mention the abortion evolution which had an upward trend. Although women can avoid an unwanted pregnancy many women still use abortion and their number exceeded that of live births
Pregnancy in the multipara women ends more often with child death by 1 year of life. In addition, decreased number of pregnancies and births contribute to a better quality of nutrition of mothers and children in those families, to increase resources allocated to each new-born increases the chances of survival [7].
Since 1990 to present the infant mortality rate had a downward trend, except for peaks in 1993 (19.3 ‰), 1996 (17.9 ‰), 2002 (14.7 ‰) (probably by improving the methodology reporting) and 2004 (12.9 ‰), so that in 2007 the infant mortality rate reached 8.1 ‰.
Analysis of infant mortality by causes of death between 1991-2007 showed a decrease in deaths due to respiratory disease, perinatal pathology and infectious and parasitic diseases. It remains constant at the high rate death due to congenital anomalies.
Most children under 1 year died at the age of one month (25.9%) and almost half of children died before reaching 3 months. Experts explain this by the fact that in the current system of registration of such events there is a greater degree of under-reporting of neonatal deaths [8]. Thus, the official rates of recent years shows that neonatal mortality represented 60% of the infant mortality, referring to the death of children until the age of one year.
In early ages untreated infectious pathology, respiratory pathology or digestive pathology can lead to death (bronchiolitis, acute diarrhealdiseases - acute diarrhea syndrome). We emphasize that these diseases belong to the category where the current therapeutic arsenal is fully effective(the rate of healing tends to 100%).
By age group (0-6 days, 0-27 days and 28 days and over) is observed the decrease of early neonatal mortality, neonatal mortality and of the post neonatal mortality.
We can therefore say that the downward trend of infant mortality in all age subgroups in Cluj district does not correspond with the tendency in the country where oscillations occur from one year to another.
Early infant mortality is the most yielding component of infant mortality through the quality of health care. In the EU this type of infant mortality decreased by 70% during 1980-2004. In Romania, this indicator was still showing an oscillating trend showing once again the inefficiency of health services, especially those relating to maternal and child care. Evolution can be explained in part by the fact that many child deaths under 1 year occur outside health care.
We distinguish the early neonatal mortality rate (0-6 days) from 4.7‰ to 3.8‰ and the neonatal mortality rate (0-27 days) from 6.2 ‰ to 5.4 ‰ with a peak of 8, 0 ‰ in 2004.
Early neonatal mortality rate (recorded from 1000 g) had a fluctuating dynamic since 2001, with variations from 4.7 ‰ to 3.8 ‰. Peaks of this indicator were recorded in 2001, 2004 and 2005 (4.7 ‰). This indicator decreased since 2006 and reached 3.8 ‰ in 2007. Neonatal mortality rate has a similar dynamic with early neonatal mortality, showing a decreasing trend (from 6.2 ‰ in 2001 to 5.4 ‰ in 2007).
Among the main causes of early neonatal mortality during the years 2001-2007, infections and congenital anomalies had the first two places. The causes of death can be arranged in the following decreasing order: maternal-fetal infection, obstetric trauma, fetal distress and asphyxia of the newborn, birth and respiratory distress syndrome. In the evolution of infant mortality depending on the causes of death between 1991-2007 was estimated a decrease in deaths from respiratory disease from 4.7 ‰ to 2.8 ‰, the pathology of perinatal mortality from 5.9 ‰ to 4.28 ‰, infectious and parasitic diseases from 1.6 ‰ to 1.0 ‰. It remains high at constant level congenital malformations death rate: 4.6 ‰.
Respiratory illness at age 0-1 year is consistently one of the leading causes of deaths of children [9, 10]. Child deaths due to respiratory diseases had a downward trend from 18.0 ‰ in 2002 to 8.0 ‰ in 2007. Such a situation can have many reasons, one of which may be the low level of care during post neonatal period. Deaths from respiratory and infectious diseases are caused by poverty, poor living conditions and low levels of education and information to parents [16] .
Analysis of perinatal mortality rate dynamics (stillbirths and deaths in the first 6 days of life) indicates an almost constant dynamic indicator (recorded from more than 1000 g weight) with annual limits ranging 1-1.5 / 1000 [12] .
Regarding infant mortality dynamics in Cluj district, rural values remain higher than those in urban areas because of deficiencies in the health network, as well as poor health education [14] .
It is noted that there are large differences between the percentages of male children which are deceased, and the percentages of feminine children which are deceased. In official statistics, from the total infant deaths, the proportion of male children which are deceased does not exceed by more than 5% female children which are deceased (Yearbook of Health Statistics)
The structure of infant mortality by place of death in the years 2003-2007 is 7.9% deaths at home (24 children). The home place mortality scale by causes is: first place - respiratory diseases (17 cases), second place - congenital malformations (4 cases) and third place - accidents and other causes (3 cases).
Infant mortality presents some features that lead to the conclusion that there is a large and under-exploited potential, to reduce this phenomenon:
Remains a very high proportion of deaths from respiratory diseases (18.0% for 2002). Deaths from this category are considered avoidable in developed countries.
Half of the deaths recorded in the first year of life are after the first month of life (in post neonatal period), which represents a value 2-3 times greater than that in other European countries.
In socially disadvantaged children and in rural areas children there are high infant deaths rates. Considering the whole Cluj district and a longer period of time, fetal death rate trend was decreasing, from 6.2 ‰ in 1990 to 2.9 ‰ in 2007. Highest fetal death rates were recorded in the 1990s (6.2 ‰), 1993 (6.1 ‰), 1998 (5.9 ‰) and 2003 (5.4 ‰).
To work towards reducing child mortality, it is necessary to assess accurately the factors that determine or influence it, followed by identifying and implementing the most effective solutions to minimize the effect of the factors identified [18]. In this regard, systematic studies are needed to be developed with intervention programs and to be implemented through synergistic interdisciplinary cooperation.
2. Infant mortality is obviously decreasing, but its value remains among the highest in Europe. 3. In recent years, Romania has made a significant progress in reducing child mortality, but still
has the highest infant mortality rates between countries and EU candidate countries.
4. There is a very high proportion of deaths from respiratory diseases. These deaths are considered avoidable, in developed countries.
5. Half of deaths under one year are recorded in the first month of life, representing a value of 2-3 times higher than that in other European countries.
6. In Romania early neonatal mortality rate (official data) recorded the lowest percentage, compared with European countries. The data collected through epidemiological studies or case studies shows that this situation is because in many maternity rules are not respected definitions for "live newborn" and " stillborn ", which can lead to under-assess the real level of neonatal mortality and infant mortality in Romania.
7. Still, there is a high proportion of deaths at home.
8. There are higher rates of infant deaths (particularly at home) in socially disadvantaged children and in children from rural areas compared with the national average.
9. There is significant potential, still unexploited, to reduce infant mortality rates in Romania.
References
1. *** - OpenEpi v. 2.3, Open Source Epidemiologic Statistics for Public Health. http://www.openepi.com/Menu/OpenEpiMenu.htm
2. *** - Analiza mortalităţii infantile în perioada 1 ianuarie-31 august 1995. Mortalitatea 1-4 ani.
Ministerul Sănătăţii, Direcţia Ocrotirii Mamei şi Copilului, UNICEF, Centrul de Calcul, Statistică Sanitară şi Documentare Medicală, Bucureşti, 1995.
3. *** - Ancheta bugetelor de familie, Institutul Naţional de Statistică Bucureşti, 2001.
4. *** - Anuar de Statistică Sanitară. Ministerul Sănătăţii, Centrul de Calcul, Statistică Sanitară şi
Documentare Medicală, Bucureşti, 2003.
5. *** - Anuar de Statistică Sanitară. Ministerul Sănătăţii, Centrul de Calcul, Statistică Sanitară şi
Documentare Medicală, Bucureşti, 2004.
6. *** - Anuarul demografic al României, Institutul Naţional de Statistică Bucureşti, 2001.
7. *** - IOMC-UNICEF: Programul Naţional de Supraveghere Nutriţională 1993-2000., Editura
MarLink, Bucureşti, 2002.
8. *** - Ordinul Nr. 791/17.11.1999 pentru aprobarea „Metodologiei privind raportarea şi analiza
profesională a cauzelor deceselor perinatale 0-1 an şi 1-4 ani precum şi a indicatorilor mortalităţii perinatale, infantile şi 1-4 ani”. Ministerul Sănătăţii, Bucureşti, 1999.
9. *** - Mortalitatea infantilă şi maternă în România şi în lume. Ministerul Sănătăţii, Centrul de
Calcul, Statistică Sanitară şi Documentare Medicală, Bucureşti, 1995.
10. *** - Mortalitatea primei copilării în România. Ministerul Sănătăţii, Centrul de Calcul, Statistică
Sanitară şi Documentare Medicală, 2003.
11. *** - Studiul Sănătăţii Reproducerii în România 1999. ARSPMS, CDC Atlanta, Georgia, 2001.
12. *** - Mortalitatea primei copilării în România. Ministerul Sănătăţii, Centrul de Calcul, Statistică Sanitară şi Documentare Medicală, 2003.
13. *** - Nou-născutul – studiu diacronic. În: ***: Albumul document „Rainer”. Centrul de Cercetări Antropologice al Academiei Române. Editura Anastasia, 2000.
14. *** - Particularităţi ale evoluţiei demografice a populaţiei în mediul urban şi rural în perioada 1990-1995. Comisia Naţională pentru Statistică, 1995.
15. *** - Studiul Sănătăţii Reproducerii în România 1999. ARSPMS, CDC Atlanta, Georgia, 2001. 16. Glavce C., Dragomirescu L., Valentin C., Apăvăloae L. – L’Evolution du poids a la naissance
17. Ionescu T, Ursuleanu D, Ursuleanu I. Starea de sănătate de la naştere până la vârsta de 1 an. Posibile legături cu unele boli cronice la vârsta adultă. Bucureşti, Ministerul Sănătăţii, Centrul de Statistică Sanitară şi Documentare Medicală. 2004.