www.atmos-chem-phys.net/9/3947/2009/ © Author(s) 2009. This work is distributed under the Creative Commons Attribution 3.0 License.
Chemistry
and Physics
Equatorial total column of nitrous oxide as measured by IASI on
MetOp-A: implications for transport processes
P. Ricaud1, J.-L. Atti´e1,2, H. Teyss`edre2, L. El Amraoui2, V.-H. Peuch2, M. Matricardi3, and P. Schluessel4
1Universit´e de Toulouse, Laboratoire d’A´erologie, CNRS UMR 5560, Toulouse, France 2CNRM-GAME, M´et´eo-France and CNRS URA 1357, Toulouse, France
3ECMWF, Shinfield Park, Reading, Berkshire, RG2 9AX, UK
4Department of Programme Development, EUMETSAT, Am Kavalleriesand 31, 64295 Darmstadt, Germany
Received: 31 October 2008 – Published in Atmos. Chem. Phys. Discuss.: 30 January 2009 Revised: 5 May 2009 – Accepted: 2 June 2009 – Published: 17 June 2009
Abstract. In this paper we use the total columns of nitrous oxide (N2O) as retrieved from the radiance spectra as
mea-sured by the Infrared Atmospheric Sounding Interferometer (IASI) instrument aboard the MetOp-A platform and dis-tributed by the European Organisation for the Exploitation of Meteorological Satellites (EUMETSAT) during the March– May (MAM) 2008 period. Since the total column of N2O
reflects concentrations in the middle troposphere, cloud-free columnar N2O measurements are used to assess transport
processes in the equatorial band (10◦S–10◦N). We com-pare the measured data set with the outputs produced by the 3-D chemical-transport model MOCAGE during the period MAM 2002–2004. To reflect MAM 2008 concentrations, MOCAGE results have been scaled by a factor 1.0125 in or-der to represent the change in concentration of N2O since
2004. IASI N2O equatorial measurements show a maximum
over Africa (4.96×10⁻³kg m−2)and a minimum over South America (4.86×10⁻³kg m−2)in reasonable agreement with the outputs from MOCAGE despite the fact that emissions of N2O are more intense over America than over Africa. The
amplitude of the longitudinal variation of total column N2O
along the equatorial band is twice as intense in the measure-ments (∼1.6%) than as in the model calculations (∼0.8%), and much greater than the IASI mean random error (0.16– 0.33%). A difference between the two data sets is observed above the Western Pacific (110◦E–150◦E) with a marked minimum in IASI compared to MOCAGE. Recent theoret-ical studies (Ricaud et al., 2007 and 2009) have shown the potentially important effect of the Walker and the Hadley
Correspondence to:P. Ricaud ([email protected])
cells on the tropospheric distribution of N2O in producing
a local maximum in N2O above Africa. Based on equatorial
total columns of N2O retrieved from IASI, our results are
consistent with the fact that Africa is a zone of convergence of airmasses coming from different convective regions whilst Western Pacific behaves more like a divergence zone.
1 Introduction
Based upon satellite-borne measurements and three-dimensional chemical transport models (3-D CTMs), recent studies (Ricaud et al., 2007 and 2009) have shown that long-lived species such as nitrous oxide (N2O) can be considered
as an excellent tracer to diagnose transport processes in the stratosphere down to the upper troposphere-lower strato-sphere within the equatorial band 10◦S–10◦N. The annual, semi-annual and quasi-biennial oscillations were analyzed in the stratospheric N2O measured and modelled fields and
found to be in agreement with results from previous studies. More interestingly, the behaviour of the measured equatorial N2O fields in the Tropical Tropopause Layer (TTL) shows
longitudinal inhomogeneities with pronounced maxima in May over the African continent and minima over the Western Pacific area up to the 400-K isentropic level, namely in the lower stratosphere. These inhomogenities in the longitudinal distribution of N2O were calculated by the Mod`ele de
Chimie Atmosph´erique `a Grande Echelle (MOCAGE) 3-D CTM in the middle troposphere (340-K isentropic level, ∼11 km) over the year, and maxima of N2O over Africa
3948 P. Ricaud et al.: IASI equatorial total column of N2O
N2O maximum in May over Africa in the lower stratosphere
was attributed to intense meso-scale convective systems, e.g. overshootings, that can reach the lower stratosphere and that are not included in the MOCAGE CTM, and weak horizontal mixing.
Sources of N2O are located primarily in the
tropo-sphere (e.g. soils, wetlands, biomass burning, industrial ex-hausts) except for an auroral source in the upper atmo-sphere (Semeniuk et al., 2008), and sinks are essentially through photolysis and reaction with electronically-excited oxygen atoms O(1D) in the stratosphere (e.g. Brasseur et al., 1999). Nitrous oxide is the major source of nitrogen oxides (NOx=NO+NO2) which are important in controlling the
dis-tribution of both tropospheric and stratospheric ozone. Its photochemical lifetime can reach about a century in the tro-posphere. The present study intends to give experimental ev-idence for the longitudinal inhomogeneity in the tropospheric N2O field around the equatorial band (10◦S–10◦N) as
calcu-lated by MOCAGE.
Tropospheric nitrous oxide is mainly measured by ground-based instruments but also by satellite-borne instru-ments. Advanced Global Atmospheric Gases Experiment (AGAGE), and its predecessors (the Atmospheric Life Ex-periment, ALE, and the Global Atmospheric Gases Experi-ment, GAGE) have been measuring the composition of the global atmosphere continuously since 1978, including sur-face N2O using a highly improved gas chromatograph
mul-tidetector system (Prinn et al., 2000). The World Data Cen-tre for Greenhouse Gases (WDCGG) was established under the Global Atmosphere Watch (GAW) programme to collect, archive and provide data for greenhouse (CO2, CH4, CFCs,
N2O, etc.) and related gases (CO, NOx, SO2, VOCs, etc.)
and surface ozone in the atmosphere and ocean, measured under GAW and other programmes, including AGAGE. Re-mote Fourier transform infrared (FTIR) measurements of total column N2O are regularly performed within the
Net-work for the Detection of Atmospheric Composition Change (NDACC), e.g. at Jungfraujoch (Switzerland) (Zander et al., 2005). Tropospheric concentrations of nitrous oxide have also been measured and annual and seasonal variations have been analyzed from observations of the National Oceanic and Atmospheric Administration (NOAA) polar meteorolog-ical satellite series (Ch´edin et al., 2002). Finally, vertmeteorolog-ically- vertically-resolved profiles of tropospheric N2O can also been
esti-mated from nadir-viewing infrared spectrometers (Lubrano et al., 2004) such as the Interferometric Monitoring of Green-house Gases (IMG) instrument aboard the Advanced Earth Observing Satellite (ADEOS).
For the present study, we have used the opportunity pre-sented by the 2006 launch of the MetOp-A satellite that contains the Infrared Atmospheric Sounding Interferometer (IASI) which measures many atmospheric constituents such as H2O, O3, CO2, N2O, CH4, CFCs, CO, etc. We
particu-larly focussed on the March-April-May (MAM) 2008 period by making use of the pre-operational, non-validated total
col-umn measurements of N2O distributed by the European
Or-ganisation for the Exploitation of Meteorological Satellites (EUMETSAT).
The IASI instrument and the selection of measured N2O
total columns (wavelengths, Jacobian, selection flags and re-trieval method) will be presented in Sect. 2, together with the MOCAGE model. Surface N2O measurements used to
rescale MOCAGE outputs to the MAM 2008 period in order to take into account the positive linear trend in N2O will be
detailed in Sect. 3. The N2O fields measured by IASI and
calculated by MOCAGE and the comparisons will then be discussed. Finally, conclusions will be presented in Sect. 4.
2 Measured and modelled data sets 2.1 IASI
The MetOp-A platform has been launched on 19 October 2006. It carries a set of eight instruments, including the Infrared Atmospheric Sounding Interferometer (IASI), that potentially offer improved remote sensing capabilities for both meteorology and climatology. MetOp-A flies in a sun-synchronous polar orbit at a mean altitude of∼815 km. The orbit is inclined 98.7◦to the Equator and crosses the Equator (descending node) at 09:30 mean local solar time. The time for one orbit is 101 min with a repeat cycle of 29 days. The expected lifetime is 5 years.
The IASI instrument is a high resolution infrared sounder that has been designed for the measurement of improved meteorological parameters for Numerical Weather Predic-tion (NWP) and climate models. Among its primary objec-tives there is the estimation and monitoring of trace gases like ozone, methane and carbon monoxide on a global scale (see e.g. Clerbaux et al., 2007; Phulpin et al., 2007 and http: //smsc.cnes.fr/IASI). IASI is an accurately calibrated Fourier Transform Spectrometer (FTS) whose design is based on a classical Michelson interferometer. IASI covers the spectral range from 3.6µm (2760 cm−1)to 15.5µm (645 cm−1)with a spectral resolution between 0.35 and 0.5 cm−1. To achieve global coverage, the IASI instrument observes the Earth with a cross-track swath angle of±48.3◦ (∼2200 km). The in-strument field of view consists of four circular pixels of 0.8◦ angular diameter, which corresponds to 12 km on the Earth at nadir.
Within the spectral domain covered by IASI, a number of atmospheric constituents can be measured including H2O,
O3, CO2, N2O, CH4, and CO. IR N2O spectral signature
can be seen in two IASI spectral regions: 1200–1350 cm−1 (ν1band centred at 1284.91 cm−1)and 2150–2250 cm−1(ν3
band centred at 2223.76 cm−1). The retrieval algorithm for N2O is a feed-forward artificial neural network (ANN)
Fig. 1. (Top) Spectra measured by IASI (solid line) over the tropical Pacific Ocean at (158.35◦E, 1.41◦N) on 30 December 2007 in the 2150–2250 cm−1region (N2Oν3band) and as estimated by the RTIASI-5.3 forward model using atmospheric composition given by the
retrieved state vectors (red line). (Bottom) Residuals, i.e. difference between the measured and the estimated spectra.
2200.75 and 2243.25 cm−1, and three micro-window
chan-nels at 2136.25, 2142.75, and 2150.00 cm−1, providing a
“baseline” in the water-vapour absorption continuum. Ad-ditionally, the inclusion of four lines from theν1 band
be-tween 1278.75 and 1291.50 cm−1, carefully chosen to avoid the CH4 fundamentals, proved to be advantageous in the
training of the network. Surface temperature and a coarse temperature profile, as derived from an Empirical Orthogo-nal Function (EOF) regression retrieval, enter the network as additional information. The temperature profile is derived as-suming a constant CO2concentration. IASI does not provide
true vertical N2O columns, as the sensitivity of the
measure-ments is not homogeneous over the vertical profile. Usually, an averaging kernel is applied in the vertical integration of the retrieved profile (e.g. Rodgers and Connor, 2003). Here, the relation between the true vertical columns and the inte-grated profile applying the averaging kernel is implicit in the retrieval scheme and only represented statistically.
The retrieval method is embedded in the operational IASI Level 2 product processing facility at EUMETSAT (EUMET-SAT, 2004; Schl¨ussel et al., 2005). The estimated accuracy of the N2O is about 4% and the estimated precision is of the
order of 20%. As for the accuracy, the value of 4% refers to the retrieved values from a synthetic data set (spectra calcu-lated via radiative transfer simulations and instrument noise characteristics from assumed atmospheric states) and does not account for errors in the radiative transfer (RT) simula-tions (e.g. neglecting of Non-Local Thermodynamic Equi-librium (NLTE) effects, errors in spectroscopy, and errors due to truncated RT modelling). The true accuracy cannot be stated without reference to independent means of com-parison, which are not available so far. Consequently, in
the present study, we consider a random Gaussian error of ∼20% associated to each single pixel of retrieved total col-umn of N2O whilst a systematic bias of 4% cannot be ruled
out. Only pixels with a surface pressure greater than 938 hPa are considered in the retrieval process.
An example of a typical IASI spectrum in the 2150– 2250 cm−1 spectral region (N2O band) is shown in Fig. 1.
The spectrum was measured on 31 December 2007 during a daytime overpass over the tropical Pacific Ocean (1.41◦N, 158.35◦E) at a viewing angle of 48◦. Superimposed on the measured spectrum is the spectrum estimated by the RTIASI-5.3 forward model (Matricardi, 2003 and 2004). For the RTIASI-5.3 simulations, we used atmospheric composition state vectors from the ANN (CO, N2O, O3, CO2and CH4)
and from an Empirical Orthogonal Function (EOF) regres-sion and subsequent iterative retrievals (surface temperature, H2O and temperature). In the spectral region depicted in
Fig. 1, the main absorbers are CO, N2O and CO2. CO
pre-dominates between 2150 and 2180 cm−1, N
2O between 2180
and 2240 cm−1 whereas CO
2 predominates between 2240
and 2250 cm−1.
For most of the channels with wavenumbers less than 2240 cm−1, the residuals (difference between the measured
and estimated spectra) are typically smaller than 2 K (0.6%) suggesting that the atmospheric state vectors retrieved by the ANN have a good accuracy. NLTE effects are not accounted for in the RTIASI-5.3. Although they may have an impact at 2240 cm−1up to 2250 cm−1(CO2bands) where the
3950 P. Ricaud et al.: IASI equatorial total column of N2O
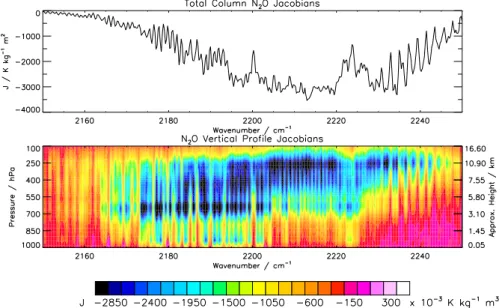
Fig. 2. Jacobians of the total column of N2O (top) and of the vertical profiles of N2O (bottom), consistent with the estimated spectrum in
the 2150–2250 cm−1region (N2Oν3band) shown in Fig. 1. Note that the tropopause pressure is about 93 hPa (∼17 km) at this particular
location and time.
Fig. 3.Time evolution in the 10◦S–10◦N equatorial band of the N2O surface data (crosses) from different stations (Cape Kumukahi (pink),
Cape Ferguson (red), Tutuila (orange), Ragged Point (yellow), Mauna Loa GMD (green), Mauna Loa CSIRO (light blue) and Cape Matatula (dark blue)) in the 20◦S–20◦N latitudinal band from 1977 to 2007 and its estimated linear trend (thick blue line), and as calculated by MOCAGE at 100 hPa (thick solid line) in 2000–2005.
region dominated by CO (namely below 2180 cm−1), the
larger residuals are seen in correspondence of strong CO lines. Consequently, the residuals could be affected by the specification of the CO profile and by errors in the specifica-tion of the CO line parameters.
The Jacobians relative to the total columns of N2O
(quan-tity actually retrieved by the ANN) and relative to the verti-cal profile of N2O (for information only) are shown in Fig. 2.
They basically show the sensitivity of the N2O amounts
Fig. 4.From top to bottom. Number of total column N2O IASI measurement pixels per 5◦×5◦bin used in the present analysis considering
the MAM 2008 period. Total column N2O fields as measured by IASI in MAM 2008 and as calculated by MOCAGE rescaled by a factor 1.0125 in MAM 2002–2004. MOCAGE daily averaged N2O emissions. Superimposed on each figure is the 236 W m−2isocontour (thick
solid line) of the OLR from the NOAA/AVHRR in MAM 2002–2004.
the region 2150–2250 cm−1. The maximum of sensitivity in the total column of N2O is indeed ranging over 2165–
2245 cm−1 peaking in the 2190–2240 cm−1 interval.
Con-sidering the vertical distribution of N2O, the Jacobians are
mainly peaking in the 750–200 hPa range (approximately 3– 11 km altitude range) with some sensitivity down to 1000 hPa (around the surface) in the range 2175–2205 cm−1 and up to 100 hPa (∼17 km) in the range 2205–2220 cm−1. Conse-quently, since N2O is well mixed in the troposphere to within
5% (the mixing ratio is about 320 ppbv in the troposphere and decreases with altitude in the stratosphere), the total column of N2O is essentially sensitive to the tropospheric content.
In addition, it might also be possible to retrieve vertically-resolved profiles of N2O within the entire troposphere.
The N2O total columns provided by EUMETSAT for the
3952 P. Ricaud et al.: IASI equatorial total column of N2O
Fig. 5.(Top) Longitudinal distribution of total column N2O in the equatorial band (10◦S–10◦N) as measured by IASI in MAM 2008 (thick
black line), and as calculated by MOCAGE rescaled by a factor 1.0125 in MAM 2002–2004. Vertical bars represent the mean random error on the total column of N2O averaged within 10◦S–10◦N and 5◦in longitude considering a 20% error on a single pixel. (Center) Longitudinal
distribution of OLR in MAM 2002–2004 in the equatorial band (10◦S–10◦N). (Bottom) Longitudinal distribution of N2O emissions used in MOCAGE in the equatorial band (10◦S–10◦N) at: 00:00 UT (blue), 06:00 UT (green), 12:00 UT (yellow), 18:00 UT (red), and averaged over 24 h (black).
corresponds to an average of 500–5000 points per bin in the equatorial band ranging 10◦S–10◦N (see Fig. 4). Note that
during the period 16–26 March 2008, no L2 N2O data are
available. Since in this study we considered a Gaussian dis-tribution of the retrieval random error of 20% on each indi-vidual N2O total column, the mean random error associated
to the N2O total column within one 5◦×5◦bin in the tropics
is much better than 1% over the MAM 2008 period.
2.2 MOCAGE
MOCAGE-Climat (Teyss`edre et al., 2007) is the cli-mate version of M´et´eo-France’s tropospheric-stratospheric MOCAGE 3-D CTM. The climate version used in this study has 60 layers from the surface up to 0.07 hPa, with a hor-izontal resolution of 5.6◦×5.6◦. ECMWF 6-hourly analy-ses were used to force the model from 1 January 2000 to 31 December 2005. MOCAGE uses a semi-Lagrangian advec-tion scheme and vertical velocities are recalculated from the forcing analyses by solving continuity equation.
MOCAGE-Climat contains a detailed tropospheric-stratospheric chem-istry scheme. Initial chemical conditions were taken from a previous simulation to allow the model to quickly reach its numerical equilibrium, especially for long-lived species, such as N2O. Surface emissions prescribed in
MOCAGE-Climat are based upon yearly- or monthly-averaged clima-tologies. The N2O surface emissions are taken from the
Global Emissions Inventory Activity and are climatologies representative of the year 1990 (Bouwman et al., 1995). They include anthropogenic and biogenic sources, for a total emis-sion rate of 14.7 Tg(N) yr−1. Note that regarding convection, the present run was performed using the scheme of Betchold et al. (2001). For more information, the reader should consult Ricaud et al. (2007). In the present study, we have considered the March–May 2002–2004 period in order to be consistent with the previous analyses (Ricaud et al., 2007 and 2009). The total column of N2O has been calculated considering a
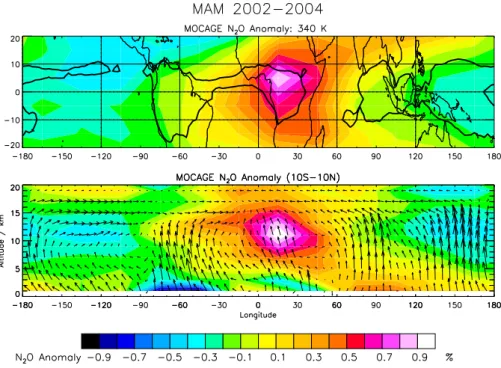
Fig. 6. (Top) N2O anomaly (relative difference between N2O and its zonal mean, %) calculated by MOCAGE along the 340-K isentropic
surface (∼11 km) in MAM 2002–2004. Superimposed is the 236 W m−2isocontour (thick solid line) of the OLR from the NOAA/AVHRR in MAM 2002–2004. (Bottom) Altitude-longitude cross-section of N2O anomaly calculated by MOCAGE over the period MAM 2002–2004
in the 10◦S–10◦N latitude band. Superimposed are the wind direction and speed where the vertical component is amplified by a factor 100.
3 Results and discussion 3.1 Surface data
MOCAGE uses yearly-averaged N2O emission inventories.
Consequently, except for diurnal variations in the emis-sion rates, there is no monthly variability or trends in the MOCAGE N2O data. The 2002–2004 model outputs need
to be adjusted towards the 2008 values according to the pos-itive linear trends measured from the ground-based stations located in the tropics and reported in WMO (2006). We have actually used N2O measurements from WDCGG stations
lo-cated within a latitude band wider than 10◦S–10◦N, namely 20◦S–20◦N, since there are no stations where N2O is
avail-able within 10◦S-10◦N. We have used data for the follow-ing sites and time periods: Mauna Loa (USA, 19◦32′N, 155◦35′W, 1977–2006) including two instruments from the Global Monitoring Division (GMD) and the Commonwealth Scientific and Industrial Research Organisation (CSIRO), Cape Kumukahi (USA, 19◦31′N, 154◦49′W, 1996–2004), Ragged Point (Barbados, 13◦10′N, 59◦26′W, 1978–2005), Cape Matatula (USA, 14◦15′S, 170◦34′W, 1978–2005), Tu-tuila (USA, 14◦15′S, 170◦34′W, 1977–2006), and Cape Fer-guson (Australia, 19◦17′S, 147◦03′E, 1992–2005).
Figure 3 shows the temporal evolution of N2O as
mea-sured at the surface from the different stations listed above, the linear trends estimated from these ground-based
mea-surements from 1977 to 2005 together with the amount of N2O as calculated by MOCAGE at 100 hPa over the 2000–
2005 period. First of all, an evaluation of the N2O linear
trend from this surface data set over the period 1977–2005 gives∼0.75 ppbv yr−1. This equatorial rate of change is very consistent with the figures published in WMO (2006) giving 0.74±0.02 ppbv yr−1for 1986–2005. The averaged amount
of N2O estimated during the 2002–2004 period (namely
∼317 ppbv at 100 hPa) needs to be increased by about 4 ppbv to be consistent with the amount of N2O in 2008.
Conse-quently, this corresponds to an increase of 1.25% over 5 years consistent with the relative trends (0.24% yr−1)published in WMO (2006). The scaling factor of 1.0125 has thus been ap-plied to the total column of N2O calculated by MOCAGE in
2002–2004 in order to be consistent with the total columns of N2O in 2008.
3.2 Equatorial tropospheric N2O
The tropical distributions of the total column of N2O as
3954 P. Ricaud et al.: IASI equatorial total column of N2O
strong convective systems. They are essentially confined over South America, Central Africa, Indonesia and Western Pacific with a fine tongue between Equator and 10◦N
cor-responding to the Inter Tropical Convergence Zone. Within the convective systems, the average number of pixels is rang-ing 500-1000 whilst outside, the number of pixels is much greater than 2000. This is indeed induced by the presence of clouds within the convection zones limiting the use of cloud-free pixels. Nevertheless, even within convective systems, and considering an individual random error of 20% on a sin-gle pixel, the precision on the total column of N2O averaged
within 5◦×5◦pixel is much better than 1%.
Considering first the IASI N2O distribution, the
N2O column in the Equatorial band (10◦S–10◦N)
shows one strong maximum (∼4.95×10⁻³kg m−2)
over Central Africa and two strong minima over South America (∼4.85×10⁻³kg m−2) and Indonesia
(∼4.87×10⁻³kg m−2). This corresponds to a
∼2% longitudinal variation in the equatorial band. In the extra-equatorial bands (20◦S–10◦S and 10◦N–20◦N), the total amounts of IASI N2O are on average more intense
(4.93–4.96×10⁻³kg m−2) than in the Equatorial band (∼4.90×10⁻³kg m−2). If we now consider the N2O
field as calculated by MOCAGE in the Equatorial band (10◦S–10◦N), one can note that there is a broad maxi-mum over the African continent (∼4.93×10⁻³kg m−2) that is consistent with IASI and a local maximum over Indonesia (∼4.91×10⁻³kg m−2) that is in contradiction with IASI. Over the South American continent, MOCAGE calculates a local minimum in the Northern Hemisphere (∼4.86×10⁻³kg m−2)and a local maximum in the Southern
Hemisphere (∼4.91×10⁻³kg m−2) whilst in IASI there
is a strong minimum well confined in the convective area. The longitudinal variation of total column of N2O
calcu-lated by MOCAGE is weaker (∼1.4%) than measured by IASI (∼2%). The greatest discrepancy between IASI and MOCAGE is obviously found in the extra-equatorial band (20◦S–10◦S and 10◦N–20◦N). Indeed, MOCAGE system-atically shows a net minimum (<4.87×10⁻³kg m−2)in total column of N2O poleward to 15◦in both hemispheres whilst
in IASI there is a net maximum (>4.93×10⁻³kg m−2). Outside of the Equatorial belt (10◦S–10◦N), some large discrepancies between MOCAGE and IASI N2O fields are
depicted (e.g. over Sahara) that might be linked to inap-propriate surface emissivity values either used in the re-trieval process or actually retrieved by the scientific ground-segment. Indeed, the emissivity for that period was under-estimated by IASI in desert regions when compared to the emissivity derived from the space-borne Moderate Resolu-tion Imaging Spectroradiometer (MODIS) instrument (See-mann et al., 2008). Within the Equatorial belt, the N2O field
above Indonesia is more intense in MOCAGE compared to IASI. Indonesia is an active convective region whatever the season considered (warm pool area) but the model has some difficulties to reproduce this phenomenon over that particular
area. Indeed, for transport evaluation simulations, MOCAGE does produce a maximum of Radon 222 for instance, in the upper troposphere above America and Africa but a minimum above Indonesia, consistently with other CTM outputs (Jacob et al., 1997; Josse et al., 2004). Another source of discrep-ancy between IASI and MOCAGE might also be linked to the N2O sources used in MOCAGE that could differ
signifi-cantly from reality, and particularly in the Indonesian sector in 2008. And finally, since averaging kernels are not pro-vided by the ANN, this might also impact on comparisons between measured and modelled total columns of N2O.
The daily averaged N2O emission distribution
shows in the equatorial band one intense maximum (>250×10−12mole s−1) over South America, and two less intense maxima over Central Africa and Indonesia (∼175×10−12mole s−1). The three continental N
2O
max-ima are all well confined within deep convective systems. It is particularly interesting to note that despite the fact that the N2O emissions are the strongest above South America, the
maximum of total column of N2O is calculated above Africa
with a severe minimum above South America.
Figure 5 shows the longitudinal distributions of N2O in
the equatorial band 10◦S–10◦N from IASI in MAM 2008 and from MOCAGE in MAM 2002–2004 multiplied by the 1.0125 scale factor, together with the distribution of the OLR and the emissions of N2O from MOCAGE in MAM 2002–
2004. The mean random error on the total column of N2O
averaged within 10◦S–10◦N and 5◦in longitude is ranging from 0.16% to 0.33%. IASI and rescaled MOCAGE N2O
do obviously show the same longitudinal distributions with a maximum over Africa (4.93–4.96×10⁻³kg m−2)and a
min-imum over South America (4.85–4.88×10⁻³kg m−2). The
amplitude of the longitudinal variation of total column of N2O is∼1.6% for IASI and∼0.8% for MOCAGE, namely
much greater than the IASI precision of total column N2O
in each individual 5◦ bin within the 10◦S–10◦N equato-rial band. There are slight differences between the two data sets with extremes more intense in IASI compared to MOCAGE: one maximum above Africa (4.94×10⁻³kg m−2 for IASI and 4.92×10⁻³kg m−2 for MOCAGE) and one minimum over South America (4.87×10⁻³kg m−2for IASI and 4.89×10⁻³kg m−2for MOCAGE). However, the strong minimum above Indonesia (110◦E–150◦E) measured by IASI (4.88×10⁻³kg m−2) is not captured by MOCAGE (4.91×10⁻³kg m−2). The diurnal variation of N
2O
emis-sions is very weak (<1%) in MOCAGE with a strong maxi-mum above South America (∼300×10−12mole s−1)and two
less intense maxima above Africa (∼200×10−12mole s−1)
and Indonesia (∼120×10−12mole s−1), all of them confined in deep convective systems.
The effects of continental convective systems upon the tro-pospheric N2O are different above South America and above
Africa. Indeed, although the emission of N2O is calculated
intense over Africa than over South America. In fact, the amount of tropospheric N2O is calculated and measured to
be the greatest above Africa in the equatorial band. Fig-ure 6 shows the anomaly of N2O (%) relative to its equatorial
zonal average as calculated by MOCAGE in MAM 2002– 2004 in the tropics at 340-K isentropic level (∼11 km) and along the vertical in the equatorial band (10◦S–10◦N). In-deed, the anomaly reaches∼1% over Central Africa at 340 K and maximizes (>0.5%) between 7 and 15 km in the mid-dle troposphere.
Furthermore, our results are consistent with the theoreti-cal study by Ricaud et al. (2009) using MOCAGE that shows a net maximum in N2O above Africa in the middle
tropo-sphere along the 340-K isentropic surface for all seasons. The Walker cells (Fig. 6) are particularly well pronounced: 1) over Pacific (ascending branch over Western Pacific and de-scending branch westward from the American continent); 2) over Indian Ocean (ascending over Indonesia and descending eastward from the African continent); and, to a lesser extent, 3) over Atlantic Ocean. Consequently, due to the presence of the Hadley cells (ascending branch around the Equator and descending branch in the extra-tropics at 20◦–30◦latitudes in both hemispheres, see e.g. Barret et al., 2008) and the Walker cells, Africa is a zone of convergence of airmasses coming from different convective regions whilst Western Pacific be-haves more like a divergence zone.
4 Conclusions
Recent theoretical studies (Ricaud et al., 2007 and 2009) have shown the potentially important effect of Walker and Hadley cells on the tropospheric distribution of N2O, a
long-lived species with a lifetime of about 100 years, in the equa-torial band (10◦S–10◦N), by producing a local maximum above the African continent. In the present study, we are making use of the total columns of N2O as measured by the
IASI instrument aboard the MetOp-A platform and delivered by EUMETSAT during the March–May 2008 period. Since the total column of N2O is essentially weighted to sample the
middle troposphere, these cloud-free measurements are used to assess transport processes in the equatorial band (10◦S– 10◦N). We compared the measured data set with the outputs from the 3-D chemical-transport model MOCAGE during the period MAM 2002–2004 rescaled by a factor 1.0125 in or-der to represent the positive N2O linear trend until MAM
2008. IASI N2O equatorial measurements obviously show
a maximum over Africa (4.96×10⁻³kg m−2) and a
mini-mum over South America (4.86×10⁻³kg m−2)in reasonable agreement with the outputs from MOCAGE whilst emissions of N2O are more intense over America than over Africa.
A slight difference between the two data sets is observed above the Western Pacific (110◦E–150◦E) with a marked minimum in IASI compared to MOCAGE. The amplitude of the longitudinal variation of total column of N2O along
the equatorial band is twice as intense in IASI (∼1.6%) as in MOCAGE (∼0.8%) data sets, namely much greater than the IASI mean random error on the averaged total column N2O (0.16–0.33%). Our study is consistent with the fact that
Africa is a zone of convergence of airmasses coming from different convective regions whilst Western Pacific behaves more like a divergence zone.
Acknowledgements. IASI has been developed and built under the responsibility of the Centre National d’Etudes Spatiales (CNES, France). It is flown onboard the MetOp satellites as part of the EUMETSAT Polar System. The IASI L2 data are received through the EUMETCast near real time data distribution service. This project has been funded in France by the Centre National de la Recherche Scientifique/Institut National des Sciences de l’Univers (CNRS/INSU) and CNES, by the national programme Les Enveloppes Fluides et Environnement (LEFE) and by the European Commission (EC) through the Network of Excellence ACCENT TROPOSAT 2. IASI total column of nitrous oxide were extracted from the Ether French atmospheric database (http://ether.ipsl.jussieu.fr). Interpolated Outgoing Longwave Radiation data are provided by the NOAA-CIRES ESRL/PSD Climate Diagnostics branch, Boulder, Colorado, USA, from their Web site at http://www.cdc.noaa.gov/. WDCGG data were retrieved from http://gaw.kishou.go.jp/wdcgg/.
Edited by: T. Wagner
The publication of this article is financed by CNRS-INSU.
References
Barret, B., Ricaud, P., Mari, C., et al.: Study of the transport path-ways of chemical species in the African upper troposphere during the monsoon season based upon the assimilation of spaceborne CO observations in a Chemistry Transport Model, Atmos. Chem. Phys., 8, 3231–3246, 2008,
http://www.atmos-chem-phys.net/8/3231/2008/.
Betchold, P., Bazile, E., Guichard, F., et al.: A mass flux convection scheme for regional and global models, Q. J. Roy. Meteor. Soc., 127, 869–886, 2001.
Bouwman, A. F., Van der Hoek, K. W., and Olivier, J. G. J.: Un-certainties in the global source distribution of nitrous oxide, J. Geophys. Res., 100(D2), 2785–2800, 1995.
Brasseur, G., P., Orlando, J. J., and Tyndall, G. S.: Atmospheric chemistry and global change, 2nd edition, Oxford University Press, New York, Oxford, ISBN-0-19-510521-4, 1999.
3956 P. Ricaud et al.: IASI equatorial total column of N2O
NOAA/TOVS satellite observations, Geophys. Res. Lett., 29(8), 1269, doi:10.1029/2001GL014082, 2002.
Clerbaux, C., Hadji-Lazaro, J., Turquety, S., George, M., Coheur, P.-F., Hurtmans, D., Wespes, C., Herbin, H., Blumstein, D., Tournier, B., and Phulpin, T.: The IASI/MetOp-A I Mission: First observations and highlights of its potential contribution to GMES, COSPAR Inf. Bul., 2007, 19–24, 2007.
EUMETSAT, IASI Level 2 Products Guide, EUM/OPS-EPS/MAN/04/0033, available on http://oiswww.eumetsat. org/WEBOPS/eps-pg/IASI-L2/IASIL2-PG-0TOC.htm, 2004. Jacob, D. J., Prather, M. J., Rasch, P. J., et al.: Evaluation and
inter-comparison of global atmospheric transport models using 222Rn and other short-lived tracers, J. Geophys. Res., 102(D5), 5953– 5970, 1997.
Josse, B., Simon, P., and Peuch, V.-H.: Rn-222 global simula-tions with the multiscale CTM MOCAGE, Tellus, 56B, 339–356, 2004.
Lubrano, A. M., Masiello, G., Matricardi, M., Serio, C., and Cuomo, V.: Retrieving N2O from nadir-viewing infrared spec-trometers, Tellus, 56B, 249–261, 2004.
Matricardi, M.: RTIASI-4, a new version of the ECMWF fast ra-diative transfer model for infrared atmospheric sounding inter-ferometer, ECMWF Technical Memorandum No. 425, 63 pp., 2003.
Matricardi, M.: RTIASI-5 user’s guide, Report EUMETSAT Con-tract EUM/CO/02/989/PS, ECMWF, 2004.
Phulpin, T., Blumstein, D., Prel, F., Tournier, B., Prunet, P., and Schl¨ussel, P.: Applications of IASI on MetOp-A: first results and illustration of potential use for meteorology, climate mon-itoring, and atmospheric chemistry, Proc. SPIE, 6684, 66840F, doi:10.1117/12.736816, 2007.
Prinn, R. G., Weiss, R. F., Fraser, P. J., Simmonds, P. G., et al.: A history of chemically and radiatively important gases in air deduced from ALE/GAGE/AGAGE, J. Geophys. Res., 105, 17751–17792, 2000.
Ricaud, P., Barret, B., Atti´e, J.-L., et al.: Impact of land convec-tion on troposphere-stratosphere exchange in the tropics, Atmos. Chem. Phys., 7, 5639–5657, 2007,
http://www.atmos-chem-phys.net/7/5639/2007/.
Ricaud, P., Pommereau, J.-P., Atti´e, J.-L., Le Flochmo¨en, E., El Amraoui, L., Teyss`edre, H., Peuch, V.-H., Feng, W., and Chip-perfield, M. P.: Equatorial transport as diagnosed from nitrous oxide variability, Atmos. Chem. Phys. Discuss., 9, 4899–4930, 2009, http://www.atmos-chem-phys-discuss.net/9/4899/2009/. Rodgers, C. D. and Connor, B. J.: Intercomparison of remote
sounding instruments, J. Geophysical Res., 108(D3), 4116, doi:10.1029/2002JD002299, 2003.
Schl¨ussel, P., Hultberg, T. H., Phillips, P. L., August, T., and Calbet, X.: The operational IASI Level 2 Processor, Adv. Space Res., 36, 982–988, 2005.
Seemann, S. W., Borbas, E. E., Knuteson, R. O., Stephen-son, G. R., and Huang, H.-L.: Development of a Global In-frared Land Surface Emissivity Database for Application to Clear Sky Sounding Retrievals from Multispectral Satellite Ra-diance Measurements, J. Appl. Meteorol. Clim., 47, 1, 108–123, doi:10.1175/2007JAMC1590.1, 2008.
Semeniuk, K., McConnell, J. C., Jin, J. J., Jarosz, J. R., Boone, C. D., Bernath, P. F.: N2O production by high energy au-roral electron precipitation, J. Geophys. Res., 113, D16302, doi:10.1029/2007JD009690, 2008.
Teyss`edre, H., Michou, M., Clark, H. L., et al.: A new tropospheric and stratospheric Chemistry and Transport Model MOCAGE-Climat for multi-year studies: evaluation of the present-day cli-matology and sensitivity to surface processes, Atmos. Chem. Phys., 7, 5815–5860, 2007,
http://www.atmos-chem-phys.net/7/5815/2007/.
Turquety, S., Hadji-Lazaro, J., Clerbaux, C., Hauglustaine, D. A., Clough, S. A., Cass´e, V., Schl¨ussel, P., and M´egie, G.: Op-erational trace gas retrieval algorithm, for the Infrared Atmo-spheric Sounding Interferometer, J. Geophys. Res., 109, D21301, doi:10.1029/2004JD004821, 2004.
World Meteorological Organization, Scientific assessment of ozone depletion: Rep. 50, Geneva, Switzerland, 2006.
Zander, R., Mahieu, E., Demoulin, P., Duchatelet, P., et al.: Evolu-tion of a dozen non-CO2greenhouse gases above central Europe